Aggreko Inc.: Rapid Capital Deployment into Hyperscale Data Centers Counterbalances Balance Sheet Leverage Ahead of NYSE Listing
Date : 2026-09-02
Reading : 88
HDIN Executive Takeaways
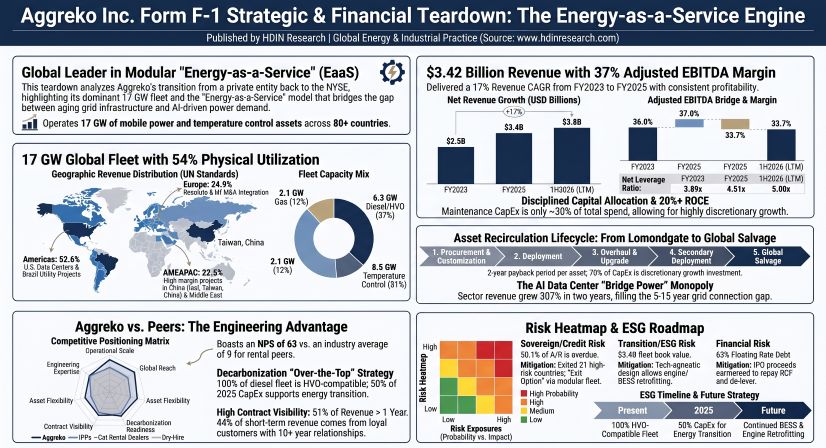
1. Aggreko Inc. [NYSE: AGK] filed its Form F-1 targeting an NYSE listing, recording FY2025 net revenue of $3,416 million (17.0% 2-year CAGR) and Adjusted EBITDA of $1,260 million (37.0% margin).
2. Hyperscale AI data center revenue surged 307.3% across two years to $391 million (11.4% of net revenue), addressing utility interconnection queues through multi-megawatt "bridge power" deployments.
3. Total debt escalated to $7,040 million in 1H2026 (5.00x LTM net leverage); concurrent sponsor injections from TDR Capital and I Squared Capital alongside IPO proceeds target Senior Revolving Facility ($405 million) and term loan de-leveraging.
Figure Aggreko Inc Form F-1 Strategic & Financial Teardown: The Energy-as-a-Service Engine
 Segmental Realities, Earnings Quality and Capital Architecture
Aggreko Inc. operates as an integrated Energy-as-a-Service (EaaS) provider, deploying modular power, temperature control, and microgrid systems. Under ASC 280, the Chief Operating Decision Maker (CODM) evaluates operations through three core geographic segments:
Table Geographic Revenue and Margin Performance: FY2023–FY2025
In 1H2026, consolidated net revenue expanded to $1,918 million (compared to $1,496 million in 1H2025), generating $647 million in Adjusted EBITDA (33.7% margin) and $805 million in Gross Profit exclusive of D&A (42.0% margin).
Revenue disaggregation across client end-markets illustrates increasing exposure to digital infrastructure alongside structural utility demand:
* Utilities: $743 million (29.7%) in FY2023; $811 million (28.4%) in FY2024; $908 million (26.6%) in FY2025.
* Data Centers: $96 million (3.8%) in FY2023; $196 million (6.9%) in FY2024; $391 million (11.4%) in FY2025.
* Building Services & Infrastructure: $266 million (10.6%) in FY2023; $373 million (13.1%) in FY2024; $455 million (13.3%) in FY2025.
* Oil & Gas: $271 million (10.8%) in FY2023; $286 million (10.0%) in FY2024; $339 million (9.9%) in FY2025.
* Petrochemical & Refining: $250 million (10.0%) in FY2023; $276 million (9.7%) in FY2024; $260 million (7.6%) in FY2025.
* Events: $163 million (6.5%) in FY2023; $184 million (6.4%) in FY2024; $229 million (6.7%) in FY2025.
* Mining: $201 million (8.0%) in FY2023; $213 million (7.5%) in FY2024; $214 million (6.3%) in FY2025.
* Manufacturing: $157 million (6.3%) in FY2023; $159 million (5.6%) in FY2024; $183 million (5.4%) in FY2025.
* Other Sectors: $358 million (14.3%) in FY2023; $356 million (12.5%) in FY2024; $437 million (12.8%) in FY2025.
The capital structure reflects substantial leverage resulting from private equity buyout structures and inorganic acquisitions totaling $807 million across 18 transactions since 2023:
* USD Redeemable Senior Secured Notes: $1,400 million at 7.00% fixed, maturing May 21, 2030.
* EUR Redeemable Senior Secured Notes: €850 million ($973 million equivalent) at 5.375% fixed, maturing May 21, 2030.
* USD Senior Term Facility (Tranche B): $2,098 million outstanding (Term SOFR + 3.00%, subject to 0.50% SOFR floor), maturing May 21, 2031.
* EUR Senior Term Facility (Tranche B): €1,692 million ($1,934 million equivalent) outstanding (EURIBOR + 3.00%), maturing May 21, 2031.
* Senior Secured Revolving Credit Facility (RCF): $405 million drawn against a $980 million capacity, maturing February 28, 2030.
* Ancillary Project Facilities: $18 million in Resalta receivables financing, $65 million in project-level facilities (including AETS solar maturing September 2029), and $42 million in construction loans from failed sale-and-leaseback arrangements evaluated under the Fair Value option.
* Current Maturities & Accrued Interest: $105 million due within one year. Total gross balance sheet debt stood at $7,040 million as of July 4, 2026.
Unhedged floating rate debt constitutes 63.0% ($4,437 million) of the total capital pool. With designated Interest Rate Swaps covering only $59 million in notional value (less than 1.4% coverage), every 100 bps shift in benchmark rates alters pre-tax cash interest by $44.37 million per annum.
Quality of Earnings (QoE) reconciliation identifies material non-GAAP adjustments:
* Acquisition and Strategic Review Expenses: Management added back $23 million in FY2023, $16 million in FY2024, $33 million in FY2025, and $14 million in 1H2026 for transaction fees, IPO preparation, and reorganization consulting.
* Discontinued Operations and Write-Downs: Divestment of Russian operations (Eurasia LLC) in November 2025 yielded $28 million against cumulative net losses of $131 million from FY2023 to FY2025. Repatriation of equipment following contract conclusions in Bangladesh generated $11 million in customs penalties during 1H2026.
* Working Capital and Contract Assets: Contract Fulfilment Assets (CFA) capitalizations stood at $170 million as of FY2025 ($182 million in 1H2026), amortizing $59 million in FY2025. Asset Retirement Obligations (ARO) closed at $54 million.
Infrastructure Footprint, Supply Chain Redundancy and Fleet Kinetics
Aggreko deploys an active capacity base of 17,000 MW (17 GW) distributed across approximately 120,000 modular units. Fleet composition comprises:
* Diesel and Hydrotreated Vegetable Oil (HVO) generation units: 6.3 GW (37.1%).
* Natural Gas generation units: 2.1 GW (12.4%), of which 49% are biogas-compatible.
* Solar PV and Battery Energy Storage Systems (BESS): 0.3 GW (1.8%).
* Temperature Control (industrial chillers, heat pumps, air handlers): 8.5 GW (50.0%).
Long-lived operating assets (excluding goodwill, deferred tax, and intangibles) totaled $3,042 million in FY2025 ($2,309 million in FY2024):
* United States: $1,368 million in assets (45.0% of group total); generated $1,299 million in revenue (38.0%).
* Other Americas: $291 million in assets (9.6%); generated $512 million in revenue (15.0%).
* United Kingdom: $243 million in assets (8.0%); generated $233 million in revenue (6.8%).
* Other European Countries: $422 million in assets (13.9%); generated $589 million in revenue (17.2%).
* AMEAPAC: $660 million in assets (21.7%); generated $783 million in revenue (22.9%).
* Headquarters / Unallocated: $58 million in assets (1.9%).
Fleet KPIs enforce strict capital recovery controls:
* Physical Utilization: 54% global average in FY2025, peaking in Q2/Q3 during Northern Hemisphere cooling demand.
* Fleet Yield: Net revenue productivity reached $201,000 per MW deployable in FY2025.
* Underwriting Hurdles: Discretionary expansion enforces an initial Revenue Productivity Hurdle of ≥50% (requiring gross original equipment cost payback in ≤2.0 years) and an Unlevered IRR threshold of ≥15% on long-term contracts.
* Sovereign Credit and Receivable Aging: Gross Accounts Receivable closed FY2025 at $778 million (Gross DSO of 76.7 days vs. standard 30-60 day contract terms). Accounts overdue by >180 days reached $99 million ($44 million >365 days overdue), offset by CECL credit loss allowances of $98 million (12.6% coverage of Gross A/R). In Latin America and AMEAPAC, the top five sovereign utility clients account for 37% of regional revenue.
HDIN Institutional Verdict
Aggreko presents an asymmetric institutional profile: exceptional operating execution and high barriers to entry counterbalanced by aggressive private equity debt structures.
The company's strategic value stems from its capital flexibility and physical fleet redeployability. With 70.5% of FY2025 fleet capex classified as growth investments ($654 million), capital deployment is fully discretionary; if regional macro conditions soften, growth capex can be pared back to preserve $135 million to $199 million in annual Core Free Cash Flow.
While public markets may scrutinize the GAAP net losses ($(145) million in FY23, $(113) million in FY25) generated by $647 million in annual interest charges, the company's operating core remains highly generative, sustaining a Return on Capital Employed (ROCE) of 23.2% in FY2025 and 21.2% in 1H2026.
The proposed recapitalization via concurrent sponsor equity injections and NYSE IPO proceeds directly addresses the RCF balance ($405 million) and term debt, lowering leverage toward normalized targets while solidifying Aggreko's position as the primary bridging-power provider for hyperscale artificial intelligence clusters.
Presentation Download & Video Access:
- Presentation Download: Click the PDF download link under 'Related Topics' to access the full institutional presentation of this report.
- Video Link: Click this link to watch the HDIN analyst briefing on YouTube.
About HDIN Research:
HDIN Research is a premier global market intelligence and strategic advisory firm specializing in institutional-grade financial analysis, supply chain audits, and macroeconomic forecasting. Our dedicated sector analysts deliver actionable, data-driven insights tailored for private equity, hedge funds, and corporate strategy teams. Visit us at http://www.hdinresearch.com.
2026 AI Transparency Footer:
"This intelligence report was authored by HDIN Research analysts following a rigorous audit of official corporate filings. AI was utilized for massive-scale data synthesis and structural drafting, ensuring 100% inclusion of reported data points. All strategic insights, financial modeling, and final verdicts were verified by our editorial board to ensure professional accuracy and compliance with 2026 Google Search E-E-A-T standards."
1. Aggreko Inc. [NYSE: AGK] filed its Form F-1 targeting an NYSE listing, recording FY2025 net revenue of $3,416 million (17.0% 2-year CAGR) and Adjusted EBITDA of $1,260 million (37.0% margin).
2. Hyperscale AI data center revenue surged 307.3% across two years to $391 million (11.4% of net revenue), addressing utility interconnection queues through multi-megawatt "bridge power" deployments.
3. Total debt escalated to $7,040 million in 1H2026 (5.00x LTM net leverage); concurrent sponsor injections from TDR Capital and I Squared Capital alongside IPO proceeds target Senior Revolving Facility ($405 million) and term loan de-leveraging.
Figure Aggreko Inc Form F-1 Strategic & Financial Teardown: The Energy-as-a-Service Engine
Segmental Realities, Earnings Quality and Capital ArchitectureAggreko Inc. operates as an integrated Energy-as-a-Service (EaaS) provider, deploying modular power, temperature control, and microgrid systems. Under ASC 280, the Chief Operating Decision Maker (CODM) evaluates operations through three core geographic segments:
Table Geographic Revenue and Margin Performance: FY2023–FY2025
| Geographic Segment | FY2023 Revenue ($M) | FY2023 Margin (%) | FY2024 Revenue ($M) | FY2024 Margin (%) | FY2025 Revenue ($M) | FY2025 Margin (%) |
| Americas | $1,313 | 40.9% | $1,523 | 41.2% | $1,797 | 41.6% |
| Europe | $505 | 35.2% | $581 | 32.4% | $849 | 30.7% |
| AMEAPAC | $687 | 42.9% | $750 | 45.3% | $770 | 46.2% |
| Corporate / Unallocated | — | — | — | — | $(105) | — |
| Consolidated Total | $2,505 | 36.0% | $2,854 | 37.0% | $3,416 | 37.0% |
In 1H2026, consolidated net revenue expanded to $1,918 million (compared to $1,496 million in 1H2025), generating $647 million in Adjusted EBITDA (33.7% margin) and $805 million in Gross Profit exclusive of D&A (42.0% margin).
Revenue disaggregation across client end-markets illustrates increasing exposure to digital infrastructure alongside structural utility demand:
* Utilities: $743 million (29.7%) in FY2023; $811 million (28.4%) in FY2024; $908 million (26.6%) in FY2025.
* Data Centers: $96 million (3.8%) in FY2023; $196 million (6.9%) in FY2024; $391 million (11.4%) in FY2025.
* Building Services & Infrastructure: $266 million (10.6%) in FY2023; $373 million (13.1%) in FY2024; $455 million (13.3%) in FY2025.
* Oil & Gas: $271 million (10.8%) in FY2023; $286 million (10.0%) in FY2024; $339 million (9.9%) in FY2025.
* Petrochemical & Refining: $250 million (10.0%) in FY2023; $276 million (9.7%) in FY2024; $260 million (7.6%) in FY2025.
* Events: $163 million (6.5%) in FY2023; $184 million (6.4%) in FY2024; $229 million (6.7%) in FY2025.
* Mining: $201 million (8.0%) in FY2023; $213 million (7.5%) in FY2024; $214 million (6.3%) in FY2025.
* Manufacturing: $157 million (6.3%) in FY2023; $159 million (5.6%) in FY2024; $183 million (5.4%) in FY2025.
* Other Sectors: $358 million (14.3%) in FY2023; $356 million (12.5%) in FY2024; $437 million (12.8%) in FY2025.
The capital structure reflects substantial leverage resulting from private equity buyout structures and inorganic acquisitions totaling $807 million across 18 transactions since 2023:
* USD Redeemable Senior Secured Notes: $1,400 million at 7.00% fixed, maturing May 21, 2030.
* EUR Redeemable Senior Secured Notes: €850 million ($973 million equivalent) at 5.375% fixed, maturing May 21, 2030.
* USD Senior Term Facility (Tranche B): $2,098 million outstanding (Term SOFR + 3.00%, subject to 0.50% SOFR floor), maturing May 21, 2031.
* EUR Senior Term Facility (Tranche B): €1,692 million ($1,934 million equivalent) outstanding (EURIBOR + 3.00%), maturing May 21, 2031.
* Senior Secured Revolving Credit Facility (RCF): $405 million drawn against a $980 million capacity, maturing February 28, 2030.
* Ancillary Project Facilities: $18 million in Resalta receivables financing, $65 million in project-level facilities (including AETS solar maturing September 2029), and $42 million in construction loans from failed sale-and-leaseback arrangements evaluated under the Fair Value option.
* Current Maturities & Accrued Interest: $105 million due within one year. Total gross balance sheet debt stood at $7,040 million as of July 4, 2026.
Unhedged floating rate debt constitutes 63.0% ($4,437 million) of the total capital pool. With designated Interest Rate Swaps covering only $59 million in notional value (less than 1.4% coverage), every 100 bps shift in benchmark rates alters pre-tax cash interest by $44.37 million per annum.
Quality of Earnings (QoE) reconciliation identifies material non-GAAP adjustments:
* Acquisition and Strategic Review Expenses: Management added back $23 million in FY2023, $16 million in FY2024, $33 million in FY2025, and $14 million in 1H2026 for transaction fees, IPO preparation, and reorganization consulting.
* Discontinued Operations and Write-Downs: Divestment of Russian operations (Eurasia LLC) in November 2025 yielded $28 million against cumulative net losses of $131 million from FY2023 to FY2025. Repatriation of equipment following contract conclusions in Bangladesh generated $11 million in customs penalties during 1H2026.
* Working Capital and Contract Assets: Contract Fulfilment Assets (CFA) capitalizations stood at $170 million as of FY2025 ($182 million in 1H2026), amortizing $59 million in FY2025. Asset Retirement Obligations (ARO) closed at $54 million.
Infrastructure Footprint, Supply Chain Redundancy and Fleet Kinetics
Aggreko deploys an active capacity base of 17,000 MW (17 GW) distributed across approximately 120,000 modular units. Fleet composition comprises:
* Diesel and Hydrotreated Vegetable Oil (HVO) generation units: 6.3 GW (37.1%).
* Natural Gas generation units: 2.1 GW (12.4%), of which 49% are biogas-compatible.
* Solar PV and Battery Energy Storage Systems (BESS): 0.3 GW (1.8%).
* Temperature Control (industrial chillers, heat pumps, air handlers): 8.5 GW (50.0%).
Long-lived operating assets (excluding goodwill, deferred tax, and intangibles) totaled $3,042 million in FY2025 ($2,309 million in FY2024):
* United States: $1,368 million in assets (45.0% of group total); generated $1,299 million in revenue (38.0%).
* Other Americas: $291 million in assets (9.6%); generated $512 million in revenue (15.0%).
* United Kingdom: $243 million in assets (8.0%); generated $233 million in revenue (6.8%).
* Other European Countries: $422 million in assets (13.9%); generated $589 million in revenue (17.2%).
* AMEAPAC: $660 million in assets (21.7%); generated $783 million in revenue (22.9%).
* Headquarters / Unallocated: $58 million in assets (1.9%).
Fleet KPIs enforce strict capital recovery controls:
* Physical Utilization: 54% global average in FY2025, peaking in Q2/Q3 during Northern Hemisphere cooling demand.
* Fleet Yield: Net revenue productivity reached $201,000 per MW deployable in FY2025.
* Underwriting Hurdles: Discretionary expansion enforces an initial Revenue Productivity Hurdle of ≥50% (requiring gross original equipment cost payback in ≤2.0 years) and an Unlevered IRR threshold of ≥15% on long-term contracts.
* Sovereign Credit and Receivable Aging: Gross Accounts Receivable closed FY2025 at $778 million (Gross DSO of 76.7 days vs. standard 30-60 day contract terms). Accounts overdue by >180 days reached $99 million ($44 million >365 days overdue), offset by CECL credit loss allowances of $98 million (12.6% coverage of Gross A/R). In Latin America and AMEAPAC, the top five sovereign utility clients account for 37% of regional revenue.
HDIN Institutional Verdict
Aggreko presents an asymmetric institutional profile: exceptional operating execution and high barriers to entry counterbalanced by aggressive private equity debt structures.
The company's strategic value stems from its capital flexibility and physical fleet redeployability. With 70.5% of FY2025 fleet capex classified as growth investments ($654 million), capital deployment is fully discretionary; if regional macro conditions soften, growth capex can be pared back to preserve $135 million to $199 million in annual Core Free Cash Flow.
While public markets may scrutinize the GAAP net losses ($(145) million in FY23, $(113) million in FY25) generated by $647 million in annual interest charges, the company's operating core remains highly generative, sustaining a Return on Capital Employed (ROCE) of 23.2% in FY2025 and 21.2% in 1H2026.
The proposed recapitalization via concurrent sponsor equity injections and NYSE IPO proceeds directly addresses the RCF balance ($405 million) and term debt, lowering leverage toward normalized targets while solidifying Aggreko's position as the primary bridging-power provider for hyperscale artificial intelligence clusters.
Presentation Download & Video Access:
- Presentation Download: Click the PDF download link under 'Related Topics' to access the full institutional presentation of this report.
- Video Link: Click this link to watch the HDIN analyst briefing on YouTube.
About HDIN Research:
HDIN Research is a premier global market intelligence and strategic advisory firm specializing in institutional-grade financial analysis, supply chain audits, and macroeconomic forecasting. Our dedicated sector analysts deliver actionable, data-driven insights tailored for private equity, hedge funds, and corporate strategy teams. Visit us at http://www.hdinresearch.com.
2026 AI Transparency Footer:
"This intelligence report was authored by HDIN Research analysts following a rigorous audit of official corporate filings. AI was utilized for massive-scale data synthesis and structural drafting, ensuring 100% inclusion of reported data points. All strategic insights, financial modeling, and final verdicts were verified by our editorial board to ensure professional accuracy and compliance with 2026 Google Search E-E-A-T standards."