Globee Inc.: B2B Channel Expansion and Capitalized R&D Anchor Operating Profile as Front-Loaded SG&A Reinvestment Compresses Operating Margin by 352 bps
Date : 2026-09-03
Reading : 225
HDIN Executive Takeaways
1. Globee Inc. [TSE Growth: 5575] expanded net revenue 24.94% to $13.68M (¥2.05B) in FY2026, though operating margin compressed 352 bps to 21.61% due to a 49.45% surge in SG&A.
2. The abceed platform advanced its B2B footprint to 690 secondary schools (55.87% 5-year CAGR) and 385 corporate clients across Japan, driving negative working capital with a -153.64-day Modified Cash Conversion Cycle.
3. Technology capitalization absorbed 62.83% ($1.28M) of total engineering spend, insulating current gross margin at 48.63% while external publisher royalties and platform fees claimed 89.6% of raw manufacturing costs.
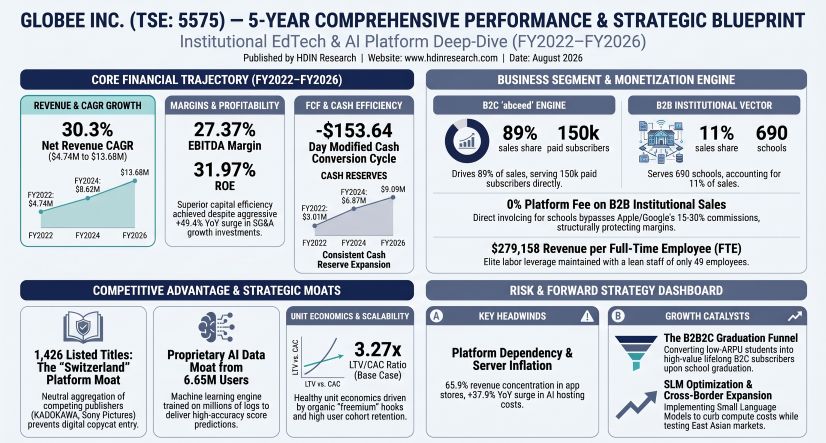
Figure GLOBEE INC. 5-YEAR COMPREHENSIVE PERFORMANCE & STRATEGIC BLUEPRINT
 Segmental Realities, Capitalization Policies, and Margin Compression
Globee Inc. closed FY2026 (ended May 31, 2026) with consolidated net revenue of $13,678,640 (¥2,045,895 thousand), marking a 24.94% YoY increase from $10,948,307 (¥1,637,523 thousand) in FY2025 and completing a 30.3% compound annual growth rate (CAGR) from FY2022. Total operating profit reached $2,956,570 (¥442,210 thousand), up 7.47% YoY, while net income expanded 12.92% YoY to $2,126,255 (¥318,021 thousand).
Table Five-Year Financial Performance, Cash Flow, and Return on Equity Analysis: FY2022–FY2026
*Under Japanese GAAP, detailed line-item statements for Gross Profit and Operating Profit are required exclusively for the two most recent fiscal cycles (FY2025–FY2026).*
Gross margin expanded 92 bps to 48.63% in FY2026, supported by an internal software capitalization transfer of $1,275,582 (¥190,787 thousand) that offset raw production expenses. Total manufacturing costs reached $8,302,311 (¥1,241,765 thousand). Raw cost allocations comprised:
* Content Publisher Royalties: $5,632,225 (¥842,414 thousand), accounting for 67.84% of manufacturing costs (down 148 bps YoY from 69.32%) and 41.18% of net sales (down 319 bps YoY from 44.37%).
* Settlement Commissions: $1,809,123 (¥270,588 thousand), or 21.79% of manufacturing costs. Blended retail platform commission fees declined from 15.55% in FY2025 to 14.86% in FY2026 across Apple App Store, Google Play Store, and SoftBank billing gateways.
* Server and Cloud Hosting Expenses: $860,890 (¥128,762 thousand), representing 10.37% of manufacturing costs. Server costs increased 37.88% YoY, surpassing top-line revenue growth by 12.94 percentage points and rising from 5.70% to 6.29% of net revenue due to API-driven generative AI coaching queries.
Operating margin contracted 352 bps to 21.61% as selling, general, and administrative (SG&A) expenses rose 49.45% YoY to $3,695,341 (¥552,707 thousand). Advertising and sales promotion expenditure climbed 111.9% to $1,436,425 (¥214,844 thousand), up from $677,295 (¥101,302 thousand) in FY2025. This drove the analytical customer acquisition cost (CAC) for incremental net paid subscribers (33,000 additions in FY2026 vs. 16,000 in FY2025) from $42.33 to $43.53 per user. Expensed research and development rose 42.0% YoY to $754,522 (¥112,853 thousand). Total technology expenditure stood at $2,030,104 (¥303,640 thousand), of which 62.83% was capitalized to intangible assets, moderating from a 70.71% capitalization ratio in FY2025. If 100% of software engineering spend had been expensed directly, FY2026 gross margin would have settled at 39.30% and operating margin at 12.28%.
Institutional Infrastructure, Platform Distribution, and Working Capital Profile
Globee Inc. runs entirely within Japan, with domestic customer sales exceeding 90% of consolidated revenues, omitting geographic segment disclosures under Japanese GAAP. The physical operating structure consists of corporate headquarters in Tokyo with a total full-time equivalent (FTE) headcount of 49 as of May 31, 2026 (up from 48 FTEs in FY2025). Revenue per employee improved 22.39% YoY to $279,158 (¥41,753 thousand), up from $228,090 (¥34,115 thousand).
Platform distribution exhibits high gateway concentration:
* Apple Inc. [NASDAQ: AAPL]: Channeled $7,712,942 (¥1,153,614 thousand), or 56.39% of consolidated net sales.
* SoftBank Corp. [TSE: 9434]: Processed $3,151,403 (¥471,351 thousand), or 23.04% of consolidated net sales.
* Google LLC [NASDAQ: GOOGL]: Represented $1,309,171 (¥195,811 thousand), or 9.57% of consolidated net sales.
* Total B2C settlement channels accounted for 89.00% ($12,173,516) of FY2026 revenues, while direct-invoiced institutional channels represented 11.00%.
Table Platform Growth and Key Operating KPI Development: FY2021–FY2026
Content partnerships expanded to 1,426 listed digital titles across third-party publishers, including KADOKAWA Corporation, to which trade payables stood at $210,265 (¥31,449 thousand) at fiscal year-end, and Paramount Pictures International Limited, which received $150,906 (¥22,571 thousand) in FY2026 royalties for movie audio scripts.
The balance sheet is unleveraged with zero bank loans or bonds payable. Cash and cash equivalents stood at $9,094,289 (¥1,360,221 thousand), covering total liabilities of $10,000,000. Interest-bearing debt was limited to $185,801 (¥27,790 thousand) in lease obligations, representing 2.56% of total equity. Contract liabilities (deferred revenue from upfront subscription prepayments) rose 19.66% YoY to $7,137,601 (¥1,067,561 thousand), following a 31.81% increase in FY2025. Standard working capital metrics yielded Days Sales Outstanding (DSO) of 68.08 days, Days Inventory Outstanding (DIO) of 0.00 days, and Days Payable Outstanding (DPO) of 31.26 days (CCC: 36.82 days). Incorporating Deferred Revenue Days Outstanding (DDRO) of 190.46 days established a negative Modified Cash Conversion Cycle of -153.64 days:
Modified CCC = 68.08 + 0.00 - 31.26 - 190.46 = -153.64 days
In FY2026, Globee executed a capital return program, deploying $1,716,043 (¥256,656 thousand) to repurchase 3.76% of outstanding equity, retaining $921,203 (¥137,782 thousand) as treasury stock. Founder & CEO Kenzaburo Ikushima retains absolute control with 71.77% of voting rights (65.68% direct; 6.09% via asset vehicle IKUSHIMA Co., Ltd.), while executive board equity stands at 70.44%. The Audit & Supervisory Board comprises 100% independent outside auditors who identified automated database controls for unearned revenue recognition as the sole Key Audit Matter (KAM), rendering an Unqualified Clean Opinion. Board gender diversity is 0.00%, outside director representation on the board of directors is 25.00% (1 of 4), and aggregate annual board cash remuneration is capped at $468,013 (¥70,000 thousand).
HDIN Institutional Verdict
Management's assertion that operating margin compression (-352 bps) represents an intentional reinvestment phase is corroborated by hard metrics: CAC remained stable at $43.53 despite a 111.9% marketing expansion, and paid subscriber volumes grew 28.21% YoY to 150,000. However, the 37.88% surge in hosting compute costs highlights an emerging operational vulnerability—linear generative AI inference costs outpacing consolidated revenue expansion (+24.94%). Furthermore, while capitalizing 62.83% of engineering costs supported gross margins at 48.63%, pure-cash SaaS comparisons require adjusting for the $1.28M capitalized payroll shift. Globee's structural hedge against app store take-rates rests on its institutional division ("abceed for school"), which expanded to 690 contracts (+35.78% 4-year CAGR); sustaining negative working capital depends on expanding direct-invoiced accounts to dilute retail platform concentration.
Presentation Download & Video Access:
- Presentation Download: Click the PDF download link under 'Related Topics' to access the full institutional presentation of this report.
- Video Link: Click this link to watch the HDIN analyst briefing on YouTube.
About HDIN Research:
HDIN Research is a premier global market intelligence and strategic advisory firm specializing in institutional-grade financial analysis, supply chain audits, and macroeconomic forecasting. Our dedicated sector analysts deliver actionable, data-driven insights tailored for private equity, hedge funds, and corporate strategy teams. Visit us at http://www.hdinresearch.com.
2026 AI Transparency Footer:
"This intelligence report was authored by HDIN Research analysts following a rigorous audit of official corporate filings. AI was utilized for massive-scale data synthesis and structural drafting, ensuring 100% inclusion of reported data points. All strategic insights, financial modeling, and final verdicts were verified by our editorial board to ensure professional accuracy and compliance with 2026 Google Search E-E-A-T standards."
1. Globee Inc. [TSE Growth: 5575] expanded net revenue 24.94% to $13.68M (¥2.05B) in FY2026, though operating margin compressed 352 bps to 21.61% due to a 49.45% surge in SG&A.
2. The abceed platform advanced its B2B footprint to 690 secondary schools (55.87% 5-year CAGR) and 385 corporate clients across Japan, driving negative working capital with a -153.64-day Modified Cash Conversion Cycle.
3. Technology capitalization absorbed 62.83% ($1.28M) of total engineering spend, insulating current gross margin at 48.63% while external publisher royalties and platform fees claimed 89.6% of raw manufacturing costs.
Figure GLOBEE INC. 5-YEAR COMPREHENSIVE PERFORMANCE & STRATEGIC BLUEPRINT
Segmental Realities, Capitalization Policies, and Margin CompressionGlobee Inc. closed FY2026 (ended May 31, 2026) with consolidated net revenue of $13,678,640 (¥2,045,895 thousand), marking a 24.94% YoY increase from $10,948,307 (¥1,637,523 thousand) in FY2025 and completing a 30.3% compound annual growth rate (CAGR) from FY2022. Total operating profit reached $2,956,570 (¥442,210 thousand), up 7.47% YoY, while net income expanded 12.92% YoY to $2,126,255 (¥318,021 thousand).
Table Five-Year Financial Performance, Cash Flow, and Return on Equity Analysis: FY2022–FY2026
| Metric (Audited J-GAAP / USD Converted at 149.5686 JPY) | FY2022 | FY2023 | FY2024 | FY2025 | FY2026 |
| Net Revenue (JPY '000) | ¥709,387 | ¥947,668 | ¥1,288,764 | ¥1,637,523 | ¥2,045,895 |
| Net Revenue (USD) | $4,742,887 | $6,336,009 | $8,616,541 | $10,948,307 | $13,678,640 |
| YoY Revenue Growth (%) | — | +33.59% | +35.99% | +27.06% | +24.94% |
| Gross Profit (USD) | — | — | — | $5,223,757 | $6,651,911 |
| Gross Margin (%) | — | — | — | 47.71% | 48.63% |
| Operating Profit (USD) | — | — | — | $2,751,119 | $2,956,570 |
| Operating Margin (%) | — | — | — | 25.13% | 21.61% |
| EBITDA (USD) | — | — | — | $3,307,479 | $3,744,041 |
| EBITDA Margin (%) | — | — | — | 30.21% | 27.37% |
| Ordinary Profit (USD) | $416,899 | $1,616,462 | $2,140,449 | $2,729,102 | $2,994,272 |
| Net Income (USD) | $363,780 | $1,153,177 | $1,516,535 | $1,882,989 | $2,126,255 |
| Operating Cash Flow (USD) | $1,513,252 | $1,805,359 | $2,590,437 | $2,589,601 | $4,404,855 |
| Free Cash Flow (USD) | $1,513,252 | $971,340 | $1,558,355 | $1,161,781 | $3,091,357 |
| Cash & Cash Equivalents (USD) | $3,011,247 | $3,670,643 | $6,868,180 | $7,701,369 | $9,094,289 |
| Return on Equity (ROE) (%) | 74.57% | 92.53% | 51.00% | 37.09% | 31.97% |
Gross margin expanded 92 bps to 48.63% in FY2026, supported by an internal software capitalization transfer of $1,275,582 (¥190,787 thousand) that offset raw production expenses. Total manufacturing costs reached $8,302,311 (¥1,241,765 thousand). Raw cost allocations comprised:
* Content Publisher Royalties: $5,632,225 (¥842,414 thousand), accounting for 67.84% of manufacturing costs (down 148 bps YoY from 69.32%) and 41.18% of net sales (down 319 bps YoY from 44.37%).
* Settlement Commissions: $1,809,123 (¥270,588 thousand), or 21.79% of manufacturing costs. Blended retail platform commission fees declined from 15.55% in FY2025 to 14.86% in FY2026 across Apple App Store, Google Play Store, and SoftBank billing gateways.
* Server and Cloud Hosting Expenses: $860,890 (¥128,762 thousand), representing 10.37% of manufacturing costs. Server costs increased 37.88% YoY, surpassing top-line revenue growth by 12.94 percentage points and rising from 5.70% to 6.29% of net revenue due to API-driven generative AI coaching queries.
Operating margin contracted 352 bps to 21.61% as selling, general, and administrative (SG&A) expenses rose 49.45% YoY to $3,695,341 (¥552,707 thousand). Advertising and sales promotion expenditure climbed 111.9% to $1,436,425 (¥214,844 thousand), up from $677,295 (¥101,302 thousand) in FY2025. This drove the analytical customer acquisition cost (CAC) for incremental net paid subscribers (33,000 additions in FY2026 vs. 16,000 in FY2025) from $42.33 to $43.53 per user. Expensed research and development rose 42.0% YoY to $754,522 (¥112,853 thousand). Total technology expenditure stood at $2,030,104 (¥303,640 thousand), of which 62.83% was capitalized to intangible assets, moderating from a 70.71% capitalization ratio in FY2025. If 100% of software engineering spend had been expensed directly, FY2026 gross margin would have settled at 39.30% and operating margin at 12.28%.
Institutional Infrastructure, Platform Distribution, and Working Capital Profile
Globee Inc. runs entirely within Japan, with domestic customer sales exceeding 90% of consolidated revenues, omitting geographic segment disclosures under Japanese GAAP. The physical operating structure consists of corporate headquarters in Tokyo with a total full-time equivalent (FTE) headcount of 49 as of May 31, 2026 (up from 48 FTEs in FY2025). Revenue per employee improved 22.39% YoY to $279,158 (¥41,753 thousand), up from $228,090 (¥34,115 thousand).
Platform distribution exhibits high gateway concentration:
* Apple Inc. [NASDAQ: AAPL]: Channeled $7,712,942 (¥1,153,614 thousand), or 56.39% of consolidated net sales.
* SoftBank Corp. [TSE: 9434]: Processed $3,151,403 (¥471,351 thousand), or 23.04% of consolidated net sales.
* Google LLC [NASDAQ: GOOGL]: Represented $1,309,171 (¥195,811 thousand), or 9.57% of consolidated net sales.
* Total B2C settlement channels accounted for 89.00% ($12,173,516) of FY2026 revenues, while direct-invoiced institutional channels represented 11.00%.
Table Platform Growth and Key Operating KPI Development: FY2021–FY2026
| Operational Indicator / KPI | FY2021 | FY2022 | FY2023 | FY2024 | FY2025 | FY2026 | 5-Year CAGR |
| Cumulative Platform Users | 1,797,000 | 2,576,000 | 3,432,000 | 4,486,000 | 5,584,000 | 6,651,000 | 29.92% |
| Paid Subscribers (Total) | 32,000 | 57,000 | 76,000 | 101,000 | 117,000 | 150,000 | 36.20% |
| Listed Content Library (Titles) | 380 | 550 | 747 | 1,044 | 1,230 | 1,426 | 30.28% |
| School Contracts (B2B/B2G) | 75 | 203 | 317 | 430 | 553 | 690 | 55.87% |
| Corporate Contracts (B2B) | 74 | 177 | 224 | 257 | 315 | 385 | 39.07% |
| Blended Annual ARPU (Est.) | — | $83.21 | $83.37 | $85.31 | $100.44 | $102.46 | — |
Content partnerships expanded to 1,426 listed digital titles across third-party publishers, including KADOKAWA Corporation, to which trade payables stood at $210,265 (¥31,449 thousand) at fiscal year-end, and Paramount Pictures International Limited, which received $150,906 (¥22,571 thousand) in FY2026 royalties for movie audio scripts.
The balance sheet is unleveraged with zero bank loans or bonds payable. Cash and cash equivalents stood at $9,094,289 (¥1,360,221 thousand), covering total liabilities of $10,000,000. Interest-bearing debt was limited to $185,801 (¥27,790 thousand) in lease obligations, representing 2.56% of total equity. Contract liabilities (deferred revenue from upfront subscription prepayments) rose 19.66% YoY to $7,137,601 (¥1,067,561 thousand), following a 31.81% increase in FY2025. Standard working capital metrics yielded Days Sales Outstanding (DSO) of 68.08 days, Days Inventory Outstanding (DIO) of 0.00 days, and Days Payable Outstanding (DPO) of 31.26 days (CCC: 36.82 days). Incorporating Deferred Revenue Days Outstanding (DDRO) of 190.46 days established a negative Modified Cash Conversion Cycle of -153.64 days:
Modified CCC = 68.08 + 0.00 - 31.26 - 190.46 = -153.64 days
In FY2026, Globee executed a capital return program, deploying $1,716,043 (¥256,656 thousand) to repurchase 3.76% of outstanding equity, retaining $921,203 (¥137,782 thousand) as treasury stock. Founder & CEO Kenzaburo Ikushima retains absolute control with 71.77% of voting rights (65.68% direct; 6.09% via asset vehicle IKUSHIMA Co., Ltd.), while executive board equity stands at 70.44%. The Audit & Supervisory Board comprises 100% independent outside auditors who identified automated database controls for unearned revenue recognition as the sole Key Audit Matter (KAM), rendering an Unqualified Clean Opinion. Board gender diversity is 0.00%, outside director representation on the board of directors is 25.00% (1 of 4), and aggregate annual board cash remuneration is capped at $468,013 (¥70,000 thousand).
HDIN Institutional Verdict
Management's assertion that operating margin compression (-352 bps) represents an intentional reinvestment phase is corroborated by hard metrics: CAC remained stable at $43.53 despite a 111.9% marketing expansion, and paid subscriber volumes grew 28.21% YoY to 150,000. However, the 37.88% surge in hosting compute costs highlights an emerging operational vulnerability—linear generative AI inference costs outpacing consolidated revenue expansion (+24.94%). Furthermore, while capitalizing 62.83% of engineering costs supported gross margins at 48.63%, pure-cash SaaS comparisons require adjusting for the $1.28M capitalized payroll shift. Globee's structural hedge against app store take-rates rests on its institutional division ("abceed for school"), which expanded to 690 contracts (+35.78% 4-year CAGR); sustaining negative working capital depends on expanding direct-invoiced accounts to dilute retail platform concentration.
Presentation Download & Video Access:
- Presentation Download: Click the PDF download link under 'Related Topics' to access the full institutional presentation of this report.
- Video Link: Click this link to watch the HDIN analyst briefing on YouTube.
About HDIN Research:
HDIN Research is a premier global market intelligence and strategic advisory firm specializing in institutional-grade financial analysis, supply chain audits, and macroeconomic forecasting. Our dedicated sector analysts deliver actionable, data-driven insights tailored for private equity, hedge funds, and corporate strategy teams. Visit us at http://www.hdinresearch.com.
2026 AI Transparency Footer:
"This intelligence report was authored by HDIN Research analysts following a rigorous audit of official corporate filings. AI was utilized for massive-scale data synthesis and structural drafting, ensuring 100% inclusion of reported data points. All strategic insights, financial modeling, and final verdicts were verified by our editorial board to ensure professional accuracy and compliance with 2026 Google Search E-E-A-T standards."