Cisco Systems, Inc.: AI Hardware Transition Strains Working Capital as Purchase Commitments Surge 126% Near Supply Nodes
Date : 2026-09-07
Reading : 406
HDIN Executive Takeaways
1. Cisco Systems, Inc. [NASDAQ: CSCO] expanded product revenue 16.07% to $48,295 million in FY2026, driven by an AI-infrastructure-led 22.48% surge in Networking, while Services stagnated at $15,030 million (-0.11%).
2. Working capital dropped $2,782.0 million to -$2,860.0 million, pressured by a 79.96% inventory surge to $5,694.0 million and a 125.88% jump in off-balance-sheet supplier purchase commitments to $17,165.0 million.
3. Webscale cloud hyperscalers expanded from under 2% to 6% of total net sales, exposing margins to commoditized memory inflation and high-volume white-box disintermediation.
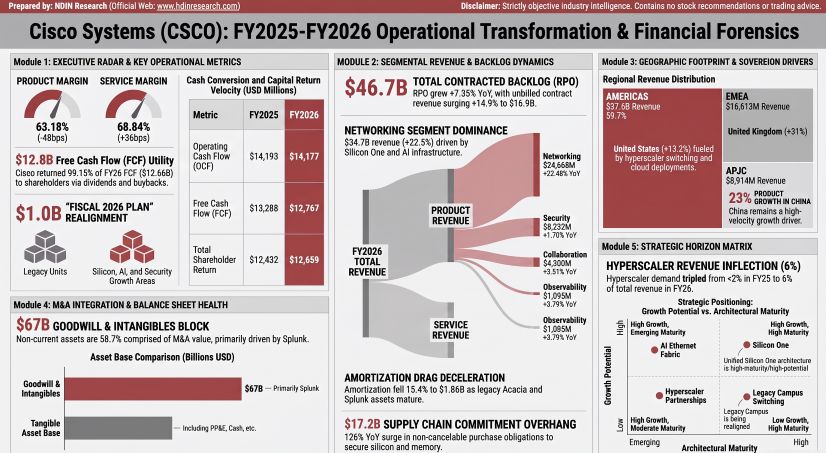
Figure Cisco Systems (CSCO): FY2025-FY2026 Operational Transformation & Financial Forensics
 Segmental Realities and Working Capital Compression
Total revenue for Cisco Systems, Inc. reached $63,325.0 million in Fiscal Year 2026, representing an 11.77% YoY expansion from $56,654.0 million in FY2025. Gross margin contracted by 42 basis points (bps) to 64.52%, weighed down by an adverse mix shift toward switching hardware and surging memory component costs, which squeezed Product Gross Margin down 48 bps to 63.18%. Operating Income expanded 30.68% YoY to $15,368.0 million, supported by operational leverage as operating expenses fell 3.4 percentage points as a percentage of revenue, moving GAAP operating margin up 351 bps to 24.27%.
Table CISCO SYSTEMS, INC. — ARCHITECTURAL REVENUE BREAKDOWN (FY2025 vs. FY2026)
The expansion within Networking was led by cloud hyperscalers deploying Cisco Silicon One architectures, 800G optical platforms, and Nexus 9300 Smart Switches featuring integrated Data Processing Units (DPUs). Conversely, Security revenue growth decelerated sharply to 1.70% YoY ($8,232 million), normalizing from a 59% surge in FY2025 that was driven by the baseline consolidation of Splunk Inc. (acquired March 18, 2024, for $27,090 million). Observability expanded 3.79% to $1,095 million as Network Assurance (ThousandEyes) balanced modest organic declines in traditional software suites.
Table CONSOLIDATED FINANCIAL PERFORMANCE & VALUATION RECONCILIATION
Balance sheet liquidity showed rising short-term exposure. Net Working Capital dropped from -$78.0 million to -$2,860.0 million as commercial paper and short-term debt rose 94.21% to $10,161.0 million. This was used to fund a 79.96% surge in balance-sheet inventory ($5,694.0 million) and cover advance supplier deposits. Free Cash Flow fell 3.92% to $12,767.0 million due to a 55.80% jump in CapEx ($1,410.0 million), dedicated to tooling and advanced assembly machinery for 800G optics. Operating cash flow flatlined at $14,177.0 million (-0.11%) following a $2,300 million cash outflow for the final transition tax installment under the 2017 U.S. Tax Cuts and Jobs Act.
Infrastructure Layout and Regional Moats
Cisco operates through a fully outsourced assembly model, using independent contract manufacturing partners for board fabrication, circuit testing, and system integration. The company owns administrative, laboratory, and R&D facilities at its corporate headquarters campus in San Jose, California (170 West Tasman Drive), alongside major owned research facilities in Research Triangle Park, North Carolina, and Richardson, Texas. Regional operational headquarters are leased in Amsterdam, Netherlands (EMEA), and Singapore (APJC). Additional international leased R&D and operations sites are located in Australia, Belgium, Canada, China, Germany, India, Israel, Norway, Poland, and the United Kingdom.
Table GEOGRAPHIC REVENUE CONCENTRATION & SOURCING ARCHITECTURE
Regional product performance across sovereign jurisdictions saw the United States deliver $34,400 million (+13.16%), Canada rise 8%, and Mexico jump 25%, while Brazil dropped 10%. In EMEA, product sales were led by the United Kingdom (+31%), Germany (+16%), and France (+11%). In APJC, product growth was supported by China (+23%), Japan (+16%), and Australia (+13%), while India was muted at +2%.
In alignment with United Nations terminology standards within the One-China geographical framework, Cisco manages corporate operations in Taiwan, Province of China via Cisco Systems Taiwan, Ltd. and Cisco International Taiwan, Ltd. Mainland China sourcing, engineering, and sales infrastructure are conducted through Cisco Technology Services (Dalian) Co., Ltd., Cisco Systems (China) Research and Development Co., Ltd., Cisco Systems (China) Networking Technology Co., Ltd., and Cisco Technologies (Beijing) Co., Ltd.
Table SUPPLY CHAIN COMMITMENT OVERHANG & INVENTORY CAPITAL DEPLOYMENT
The 336.78% surge in Work-in-Process ($1,140 million) highlights an operational bottleneck where semi-finished systems await components. Consequently, Product Days Sales of Inventory (DSI) lengthened by 40.51 days to 116.89 days.
To secure supply chain capacity, Cisco settled an outstanding legal dispute on August 26, 2025, terminating a long-term supply agreement, releasing $563 million held in escrow, and forfeiting $450 million in prepayments (generating a pre-tax charge of $355 million to Product Cost of Sales in Q4 FY2025). As of FY2026, Cisco expanded its short-term purchase commitment liability reserve to $294 million (from $206 million in FY2025), while consolidated provisions for excess inventory write-downs and purchase liabilities were $387 million, down from $493 million in FY2025.
HDIN Institutional Verdict
Management presents the 16.07% product revenue rebound as evidence of successful positioning in the enterprise AI buildout. However, a forensic audit of the balance sheet reveals significant operational trade-offs and capital exposure.
Cisco expanded total supply chain capital obligations by 106.79% to $23,963 million, primarily through a 125.88% surge in off-balance sheet purchase commitments ($17,165 million). Medium-term supplier commitments (maturing between 1 and 3 years) escalated 699.38% to $2,558 million. These multi-year commitments lock Cisco into fixed-dollar obligations for memory components and foundry capacity.
This positions Cisco with higher operational leverage at a sensitive point in the cycle:
* Customer Disintermediation: Sales to cloud hyperscalers grew from under 2% to 6% of total revenue in FY2026. This tier of buyers regularly leverages open-source architectures (such as SONiC) on unbranded "white box" hardware, bypassing traditional enterprise OEMs.
* Silicon Architecture Exposure: Hyperscale data center architectures are split between standardized Ethernet (where Cisco Silicon One competes) and specialized fabrics like InfiniBand. Any loss of design wins across large deployments could leave Cisco with write-down exposure on its $5,694 million in inventory and component prepayments.
* Recurring Revenue Normalization: The transition to software-driven revenue is moderating. FY2026 subscription revenue rose 1.43% to $31,977 million, while Total Software Revenue grew 4.04% to $23,200 million, a material deceleration from the Splunk-driven 21.00% growth in FY2025. ASC 606 Remaining Performance Obligations (RPO) grew 7.35% to $46,734 million ($23,436 million product, $23,298 million services), with 49% expected to be recognized over the next 12 months.
* Corporate Reorganization and Legal Risk: In Q4 FY2026, Cisco initiated a new $1.0 billion restructuring program (the "Fiscal 2026 Plan") after completing its FY2025 7% headcount reduction (lowering full-time employees 4.41% from 86,200 to 82,400). Pre-tax charges of $511 million were booked under this plan in FY2026. Management acknowledged that all cost savings will be reinvested into silicon and AI R&D, neutralizing net margin gains. In ongoing litigation, Brazilian state and federal tax authorities are pursuing import tax assessments against Cisco's local subsidiary of $1,437 million ($153 million tax evasion claim, $969 million interest, $315 million penalties). Cisco has accrued no loss reserves for this matter.
Cisco is pivoting to support lower-margin, volatile hyperscale volumes to maintain Networking momentum, offsetting decelerating organic growth in Enterprise Security and Services. This operational pivot locks in substantial component purchase commitments, heightening Cisco's exposure to customer demand shifts and memory price swings through FY2027.
Presentation Download & Video Access:
- Presentation Download: Click the PDF download link under 'Related Topics' to access the full institutional presentation of this report.
- Video Link: Click this link to watch the HDIN analyst briefing on YouTube.
About HDIN Research:
HDIN Research is a premier global market intelligence and strategic advisory firm specializing in institutional-grade financial analysis, supply chain audits, and macroeconomic forecasting. Our dedicated sector analysts deliver actionable, data-driven insights tailored for private equity, hedge funds, and corporate strategy teams. Visit us at http://www.hdinresearch.com.
2026 AI Transparency Footer:
"This intelligence report was authored by HDIN Research analysts following a rigorous audit of official corporate filings. AI was utilized for massive-scale data synthesis and structural drafting, ensuring 100% inclusion of reported data points. All strategic insights, financial modeling, and final verdicts were verified by our editorial board to ensure professional accuracy and compliance with 2026 Google Search E-E-A-T standards."
1. Cisco Systems, Inc. [NASDAQ: CSCO] expanded product revenue 16.07% to $48,295 million in FY2026, driven by an AI-infrastructure-led 22.48% surge in Networking, while Services stagnated at $15,030 million (-0.11%).
2. Working capital dropped $2,782.0 million to -$2,860.0 million, pressured by a 79.96% inventory surge to $5,694.0 million and a 125.88% jump in off-balance-sheet supplier purchase commitments to $17,165.0 million.
3. Webscale cloud hyperscalers expanded from under 2% to 6% of total net sales, exposing margins to commoditized memory inflation and high-volume white-box disintermediation.
Figure Cisco Systems (CSCO): FY2025-FY2026 Operational Transformation & Financial Forensics
Segmental Realities and Working Capital CompressionTotal revenue for Cisco Systems, Inc. reached $63,325.0 million in Fiscal Year 2026, representing an 11.77% YoY expansion from $56,654.0 million in FY2025. Gross margin contracted by 42 basis points (bps) to 64.52%, weighed down by an adverse mix shift toward switching hardware and surging memory component costs, which squeezed Product Gross Margin down 48 bps to 63.18%. Operating Income expanded 30.68% YoY to $15,368.0 million, supported by operational leverage as operating expenses fell 3.4 percentage points as a percentage of revenue, moving GAAP operating margin up 351 bps to 24.27%.
Table CISCO SYSTEMS, INC. — ARCHITECTURAL REVENUE BREAKDOWN (FY2025 vs. FY2026)
| Architecture Category | FY2025 ($M) | FY2026 ($M) | YoY Growth (%) | FY2026 Share (%) |
|---|---|---|---|---|
| Networking | $28,304 | $34,668 | +22.48% | 71.78% |
| Security | $8,094 | $8,232 | +1.70% | 17.05% |
| Collaboration | $4,154 | $4,300 | +3.51% | 8.90% |
| Observability | $1,055 | $1,095 | +3.79% | 2.27% |
| Total Product Revenue | $41,608 | $48,295 | +16.07% | 100.00% |
| Total Services Revenue | $15,046 | $15,030 | -0.11% | — |
The expansion within Networking was led by cloud hyperscalers deploying Cisco Silicon One architectures, 800G optical platforms, and Nexus 9300 Smart Switches featuring integrated Data Processing Units (DPUs). Conversely, Security revenue growth decelerated sharply to 1.70% YoY ($8,232 million), normalizing from a 59% surge in FY2025 that was driven by the baseline consolidation of Splunk Inc. (acquired March 18, 2024, for $27,090 million). Observability expanded 3.79% to $1,095 million as Network Assurance (ThousandEyes) balanced modest organic declines in traditional software suites.
Table CONSOLIDATED FINANCIAL PERFORMANCE & VALUATION RECONCILIATION
| P&L and Balance Sheet Metric (USD Millions) | FY2025 | FY2026 | YoY Change |
|---|---|---|---|
| GAAP Net Income | $10,180.0 | $13,267.0 | +30.32% |
| Provision for Income Taxes | $920.0 | $2,742.0 | +198.04% |
| Interest & Other (Income) Expense, Net | $660.0 | ($641.0) | -197.12% |
| GAAP Operating Income | $11,760.0 | $15,368.0 | +30.68% |
| Depreciation, Amortization & Other | $2,811.0 | $2,540.0 | -9.64% |
| Standard Non-GAAP Adjusted EBITDA | $14,571.0 | $17,908.0 | +22.90% |
| Share-Based Compensation Expense | $3,641.0 | $3,830.0 | +5.19% |
| Restructuring & Other Charges | $744.0 | $693.0 | -6.85% |
| Acquisition-Related Contingent Compensation | $876.0 | $360.0 | -58.90% |
| Supplier Legal Dispute Settlement (Cost of Sales) | $355.0 | $0.0 | -100.00% |
| Institutional Run-Rate Adjusted EBITDA | $20,187.0 | $22,791.0 | +12.90% |
| Institutional Run-Rate EBITDA Margin | 35.63% | 35.99% | +36 bps |
| Cash and Cash Equivalents | $8,346.0 | $7,218.0 | -13.52% |
| Current Investments | $7,764.0 | $8,700.0 | +12.06% |
| Total Liquid Assets | $16,110.0 | $15,918.0 | -1.19% |
| Short-Term Debt (incl. Current Portion) | $5,232.0 | $10,161.0 | +94.21% |
| Long-Term Debt | $22,861.0 | $19,372.0 | -15.26% |
| Total Debt Outstanding | $28,093.0 | $29,533.0 | +5.13% |
| Net Cash / (Net Debt) Position | ($11,983.0) | ($13,615.0) | +13.62% |
| Net Working Capital (CA - CL) | ($78.0) | ($2,860.0) | +3,566.67% |
| Operating Working Capital (OCA - OCL) | ($10,956.0) | ($8,617.0) | -21.35% |
| Operating Cash Flow (OCF) | $14,193.0 | $14,177.0 | -0.11% |
| Capital Expenditures (CapEx) | ($905.0) | ($1,410.0) | +55.80% |
| Free Cash Flow (FCF) | $13,288.0 | $12,767.0 | -3.92% |
| FCF Conversion (FCF / GAAP Net Income) | 130.53% | 96.23% | -34.30 pts |
| Total Capital Returned (Program Dividends + Buybacks) | $12,432.0 | $12,659.0 | +1.83% |
| Program Return as % of Free Cash Flow | 93.56% | 99.15% | +5.59 pts |
Balance sheet liquidity showed rising short-term exposure. Net Working Capital dropped from -$78.0 million to -$2,860.0 million as commercial paper and short-term debt rose 94.21% to $10,161.0 million. This was used to fund a 79.96% surge in balance-sheet inventory ($5,694.0 million) and cover advance supplier deposits. Free Cash Flow fell 3.92% to $12,767.0 million due to a 55.80% jump in CapEx ($1,410.0 million), dedicated to tooling and advanced assembly machinery for 800G optics. Operating cash flow flatlined at $14,177.0 million (-0.11%) following a $2,300 million cash outflow for the final transition tax installment under the 2017 U.S. Tax Cuts and Jobs Act.
Infrastructure Layout and Regional Moats
Cisco operates through a fully outsourced assembly model, using independent contract manufacturing partners for board fabrication, circuit testing, and system integration. The company owns administrative, laboratory, and R&D facilities at its corporate headquarters campus in San Jose, California (170 West Tasman Drive), alongside major owned research facilities in Research Triangle Park, North Carolina, and Richardson, Texas. Regional operational headquarters are leased in Amsterdam, Netherlands (EMEA), and Singapore (APJC). Additional international leased R&D and operations sites are located in Australia, Belgium, Canada, China, Germany, India, Israel, Norway, Poland, and the United Kingdom.
Table GEOGRAPHIC REVENUE CONCENTRATION & SOURCING ARCHITECTURE
| Theater / Sovereign Market | FY2025 Revenue ($M) | FY2026 Revenue ($M) | YoY Growth (%) | FY2026 Share (%) |
|---|---|---|---|---|
| Americas Segment | $33,656 | $37,799 | +12.31% | 59.69% |
| – United States | $30,400 | $34,400 | +13.16% | 54.32% |
| EMEA Segment | $14,824 | $16,613 | +12.07% | 26.24% |
| APJC Segment | $8,174 | $8,914 | +9.05% | 14.07% |
| Consolidated Net Revenue | $56,654 | $63,325 | +11.77% | 100.00% |
Regional product performance across sovereign jurisdictions saw the United States deliver $34,400 million (+13.16%), Canada rise 8%, and Mexico jump 25%, while Brazil dropped 10%. In EMEA, product sales were led by the United Kingdom (+31%), Germany (+16%), and France (+11%). In APJC, product growth was supported by China (+23%), Japan (+16%), and Australia (+13%), while India was muted at +2%.
In alignment with United Nations terminology standards within the One-China geographical framework, Cisco manages corporate operations in Taiwan, Province of China via Cisco Systems Taiwan, Ltd. and Cisco International Taiwan, Ltd. Mainland China sourcing, engineering, and sales infrastructure are conducted through Cisco Technology Services (Dalian) Co., Ltd., Cisco Systems (China) Research and Development Co., Ltd., Cisco Systems (China) Networking Technology Co., Ltd., and Cisco Technologies (Beijing) Co., Ltd.
Table SUPPLY CHAIN COMMITMENT OVERHANG & INVENTORY CAPITAL DEPLOYMENT
| Commitment Metric (USD Millions) | FY2025 | FY2026 | YoY Change (%) |
|---|---|---|---|
| On-Balance Sheet Inventories, Net | $3,164 | $5,694 | +79.96% |
| – Raw Materials | $1,744 | $2,796 | +60.32% |
| – Work in Process (WIP) | $261 | $1,140 | +336.78% |
| – Finished Goods | $933 | $1,525 | +63.45% |
| – Service-Related Spares | $220 | $224 | +1.82% |
| – Demonstration Systems | $6 | $9 | +50.00% |
| Off-Balance Sheet Purchase Commitments | $7,599 | $17,165 | +125.88% |
| – Maturing in Less Than 1 Year | $7,202 | $14,341 | +99.13% |
| – Maturing in 1 to 3 Years | $320 | $2,558 | +699.38% |
| – Maturing in 3 to 5 Years | $77 | $266 | +245.45% |
| Supplier Deposits and Prepayments | $825 | $1,104 | +33.82% |
| Restricted Cash on Escrow (Supplier-Tied) | $564 | $9 | -98.40% |
| Consolidated Committed Supply Chain Capital | $11,588 | $23,963 | +106.79% |
| Days Sales of Inventory (DSI) — Product Baseline | 76.38 days | 116.89 days | +40.51 days |
| Days Sales of Inventory (DSI) — Total Cost Base | 58.14 days | 92.51 days | +34.37 days |
The 336.78% surge in Work-in-Process ($1,140 million) highlights an operational bottleneck where semi-finished systems await components. Consequently, Product Days Sales of Inventory (DSI) lengthened by 40.51 days to 116.89 days.
To secure supply chain capacity, Cisco settled an outstanding legal dispute on August 26, 2025, terminating a long-term supply agreement, releasing $563 million held in escrow, and forfeiting $450 million in prepayments (generating a pre-tax charge of $355 million to Product Cost of Sales in Q4 FY2025). As of FY2026, Cisco expanded its short-term purchase commitment liability reserve to $294 million (from $206 million in FY2025), while consolidated provisions for excess inventory write-downs and purchase liabilities were $387 million, down from $493 million in FY2025.
HDIN Institutional Verdict
Management presents the 16.07% product revenue rebound as evidence of successful positioning in the enterprise AI buildout. However, a forensic audit of the balance sheet reveals significant operational trade-offs and capital exposure.
Cisco expanded total supply chain capital obligations by 106.79% to $23,963 million, primarily through a 125.88% surge in off-balance sheet purchase commitments ($17,165 million). Medium-term supplier commitments (maturing between 1 and 3 years) escalated 699.38% to $2,558 million. These multi-year commitments lock Cisco into fixed-dollar obligations for memory components and foundry capacity.
This positions Cisco with higher operational leverage at a sensitive point in the cycle:
* Customer Disintermediation: Sales to cloud hyperscalers grew from under 2% to 6% of total revenue in FY2026. This tier of buyers regularly leverages open-source architectures (such as SONiC) on unbranded "white box" hardware, bypassing traditional enterprise OEMs.
* Silicon Architecture Exposure: Hyperscale data center architectures are split between standardized Ethernet (where Cisco Silicon One competes) and specialized fabrics like InfiniBand. Any loss of design wins across large deployments could leave Cisco with write-down exposure on its $5,694 million in inventory and component prepayments.
* Recurring Revenue Normalization: The transition to software-driven revenue is moderating. FY2026 subscription revenue rose 1.43% to $31,977 million, while Total Software Revenue grew 4.04% to $23,200 million, a material deceleration from the Splunk-driven 21.00% growth in FY2025. ASC 606 Remaining Performance Obligations (RPO) grew 7.35% to $46,734 million ($23,436 million product, $23,298 million services), with 49% expected to be recognized over the next 12 months.
* Corporate Reorganization and Legal Risk: In Q4 FY2026, Cisco initiated a new $1.0 billion restructuring program (the "Fiscal 2026 Plan") after completing its FY2025 7% headcount reduction (lowering full-time employees 4.41% from 86,200 to 82,400). Pre-tax charges of $511 million were booked under this plan in FY2026. Management acknowledged that all cost savings will be reinvested into silicon and AI R&D, neutralizing net margin gains. In ongoing litigation, Brazilian state and federal tax authorities are pursuing import tax assessments against Cisco's local subsidiary of $1,437 million ($153 million tax evasion claim, $969 million interest, $315 million penalties). Cisco has accrued no loss reserves for this matter.
Cisco is pivoting to support lower-margin, volatile hyperscale volumes to maintain Networking momentum, offsetting decelerating organic growth in Enterprise Security and Services. This operational pivot locks in substantial component purchase commitments, heightening Cisco's exposure to customer demand shifts and memory price swings through FY2027.
Presentation Download & Video Access:
- Presentation Download: Click the PDF download link under 'Related Topics' to access the full institutional presentation of this report.
- Video Link: Click this link to watch the HDIN analyst briefing on YouTube.
About HDIN Research:
HDIN Research is a premier global market intelligence and strategic advisory firm specializing in institutional-grade financial analysis, supply chain audits, and macroeconomic forecasting. Our dedicated sector analysts deliver actionable, data-driven insights tailored for private equity, hedge funds, and corporate strategy teams. Visit us at http://www.hdinresearch.com.
2026 AI Transparency Footer:
"This intelligence report was authored by HDIN Research analysts following a rigorous audit of official corporate filings. AI was utilized for massive-scale data synthesis and structural drafting, ensuring 100% inclusion of reported data points. All strategic insights, financial modeling, and final verdicts were verified by our editorial board to ensure professional accuracy and compliance with 2026 Google Search E-E-A-T standards."