Accelevation Holdings Corp.: Leveraged Up-C IPO Targets Debt Paydown Near Ohio Hub as AI Infrastructure Backlog Hits $1.11B
Date : 2026-09-09
Reading : 186
HDIN Executive Takeaways
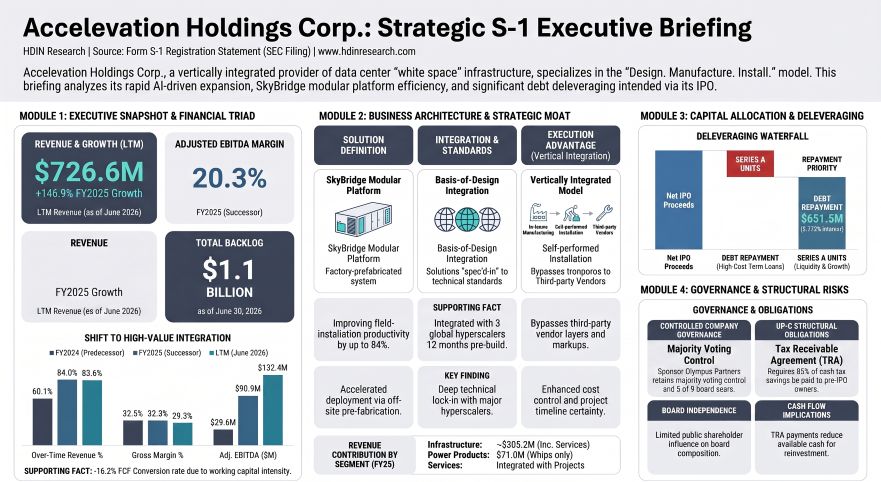
1. Accelevation Holdings Corp. filed Form S-1 reporting LTM revenue of $726.64 million through June 30, 2026, driven by a 175.8% YoY surge in 6M 2026 to $437.45 million, supported by an order backlog of $1.11 billion.
2. The company scaled manufacturing space from under 170,000 sq. ft. in early 2025 to 1.1 million sq. ft. across Ohio, Tennessee, Mississippi, and Virginia, with a 286,000 sq. ft. "Third Flight" Miamisburg addition slated for 2027.
3. Severe capital structure strain persists: gross debt jumped to $647.84 million (carrying value) following a $299.4 million dividend recapitalization in June 2026, resulting in negative LTM free cash flow of $(21.45) million and a Tax Receivable Agreement liability up to $288.6 million.
Figure Accelevation Holdings Corp: Strategic S-1 Executive Briefing
 Segmental Realities, Loss-Contract Friction, and Working Capital Squeeze
Accelevation Holdings Corp. operates as a single operating and reportable segment evaluated on a consolidated basis by the Chief Executive Officer. Top-line expansion is driven by a shift toward customized modular data center infrastructure recognized over time under ASC 606 using the cost-to-cost input method.
Table Revenue Recognition and Financial Performance — FY2024–LTM 2026
Gross margins contracted 380 bps YoY in 6M 2026 to 26.6%, directly impacted by $17.3 million of negative margins recognized on loss contracts, compared to $3.1 million in 6M 2025. Estimate-at-Completion (EAC) adjustments also produced a $9.4 million unfavorable cumulative catch-up to revenue during 6M 2026. Loss contract provisions rose to $16.3 million (with an ending reserve balance of $3.2 million). Indirect COGS experienced cost inflation from a $12.2 million increase in field-worker travel expenses alongside stepped-up facility lease expenses.
The cash conversion cycle highlights ongoing working capital absorption:
* Days Sales Outstanding (AR only): Decreased from 93.6 days in FY2024 to 67.1 days in FY2025 and 60.8 days in LTM 2026.
* Contract Asset Days (Unbilled revenue): Increased from 24.3 days in FY2024 to 43.1 days in FY2025 and 39.7 days in LTM 2026 ($78.88 million unbilled balance as of June 30, 2026).
* Comprehensive DSO (AR + Contract Assets): Stands at 100.5 days on an LTM basis versus 117.9 days in FY2024.
* Days Inventory Outstanding (DIO): 27.0 days in LTM 2026 versus 54.5 days in FY2025. Raw materials represent 92.7% ($35.2 million) of the $38.02 million inventory balance, with an inventory obsolescence reserve of $2.2 million.
* Days Payables Outstanding (DPO): Contracted from 82.2 days in FY2025 to 41.7 days in LTM 2026 as supplier trade terms tightened.
* Comprehensive Cash Conversion Cycle: Reached 85.8 days in LTM 2026 versus 82.5 days in FY2025 and 83.2 days in FY2024, locking up liquidity and keeping operating cash flow negative at $(6.53) million across the trailing twelve months.
Infrastructure Layout, Single-Source Vulnerabilities, and Up-C Leverage
Accelevation conducts a vertically integrated "Design. Manufacture. Install." workflow across 1.1 million square feet of specialized domestic manufacturing space (approximately 1.5 million total square feet including corporate and warehouse facilities). Long-lived assets and customer revenues are 100% domestic.
The industrial layout comprises four operational centers:
* Southwest Ohio Campus (Miamisburg, OH): Corporate headquarters (expanded by 25,000 sq. ft. in July 2026; $6.4 million undiscounted lease) and 625,000 sq. ft. of manufacturing space across Facility A (264,000 sq. ft., commenced 1H 2025), Facility B (286,000 sq. ft., commenced May 2026; 124-month lease, $23.0 million undiscounted), and the "Third Flight" Facility C expansion (286,000 sq. ft., 124-month lease, $25.5 million undiscounted, operational in 2027).
* Memphis, Tennessee: 225,000 sq. ft. owned facility acquired via SteelPro LLC on October 6, 2025 ($43.5 million total transaction value: $35.4 million cash, $8.1 million rollover equity) dedicated to TechFrame structural steel fabrication.
* Houston, Mississippi: 220,000 sq. ft. facility, formerly leased from Variable Interest Entity (VIE) Fox Red LLC. Fox Red initiated a 115,900 sq. ft. expansion via a $7.1 million construction loan in April 2026. On September 2, 2026, Accelevation acquired the building outright for $14.5 million, drawing on its Delayed Draw Term Loan to retire Fox Red's $6.9 million outstanding construction loan.
* Richmond, Virginia: 57,000 sq. ft. leased plant dedicated to Power Products, modular Core and High-Density (1200A) Remote Power Panels (RPPs), and branch circuit whips ($71.0 million in standalone FY2025 revenue).
Supply chain choke points center on raw structural steel, carbon steel, copper, and aluminum, for which the company holds zero financial derivative hedges. Sourcing is executed via purchase orders, mitigating volatility through quote validity expirations and contractual metal index adjustments. Single-source vulnerabilities exist for customized enclosure trims, seals, gaskets, and sliding containment doors. While these components represented a small fraction of raw material spend, an interruption halts modular factory assembly lines and requires Underwriters Laboratories (UL) and Electrical Testing Laboratories (ETL) re-certification.
The balance sheet is heavily leveraged following the Olympus Partners change of control on January 2, 2025 ($480.6 million consideration). Carrying debt escalated to $647.84 million at June 30, 2026 (face value term loan borrowings of $651.5 million, including $47.9 million drawn on Delayed Draw Term Loans, plus $6.2 million in VIE debt, against $60.0 million in undrawn revolving credit). The Fourth Amendment to the Credit Agreement on June 25, 2026, injected $346.0 million in incremental term loans, funding a $299.4 million dividend distribution to members. Net leverage stands at 4.68x on cash ($28.35 million) and 3.67x when including $133.28 million in restricted cash released from escrow in July 2026. Only $200.0 million of debt is hedged via interest rate swaps, leaving $451.5 million exposed to floating SOFR + margin rates (weighted average interest rate of 8.772%).
Under the Up-C structure, public Class A common stock carries 1 vote per share and 100% economic rights, while Class B stock carries 1 vote per share and 0% economic rights, paired 1:1 with Series B Units of Holdings LLC. A Tax Receivable Agreement (TRA) obligates the public entity to pay 85% of realized cash tax benefits from basis step-ups to pre-IPO unitholders, establishing a recorded TRA contingent liability of $133.3 million, expandable to $288.6 million upon full unit redemption. Additionally, Series P profits interest holders received a $22.1 million cash advance in July 2026, subject to clawback covenants upon forfeiture.
HDIN Institutional Verdict
Accelevation Holdings Corp.'s market valuation is propelled by hyperscale AI data hall capital expenditures and the operational adoption of its SkyBridge modular platform. However, the operational reality revealed in its Form S-1 filing demonstrates that the business is functioning as a leveraged manufacturing roll-up with immediate execution and governance friction:
* Revenue Concentration vs. Fixed Overhead: Two customers generated 61.2% of FY2025 revenue (Customer 1 at 44.2%; Customer 2 at 17.0%) and 56.6% of 6M 2026 revenue. Master Service Agreements contain zero volume commitments, leaving Accelevation vulnerable to capital expenditure pauses by individual hyperscalers while carrying $58.0 million in undiscounted operating lease liabilities.
* Contract Execution and Margin Degradation: The escalation of loss contracts ($17.3 million in 6M 2026) shows that scaling complex, over-time custom assemblies creates execution friction under ASC 606. Slower progress on complex field sites directly degrades operating leverage, neutralizing fixed-cost absorption from newly leased square footage.
* Capital Allocation Priority: Management allocated $346.0 million in newly raised term loans to distribute $299.4 million in dividends to private equity sponsors and paid $22.1 million in advances to Series P unitholders just months prior to filing the S-1.
Public Class A equity investors are entering an entity whose IPO proceeds will be funneled directly into debt retirement to de-risk an 8.772% capital structure, while continuing to carry an 85% cash-tax liability through the Tax Receivable Agreement. Valuation multiples must be heavily discounted relative to pure-play peers Vertiv Holdings Co [NYSE: VRT], Eaton Corporation plc [NYSE: ETN], and nVent Electric plc [NYSE: NVT] until positive free cash flow conversion resumes and loss-contract volatility is brought under control.
Presentation Download & Video Access:
- Presentation Download: Click the PDF download link under 'Related Topics' to access the full institutional presentation of this report.
- Video Link: Click this link to watch the HDIN analyst briefing on YouTube.
About HDIN Research:
HDIN Research is a premier global market intelligence and strategic advisory firm specializing in institutional-grade financial analysis, supply chain audits, and macroeconomic forecasting. Our dedicated sector analysts deliver actionable, data-driven insights tailored for private equity, hedge funds, and corporate strategy teams. Visit us at http://www.hdinresearch.com.
2026 AI Transparency Footer:
"This intelligence report was authored by HDIN Research analysts following a rigorous audit of official corporate filings. AI was utilized for massive-scale data synthesis and structural drafting, ensuring 100% inclusion of reported data points. All strategic insights, financial modeling, and final verdicts were verified by our editorial board to ensure professional accuracy and compliance with 2026 Google Search E-E-A-T standards."
1. Accelevation Holdings Corp. filed Form S-1 reporting LTM revenue of $726.64 million through June 30, 2026, driven by a 175.8% YoY surge in 6M 2026 to $437.45 million, supported by an order backlog of $1.11 billion.
2. The company scaled manufacturing space from under 170,000 sq. ft. in early 2025 to 1.1 million sq. ft. across Ohio, Tennessee, Mississippi, and Virginia, with a 286,000 sq. ft. "Third Flight" Miamisburg addition slated for 2027.
3. Severe capital structure strain persists: gross debt jumped to $647.84 million (carrying value) following a $299.4 million dividend recapitalization in June 2026, resulting in negative LTM free cash flow of $(21.45) million and a Tax Receivable Agreement liability up to $288.6 million.
Figure Accelevation Holdings Corp: Strategic S-1 Executive Briefing
Segmental Realities, Loss-Contract Friction, and Working Capital SqueezeAccelevation Holdings Corp. operates as a single operating and reportable segment evaluated on a consolidated basis by the Chief Executive Officer. Top-line expansion is driven by a shift toward customized modular data center infrastructure recognized over time under ASC 606 using the cost-to-cost input method.
Table Revenue Recognition and Financial Performance — FY2024–LTM 2026
| Financial Metric (in $ thousands) | FY2024 (Predecessor) | FY2025 (Successor) | 6M Ended June 30, 2025 | 6M Ended June 30, 2026 | LTM Ended June 30, 2026 |
| Over-Time Revenue (Customized) | $109,082 (60.1%) | $376,228 (84.0%) | $129,857 (81.9%) | $363,087 (83.0%) | $607,458 (83.6%) |
| Point-in-Time Revenue (Standard) | $72,268 (39.9%) | $71,591 (16.0%) | $28,773 (18.1%) | $74,364 (17.0%) | $119,182 (16.4%) |
| Total Revenue | $181,350 | $447,819 | $158,630 | $437,451 | $726,640 |
| YoY Revenue Growth (%) | N/A | +146.9% | N/A | +175.8% | +204.0% |
| Gross Profit | $58,856 | $144,697 | $48,294 | $116,150 | $212,553 |
| Gross Margin (%) | 32.5% | 32.3% | 30.4% | 26.6% | 29.3% |
| Operating Income (EBIT) | $18,459 | $44,304 | $3,450 | $35,268 | $76,122 |
| Operating Margin (%) | 10.2% | 9.9% | 2.2% | 8.1% | 10.5% |
| GAAP Net Income (Loss) | $9,409 | $21,747 | $(8,711) | $19,325 | $49,783 |
| Net Margin (%) | 5.2% | 4.9% | -5.5% | 4.4% | 6.9% |
| Adjusted EBITDA (Non-GAAP) | $29,618 | $90,867 | $26,800 | $68,371 | $132,439 |
| Adjusted EBITDA Margin (%) | 16.3% | 20.3% | 16.9% | 15.6% | 18.2% |
| Operating Cash Flow (OCF) | $10,747 | $(7,221) | $(4,931) | $(4,241) | $(6,531) |
| Capital Expenditures (CapEx) | $4,272 | $9,164 | $5,784 | $11,537 | $14,917 |
| Free Cash Flow (FCF) | $6,475 | $(16,385) | $(10,715) | $(15,777) | $(21,448) |
| FCF Conversion Rate (FCF/EBITDA) | 21.9% | -18.0% | -40.0% | -23.1% | -16.2% |
Gross margins contracted 380 bps YoY in 6M 2026 to 26.6%, directly impacted by $17.3 million of negative margins recognized on loss contracts, compared to $3.1 million in 6M 2025. Estimate-at-Completion (EAC) adjustments also produced a $9.4 million unfavorable cumulative catch-up to revenue during 6M 2026. Loss contract provisions rose to $16.3 million (with an ending reserve balance of $3.2 million). Indirect COGS experienced cost inflation from a $12.2 million increase in field-worker travel expenses alongside stepped-up facility lease expenses.
The cash conversion cycle highlights ongoing working capital absorption:
* Days Sales Outstanding (AR only): Decreased from 93.6 days in FY2024 to 67.1 days in FY2025 and 60.8 days in LTM 2026.
* Contract Asset Days (Unbilled revenue): Increased from 24.3 days in FY2024 to 43.1 days in FY2025 and 39.7 days in LTM 2026 ($78.88 million unbilled balance as of June 30, 2026).
* Comprehensive DSO (AR + Contract Assets): Stands at 100.5 days on an LTM basis versus 117.9 days in FY2024.
* Days Inventory Outstanding (DIO): 27.0 days in LTM 2026 versus 54.5 days in FY2025. Raw materials represent 92.7% ($35.2 million) of the $38.02 million inventory balance, with an inventory obsolescence reserve of $2.2 million.
* Days Payables Outstanding (DPO): Contracted from 82.2 days in FY2025 to 41.7 days in LTM 2026 as supplier trade terms tightened.
* Comprehensive Cash Conversion Cycle: Reached 85.8 days in LTM 2026 versus 82.5 days in FY2025 and 83.2 days in FY2024, locking up liquidity and keeping operating cash flow negative at $(6.53) million across the trailing twelve months.
Infrastructure Layout, Single-Source Vulnerabilities, and Up-C Leverage
Accelevation conducts a vertically integrated "Design. Manufacture. Install." workflow across 1.1 million square feet of specialized domestic manufacturing space (approximately 1.5 million total square feet including corporate and warehouse facilities). Long-lived assets and customer revenues are 100% domestic.
The industrial layout comprises four operational centers:
* Southwest Ohio Campus (Miamisburg, OH): Corporate headquarters (expanded by 25,000 sq. ft. in July 2026; $6.4 million undiscounted lease) and 625,000 sq. ft. of manufacturing space across Facility A (264,000 sq. ft., commenced 1H 2025), Facility B (286,000 sq. ft., commenced May 2026; 124-month lease, $23.0 million undiscounted), and the "Third Flight" Facility C expansion (286,000 sq. ft., 124-month lease, $25.5 million undiscounted, operational in 2027).
* Memphis, Tennessee: 225,000 sq. ft. owned facility acquired via SteelPro LLC on October 6, 2025 ($43.5 million total transaction value: $35.4 million cash, $8.1 million rollover equity) dedicated to TechFrame structural steel fabrication.
* Houston, Mississippi: 220,000 sq. ft. facility, formerly leased from Variable Interest Entity (VIE) Fox Red LLC. Fox Red initiated a 115,900 sq. ft. expansion via a $7.1 million construction loan in April 2026. On September 2, 2026, Accelevation acquired the building outright for $14.5 million, drawing on its Delayed Draw Term Loan to retire Fox Red's $6.9 million outstanding construction loan.
* Richmond, Virginia: 57,000 sq. ft. leased plant dedicated to Power Products, modular Core and High-Density (1200A) Remote Power Panels (RPPs), and branch circuit whips ($71.0 million in standalone FY2025 revenue).
Supply chain choke points center on raw structural steel, carbon steel, copper, and aluminum, for which the company holds zero financial derivative hedges. Sourcing is executed via purchase orders, mitigating volatility through quote validity expirations and contractual metal index adjustments. Single-source vulnerabilities exist for customized enclosure trims, seals, gaskets, and sliding containment doors. While these components represented a small fraction of raw material spend, an interruption halts modular factory assembly lines and requires Underwriters Laboratories (UL) and Electrical Testing Laboratories (ETL) re-certification.
The balance sheet is heavily leveraged following the Olympus Partners change of control on January 2, 2025 ($480.6 million consideration). Carrying debt escalated to $647.84 million at June 30, 2026 (face value term loan borrowings of $651.5 million, including $47.9 million drawn on Delayed Draw Term Loans, plus $6.2 million in VIE debt, against $60.0 million in undrawn revolving credit). The Fourth Amendment to the Credit Agreement on June 25, 2026, injected $346.0 million in incremental term loans, funding a $299.4 million dividend distribution to members. Net leverage stands at 4.68x on cash ($28.35 million) and 3.67x when including $133.28 million in restricted cash released from escrow in July 2026. Only $200.0 million of debt is hedged via interest rate swaps, leaving $451.5 million exposed to floating SOFR + margin rates (weighted average interest rate of 8.772%).
Under the Up-C structure, public Class A common stock carries 1 vote per share and 100% economic rights, while Class B stock carries 1 vote per share and 0% economic rights, paired 1:1 with Series B Units of Holdings LLC. A Tax Receivable Agreement (TRA) obligates the public entity to pay 85% of realized cash tax benefits from basis step-ups to pre-IPO unitholders, establishing a recorded TRA contingent liability of $133.3 million, expandable to $288.6 million upon full unit redemption. Additionally, Series P profits interest holders received a $22.1 million cash advance in July 2026, subject to clawback covenants upon forfeiture.
HDIN Institutional Verdict
Accelevation Holdings Corp.'s market valuation is propelled by hyperscale AI data hall capital expenditures and the operational adoption of its SkyBridge modular platform. However, the operational reality revealed in its Form S-1 filing demonstrates that the business is functioning as a leveraged manufacturing roll-up with immediate execution and governance friction:
* Revenue Concentration vs. Fixed Overhead: Two customers generated 61.2% of FY2025 revenue (Customer 1 at 44.2%; Customer 2 at 17.0%) and 56.6% of 6M 2026 revenue. Master Service Agreements contain zero volume commitments, leaving Accelevation vulnerable to capital expenditure pauses by individual hyperscalers while carrying $58.0 million in undiscounted operating lease liabilities.
* Contract Execution and Margin Degradation: The escalation of loss contracts ($17.3 million in 6M 2026) shows that scaling complex, over-time custom assemblies creates execution friction under ASC 606. Slower progress on complex field sites directly degrades operating leverage, neutralizing fixed-cost absorption from newly leased square footage.
* Capital Allocation Priority: Management allocated $346.0 million in newly raised term loans to distribute $299.4 million in dividends to private equity sponsors and paid $22.1 million in advances to Series P unitholders just months prior to filing the S-1.
Public Class A equity investors are entering an entity whose IPO proceeds will be funneled directly into debt retirement to de-risk an 8.772% capital structure, while continuing to carry an 85% cash-tax liability through the Tax Receivable Agreement. Valuation multiples must be heavily discounted relative to pure-play peers Vertiv Holdings Co [NYSE: VRT], Eaton Corporation plc [NYSE: ETN], and nVent Electric plc [NYSE: NVT] until positive free cash flow conversion resumes and loss-contract volatility is brought under control.
Presentation Download & Video Access:
- Presentation Download: Click the PDF download link under 'Related Topics' to access the full institutional presentation of this report.
- Video Link: Click this link to watch the HDIN analyst briefing on YouTube.
About HDIN Research:
HDIN Research is a premier global market intelligence and strategic advisory firm specializing in institutional-grade financial analysis, supply chain audits, and macroeconomic forecasting. Our dedicated sector analysts deliver actionable, data-driven insights tailored for private equity, hedge funds, and corporate strategy teams. Visit us at http://www.hdinresearch.com.
2026 AI Transparency Footer:
"This intelligence report was authored by HDIN Research analysts following a rigorous audit of official corporate filings. AI was utilized for massive-scale data synthesis and structural drafting, ensuring 100% inclusion of reported data points. All strategic insights, financial modeling, and final verdicts were verified by our editorial board to ensure professional accuracy and compliance with 2026 Google Search E-E-A-T standards."