Super Micro Computer, Inc.: Strategic Pivot to Turnkey AI Data Center Infrastructure in San Jose as Negative $6.81 Billion Operating Cash Flow Signals Balance Sheet Squeeze
Date : 2026-09-07
Reading : 636
HDIN Executive Takeaways
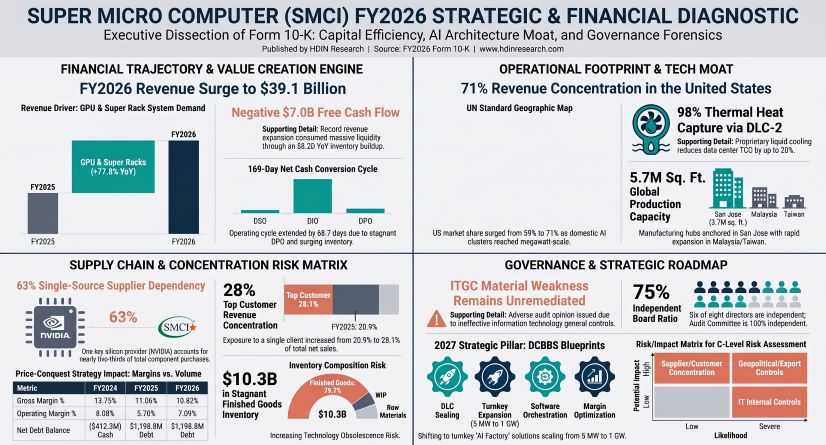
1. Super Micro Computer, Inc. [NASDAQ: SMCI] accelerated FY2026 consolidated net sales by 77.79% year-over-year to $39,063.07 million, driven by an 83.4% expansion in GPU and Super Racks configurations amid rapid enterprise and cloud hyperscaler deployments of NVIDIA Blackwell platforms.
2. Free cash flow contracted to negative $6,971.89 million as the cash conversion cycle extended by 68.72 days to 168.81 days, driven by a finished goods inventory buildup of $10,276.00 million and non-cancelable 12-month purchase commitments of $34.2 billion.
3. Operational scaling remains encumbered by structural governance exposures, including an unremediated ITGC material weakness, a single supplier accounting for 63.1% of component purchases, and $747.58 million in related-party transactions with family-controlled suppliers Ablecom Technology, Inc. and Compuware Technology, Inc.
Figure SUPER MICRO COMPUTER (SMCI) FY2026 STRATEGIC & FINANCIAL DIAGNOSTIC
 Segmental Realities and Working Capital Compression
Super Micro Computer, Inc. operates under a single reportable operating segment managed by the Chief Executive Officer as the Chief Operating Decision Maker (CODM). Product revenue continues to represent the core operational base, while software and extended support services remain auxiliary.
Table Net Sales Composition and Growth — FY2024–FY2026
The top-line acceleration in FY2026 was driven by the GPU & Super Racks category, which expanded 83.4% year-over-year (an absolute increase of $15,261.5 million), fueled by customer transitions to direct liquid cooling (DLC-2) clusters, NVIDIA Blackwell (HGX B200, GB200, GB300 NVL72), and AMD Instinct architectures.
Despite net income increasing 112.66% year-over-year to $2,230.45 million, profitability margins reflect competitive pricing pressure and component cost pass-through dynamics:
* Gross Margin contracted by 24 basis points year-over-year to 10.82% in FY2026 (down 293 basis points from 13.75% in FY2024), driven by market-share conquest pricing, higher bill-of-materials proportions of expensive silicon relative to chassis, a $312.9 million reduction in vendor volume rebates, and a 174.8% spike in tariff expenses from $86.5 million in FY2025 to $237.7 million in FY2026.
* Operating Margin rebounded by 139 basis points to 7.09% in FY2026 (compared to 5.70% in FY2025 and 8.08% in FY2024) as operating expenses as a percentage of net sales dropped from 5.4% to 3.7% due to operational leverage.
* Net Margin expanded 94 basis points year-over-year to 5.71% in FY2026, compared to 4.77% in FY2025 and 7.69% in FY2024.
Table Financial Performance, Earnings Growth and Cash Flow — FY2024–FY2026
The operating cash flow conversion ratio plunged to negative 3.05x in FY2026 from positive 1.58x in FY2025. This cash burn was driven by working capital consumption across inventory and receivables:
* Ending inventory expanded 175.53% year-over-year from $4,680.38 million to $12,895.95 million, resulting in an operating cash drain of $8,876.70 million. Finished goods escalated by 196.54% to $10,276.00 million, accounting for 79.68% of total gross inventories. Work in process rose 148.72% to $1,677.90 million (13.01% split), while raw materials grew 74.32% to $942.05 million (7.31% split). Inventory reserves write-downs totaled $188.11 million (0.48% of sales), down from $232.08 million (1.06% of sales) in FY2025.
* Accounts receivable increased 177.93% from $2,203.94 million to $6,125.41 million, creating a cash outflow of $3,921.90 million. Three customers accounted for 23.0% ($1,408.85 million), 17.1% ($1,047.45 million), and 12.5% ($765.68 million) of net receivables, representing a combined 52.6% concentration ($3,221.98 million).
* Days Sales Outstanding (DSO) lengthened from 36.61 days to 57.24 days (+20.63 days).
* Days Inventory Outstanding (DIO) expanded from 87.42 days to 135.12 days (+47.70 days) on an ending basis, and from 81.93 days to 92.08 days on an average basis. Ending inventory turns fell from 4.18x to 2.70x.
* Days Payables Outstanding (DPO) remained flat at 23.54 days versus 23.94 days (-0.40 days).
* The Net Cash Conversion Cycle (CCC) lengthened by 68.72 days from 100.09 days to 168.81 days.
To fund this working capital deficit, Super Micro Computer restructured its liabilities:
* Cash and cash equivalents stood at $7,521.50 million (plus $110.10 million in restricted cash) versus $5,169.90 million in FY2025.
* Short-term debt increased to $2,039.80 million from $75.10 million, fully exhausting the $2,000.0 million JP Morgan Revolving Credit Facility and drawing $1,763.5 million against its $1,765.0 million Taiwan CTBC bank facilities.
* Long-term debt rose to $2,016.40 million from $37.40 million, alongside $4,664.10 million in convertible senior notes (comprising $1,725.0 million of 3.50% notes due 2029, $700.0 million of 2.25% notes due 2028, and $2,300.0 million of 0.00% notes due 2030).
* Total debt outstanding reached $8,720.30 million, shifting the balance sheet from net cash of $412.30 million in FY2025 to net debt of $1,198.80 million in FY2026.
* The Net Debt / Adjusted EBITDA ratio stood at 0.37x, while operating interest coverage (EBIT / Interest Expense) declined to 14.24x from 21.03x.
* Net equity financing in Q4 FY2026 contributed $5,638.60 million, expanding stockholders' equity from $6,301.90 million to $14,479.60 million, supported by Series A Mandatory Convertible Preferred Stock.
Ending DuPont return on equity (ROE) compressed from 16.64% in FY2025 to 15.40% in FY2026, despite net profit margin expanding from 4.77% to 5.71%. The contraction was driven by asset turnover dropping from 1.5674x to 1.3045x on total assets of $29,945.50 million, and the financial leverage ratio declining from 2.2245x to 2.0681x due to equity dilution. On an average balance basis, FY2026 ROE stood at 21.47% (5.71% net profit margin × 1.7771x asset turnover × 2.1155x financial leverage).
Infrastructure Layout and Regional Moats
Super Micro Computer operates 5,717,000 gross square feet across its global real estate portfolio, split between 3,375,000 owned square feet and 2,342,000 leased square feet, with a property, plant, and equipment net book value of $625.60 million.
Table Physical Facility Footprint and PP&E — Global Infrastructure
The company holds 36.7 acres of undeveloped land in Taiwan and Malaysia to facilitate production expansions. U.S. operating lease right-of-use assets totaled $501.80 million in FY2026, with total undiscounted lease commitments of $716.10 million ($539.60 million present value), partially offset by expected sublease cash receipts of $402.00 million from a Vernon, California data center facility.
Manufacturing assembly remains non-automated, reliant on a skilled workforce of approximately 2,100 production employees out of more than 7,000 global personnel. The remaining headcount includes over 3,500 R&D employees (50.0% of total staff), supporting direct engineering integration under the Server Building Block Solutions (BBS) architecture. For FY2027, management projects capital expenditures of between $380.0 million and $400.0 million, up from $162.0 million in FY2026, focused on high-precision tooling for advanced architectures, IT enterprise upgrades, and facility buildouts.
Geographic revenue recognition based on destination points highlights a shift toward domestic deployment centers:
* United States: Grew 112.14% year-over-year to $27,690.07 million, representing 70.89% of consolidated net sales, up from 59.40% ($13,052.56 million) in FY2025 and 68.00% ($10,187.33 million) in FY2024.
* Asia: Increased 10.36% to $6,063.33 million, but its revenue share contracted to 15.52% from 25.00% ($5,494.15 million) in FY2025. Related-party sales in the region included $19.98 million to Compuware in Taiwan (down from $30.24 million in FY2025 and $46.62 million in FY2024), and $8.15 million to a 30%-owned Chinese Corporate Venture (prorated through divestiture on December 23, 2025, down from $11.03 million in FY2025). Ablecom entered into a reseller arrangement in Q4 FY2026 for Japanese enterprise fulfillment.
* Europe: Contracted 1.93% year-over-year to $2,674.49 million (6.85% of net sales), down from $2,726.99 million in FY2025.
* Other (Rest of World): Rose 277.35% to $2,635.18 million (6.75% share) compared to $698.34 million in FY2025, supported by data center shipments to the Middle East.
Remaining performance obligations under non-cancelable service and installation contracts totaled $2,612.00 million as of June 30, 2026, with approximately 60% expected to be recognized as revenue within 12 months.
HDIN Institutional Verdict
Super Micro Computer presents a structural paradox for institutional allocators: industry-leading operational agility and thermal engineering offset by extreme working capital demands, single-source procurement exposure, and governance vulnerabilities.
The primary operational constraint is supply-chain concentration. A single silicon provider (NVIDIA) represented 63.1% of total component purchases in FY2026 (64.4% in FY2025 and 65.4% in FY2024). These purchases are executed on a short-term purchase order basis rather than through long-term volume agreements, limiting pricing leverage and allocation security.
This exposure is compounded downstream. A single customer accounted for 28.1% of net sales ($10,976.72 million) in FY2026, up from 20.9% for the top customer in FY2025. Under HDIN Research's downside stress-test model, a 50% order reduction by this customer would remove $5,488.36 million from the top line. Assuming fixed operating expenses of $1,456.77 million, operating margin would compress by 61 basis points to 6.48%. If price competition induces an incremental 100-basis-point gross margin concession, operating margin would drop to 5.48%.
Furthermore, SMCI holds $34.2 billion in non-cancelable purchase commitments due within 12 months. Because downstream hyperscalers purchase via cancelable purchase orders, an order cut would strand customized work in process. A 20% obsolescence write-down on the top customer’s proportionate finished goods ($1,443.78 million) would require a $288.76 million provision, dropping the adjusted gross margin to 8.96% and operating margin to 4.62%.
Downstream Net Sales Concentration: Top Customer = 28.1% ($10,976.72M)
Upstream Component Sourcing Concentration: Single Source (NVIDIA) = 63.1%
Downstream Terms: Short-Term Cancelable Purchase Orders
Upstream Terms: $34.2 Billion Non-Cancelable Commitments + $315.37M Cash Prepayments
Working Capital Result: FCF of Negative $6,971.89M | Finished Goods Buffer: $10,276.00M
Governance and internal controls remain subject to heightened scrutiny:
* BDO USA, P.C. issued an adverse audit opinion on Internal Control over Financial Reporting (ICFR) for the fiscal year ended June 30, 2026, despite an unqualified opinion on the consolidated financial statements and no retrospective error restatements. While SMCI remediated three material weaknesses (segregation of duties, completeness of information, and multi-area close processes), an Information Technology General Controls (ITGC) material weakness remains unremediated due to inadequate user access and infrastructure change monitoring.
* Legal exposures persist under ASC 450 with zero accrued loss reserves. Outstanding proceedings include grand jury subpoenas from the U.S. Attorney’s Office for the Southern District of New York (SDNY) following the March 2026 indictment of three former associates (including co-founder and former director Yih-Shyan Wally Liaw) for export conspiracy, SEC enforcement subpoenas dating from November 2024 and April 2026, multiple BIS Office of Export Enforcement inquiries, consolidated putative securities class actions in the Northern District of California (Averza and Bhuva cohorts), and consolidated derivative actions across federal and state courts. An internal Special Committee found no willful wrongdoing by current senior management.
* Upstream contract manufacturing relies on family-owned entities. Purchases from Ablecom Technology, Inc. (led by CEO brother Steve Liang; 95.3% chassis concentration) and Compuware Technology, Inc. (led by CEO brother Bill Liang; 94.4% power supply concentration) totaled $747.58 million in FY2026 (2.15% of COGS). SMCI maintains $242.00 million in non-cancelable purchase commitments to these affiliates ($59.80 million to Ablecom, $182.20 million to Compuware) and extends an uncollateralized $200.00 million net-90 trade credit line to Compuware.
Executive compensation exhibits structural misalignment. While Chief Executive Officer Charles Liang operates on a $1.00 base salary with option tranches tied to market capitalization and revenue targets (four tranches vested; the fifth tranche of $21.0 billion in revenue was certified, but its $110.00 stock price trigger remains unvested), NEO incentive metrics were distorted in FY2026. Chief Financial Officer David Weigand received a 0.00 score for failing to remediate material weaknesses, yet this was offset by a maximum 5.00 discretionary Compensation Adjustment Factor awarded by the CEO, yielding an overall 16.26x bonus multiple ($971,275 total payout).
In conclusion, Super Micro Computer demonstrates operational execution in liquid-cooled hardware delivery, but its financial architecture is exposed to customer and supplier concentration, an extended cash conversion cycle, and internal control weaknesses that continue to affect institutional risk profiles.
Presentation Download & Video Access:
- Presentation Download: Click the PDF download link under 'Related Topics' to access the full institutional presentation of this report.
- Video Link: Click this link to watch the HDIN analyst briefing on YouTube.
About HDIN Research:
HDIN Research is a premier global market intelligence and strategic advisory firm specializing in institutional-grade financial analysis, supply chain audits, and macroeconomic forecasting. Our dedicated sector analysts deliver actionable, data-driven insights tailored for private equity, hedge funds, and corporate strategy teams. Visit us at http://www.hdinresearch.com.
2026 AI Transparency Footer:
"This intelligence report was authored by HDIN Research analysts following a rigorous audit of official corporate filings. AI was utilized for massive-scale data synthesis and structural drafting, ensuring 100% inclusion of reported data points. All strategic insights, financial modeling, and final verdicts were verified by our editorial board to ensure professional accuracy and compliance with 2026 Google Search E-E-A-T standards."
1. Super Micro Computer, Inc. [NASDAQ: SMCI] accelerated FY2026 consolidated net sales by 77.79% year-over-year to $39,063.07 million, driven by an 83.4% expansion in GPU and Super Racks configurations amid rapid enterprise and cloud hyperscaler deployments of NVIDIA Blackwell platforms.
2. Free cash flow contracted to negative $6,971.89 million as the cash conversion cycle extended by 68.72 days to 168.81 days, driven by a finished goods inventory buildup of $10,276.00 million and non-cancelable 12-month purchase commitments of $34.2 billion.
3. Operational scaling remains encumbered by structural governance exposures, including an unremediated ITGC material weakness, a single supplier accounting for 63.1% of component purchases, and $747.58 million in related-party transactions with family-controlled suppliers Ablecom Technology, Inc. and Compuware Technology, Inc.
Figure SUPER MICRO COMPUTER (SMCI) FY2026 STRATEGIC & FINANCIAL DIAGNOSTIC
Segmental Realities and Working Capital CompressionSuper Micro Computer, Inc. operates under a single reportable operating segment managed by the Chief Executive Officer as the Chief Operating Decision Maker (CODM). Product revenue continues to represent the core operational base, while software and extended support services remain auxiliary.
Table Net Sales Composition and Growth — FY2024–FY2026
| Net Sales Classification | FY2024 (USD M) | FY2025 (USD M) | FY2026 (USD M) | YoY % (FY25) | YoY % (FY26) | FY26 Share (%) |
| Product Revenue | $14,760.95 | $21,641.54 | $38,524.77 | 46.61% | 78.01% | 98.62% |
| Services & Software Revenue | $228.30 | $330.50 | $538.30 | 44.77% | 62.87% | 1.38% |
| Total Consolidated Net Sales | $14,989.25 | $21,972.04 | $39,063.07 | 46.59% | 77.79% | 100.00% |
The top-line acceleration in FY2026 was driven by the GPU & Super Racks category, which expanded 83.4% year-over-year (an absolute increase of $15,261.5 million), fueled by customer transitions to direct liquid cooling (DLC-2) clusters, NVIDIA Blackwell (HGX B200, GB200, GB300 NVL72), and AMD Instinct architectures.
Despite net income increasing 112.66% year-over-year to $2,230.45 million, profitability margins reflect competitive pricing pressure and component cost pass-through dynamics:
* Gross Margin contracted by 24 basis points year-over-year to 10.82% in FY2026 (down 293 basis points from 13.75% in FY2024), driven by market-share conquest pricing, higher bill-of-materials proportions of expensive silicon relative to chassis, a $312.9 million reduction in vendor volume rebates, and a 174.8% spike in tariff expenses from $86.5 million in FY2025 to $237.7 million in FY2026.
* Operating Margin rebounded by 139 basis points to 7.09% in FY2026 (compared to 5.70% in FY2025 and 8.08% in FY2024) as operating expenses as a percentage of net sales dropped from 5.4% to 3.7% due to operational leverage.
* Net Margin expanded 94 basis points year-over-year to 5.71% in FY2026, compared to 4.77% in FY2025 and 7.69% in FY2024.
Table Financial Performance, Earnings Growth and Cash Flow — FY2024–FY2026
| Financial Performance Summary | FY2024 (USD M) | FY2025 (USD M) | FY2026 (USD M) | YoY % (FY26) | 2-Year CAGR |
| Gross Profit | $2,061.41 | $2,429.92 | $4,227.25 | 73.97% | 43.20% |
| Operating Income (EBIT) | $1,210.77 | $1,252.99 | $2,770.49 | 121.11% | 51.27% |
| Depreciation & Amortization | $29.62 | $41.30 | $53.67 | 29.95% | 34.61% |
| EBITDA | $1,240.39 | $1,294.29 | $2,824.16 | 118.20% | 50.89% |
| Stock-Based Compensation | $231.51 | $314.40 | $412.11 | 31.08% | 33.42% |
| Loss on Debt Extinguishment | $0.00 | $30.30 | $0.00 | -100.00% | N/A |
| Adjusted EBITDA | $1,471.90 | $1,638.99 | $3,236.27 | 97.45% | 48.28% |
| Diluted EPS (USD) | $1.92 | $1.68 | $3.26 | 94.05% | 30.30% |
| Operating Cash Flow (OCF) | ($2,485.97) | $1,659.52 | ($6,809.89) | -510.35% | N/A |
| Capital Expenditures (CapEx) | $124.28 | $127.21 | $162.00 | 27.34% | 14.17% |
| Free Cash Flow (FCF) | ($2,610.25) | $1,532.31 | ($6,971.89) | -554.99% | N/A |
The operating cash flow conversion ratio plunged to negative 3.05x in FY2026 from positive 1.58x in FY2025. This cash burn was driven by working capital consumption across inventory and receivables:
* Ending inventory expanded 175.53% year-over-year from $4,680.38 million to $12,895.95 million, resulting in an operating cash drain of $8,876.70 million. Finished goods escalated by 196.54% to $10,276.00 million, accounting for 79.68% of total gross inventories. Work in process rose 148.72% to $1,677.90 million (13.01% split), while raw materials grew 74.32% to $942.05 million (7.31% split). Inventory reserves write-downs totaled $188.11 million (0.48% of sales), down from $232.08 million (1.06% of sales) in FY2025.
* Accounts receivable increased 177.93% from $2,203.94 million to $6,125.41 million, creating a cash outflow of $3,921.90 million. Three customers accounted for 23.0% ($1,408.85 million), 17.1% ($1,047.45 million), and 12.5% ($765.68 million) of net receivables, representing a combined 52.6% concentration ($3,221.98 million).
* Days Sales Outstanding (DSO) lengthened from 36.61 days to 57.24 days (+20.63 days).
* Days Inventory Outstanding (DIO) expanded from 87.42 days to 135.12 days (+47.70 days) on an ending basis, and from 81.93 days to 92.08 days on an average basis. Ending inventory turns fell from 4.18x to 2.70x.
* Days Payables Outstanding (DPO) remained flat at 23.54 days versus 23.94 days (-0.40 days).
* The Net Cash Conversion Cycle (CCC) lengthened by 68.72 days from 100.09 days to 168.81 days.
To fund this working capital deficit, Super Micro Computer restructured its liabilities:
* Cash and cash equivalents stood at $7,521.50 million (plus $110.10 million in restricted cash) versus $5,169.90 million in FY2025.
* Short-term debt increased to $2,039.80 million from $75.10 million, fully exhausting the $2,000.0 million JP Morgan Revolving Credit Facility and drawing $1,763.5 million against its $1,765.0 million Taiwan CTBC bank facilities.
* Long-term debt rose to $2,016.40 million from $37.40 million, alongside $4,664.10 million in convertible senior notes (comprising $1,725.0 million of 3.50% notes due 2029, $700.0 million of 2.25% notes due 2028, and $2,300.0 million of 0.00% notes due 2030).
* Total debt outstanding reached $8,720.30 million, shifting the balance sheet from net cash of $412.30 million in FY2025 to net debt of $1,198.80 million in FY2026.
* The Net Debt / Adjusted EBITDA ratio stood at 0.37x, while operating interest coverage (EBIT / Interest Expense) declined to 14.24x from 21.03x.
* Net equity financing in Q4 FY2026 contributed $5,638.60 million, expanding stockholders' equity from $6,301.90 million to $14,479.60 million, supported by Series A Mandatory Convertible Preferred Stock.
Ending DuPont return on equity (ROE) compressed from 16.64% in FY2025 to 15.40% in FY2026, despite net profit margin expanding from 4.77% to 5.71%. The contraction was driven by asset turnover dropping from 1.5674x to 1.3045x on total assets of $29,945.50 million, and the financial leverage ratio declining from 2.2245x to 2.0681x due to equity dilution. On an average balance basis, FY2026 ROE stood at 21.47% (5.71% net profit margin × 1.7771x asset turnover × 2.1155x financial leverage).
Infrastructure Layout and Regional Moats
Super Micro Computer operates 5,717,000 gross square feet across its global real estate portfolio, split between 3,375,000 owned square feet and 2,342,000 leased square feet, with a property, plant, and equipment net book value of $625.60 million.
Table Physical Facility Footprint and PP&E — Global Infrastructure
| Physical Facility Footprint | Owned Area (sq. ft.) | Leased Area (sq. ft.) | Total Area (sq. ft.) | PP&E Net Book Value |
| United States (San Jose, CA) | 2,081,000 | 1,644,000 | 3,725,000 | $423.2 Million |
| International Hubs | 1,294,000 | 698,000 | 1,992,000 | $202.3 Million |
| Taiwan (Bade Facility) | Disclosed jointly | Disclosed jointly | Disclosed jointly | $108.5 Million |
| Malaysia Campus | Disclosed jointly | Disclosed jointly | Disclosed jointly | $62.2 Million |
| Netherlands ('s-Hertogenbosch) | Disclosed jointly | Disclosed jointly | Disclosed jointly | $31.6 Million (Other) |
| Total Global Infrastructure | 3,375,000 | 2,342,000 | 5,717,000 | $625.6 Million |
The company holds 36.7 acres of undeveloped land in Taiwan and Malaysia to facilitate production expansions. U.S. operating lease right-of-use assets totaled $501.80 million in FY2026, with total undiscounted lease commitments of $716.10 million ($539.60 million present value), partially offset by expected sublease cash receipts of $402.00 million from a Vernon, California data center facility.
Manufacturing assembly remains non-automated, reliant on a skilled workforce of approximately 2,100 production employees out of more than 7,000 global personnel. The remaining headcount includes over 3,500 R&D employees (50.0% of total staff), supporting direct engineering integration under the Server Building Block Solutions (BBS) architecture. For FY2027, management projects capital expenditures of between $380.0 million and $400.0 million, up from $162.0 million in FY2026, focused on high-precision tooling for advanced architectures, IT enterprise upgrades, and facility buildouts.
Geographic revenue recognition based on destination points highlights a shift toward domestic deployment centers:
* United States: Grew 112.14% year-over-year to $27,690.07 million, representing 70.89% of consolidated net sales, up from 59.40% ($13,052.56 million) in FY2025 and 68.00% ($10,187.33 million) in FY2024.
* Asia: Increased 10.36% to $6,063.33 million, but its revenue share contracted to 15.52% from 25.00% ($5,494.15 million) in FY2025. Related-party sales in the region included $19.98 million to Compuware in Taiwan (down from $30.24 million in FY2025 and $46.62 million in FY2024), and $8.15 million to a 30%-owned Chinese Corporate Venture (prorated through divestiture on December 23, 2025, down from $11.03 million in FY2025). Ablecom entered into a reseller arrangement in Q4 FY2026 for Japanese enterprise fulfillment.
* Europe: Contracted 1.93% year-over-year to $2,674.49 million (6.85% of net sales), down from $2,726.99 million in FY2025.
* Other (Rest of World): Rose 277.35% to $2,635.18 million (6.75% share) compared to $698.34 million in FY2025, supported by data center shipments to the Middle East.
Remaining performance obligations under non-cancelable service and installation contracts totaled $2,612.00 million as of June 30, 2026, with approximately 60% expected to be recognized as revenue within 12 months.
HDIN Institutional Verdict
Super Micro Computer presents a structural paradox for institutional allocators: industry-leading operational agility and thermal engineering offset by extreme working capital demands, single-source procurement exposure, and governance vulnerabilities.
The primary operational constraint is supply-chain concentration. A single silicon provider (NVIDIA) represented 63.1% of total component purchases in FY2026 (64.4% in FY2025 and 65.4% in FY2024). These purchases are executed on a short-term purchase order basis rather than through long-term volume agreements, limiting pricing leverage and allocation security.
This exposure is compounded downstream. A single customer accounted for 28.1% of net sales ($10,976.72 million) in FY2026, up from 20.9% for the top customer in FY2025. Under HDIN Research's downside stress-test model, a 50% order reduction by this customer would remove $5,488.36 million from the top line. Assuming fixed operating expenses of $1,456.77 million, operating margin would compress by 61 basis points to 6.48%. If price competition induces an incremental 100-basis-point gross margin concession, operating margin would drop to 5.48%.
Furthermore, SMCI holds $34.2 billion in non-cancelable purchase commitments due within 12 months. Because downstream hyperscalers purchase via cancelable purchase orders, an order cut would strand customized work in process. A 20% obsolescence write-down on the top customer’s proportionate finished goods ($1,443.78 million) would require a $288.76 million provision, dropping the adjusted gross margin to 8.96% and operating margin to 4.62%.
Downstream Net Sales Concentration: Top Customer = 28.1% ($10,976.72M)
Upstream Component Sourcing Concentration: Single Source (NVIDIA) = 63.1%
Downstream Terms: Short-Term Cancelable Purchase Orders
Upstream Terms: $34.2 Billion Non-Cancelable Commitments + $315.37M Cash Prepayments
Working Capital Result: FCF of Negative $6,971.89M | Finished Goods Buffer: $10,276.00M
Governance and internal controls remain subject to heightened scrutiny:
* BDO USA, P.C. issued an adverse audit opinion on Internal Control over Financial Reporting (ICFR) for the fiscal year ended June 30, 2026, despite an unqualified opinion on the consolidated financial statements and no retrospective error restatements. While SMCI remediated three material weaknesses (segregation of duties, completeness of information, and multi-area close processes), an Information Technology General Controls (ITGC) material weakness remains unremediated due to inadequate user access and infrastructure change monitoring.
* Legal exposures persist under ASC 450 with zero accrued loss reserves. Outstanding proceedings include grand jury subpoenas from the U.S. Attorney’s Office for the Southern District of New York (SDNY) following the March 2026 indictment of three former associates (including co-founder and former director Yih-Shyan Wally Liaw) for export conspiracy, SEC enforcement subpoenas dating from November 2024 and April 2026, multiple BIS Office of Export Enforcement inquiries, consolidated putative securities class actions in the Northern District of California (Averza and Bhuva cohorts), and consolidated derivative actions across federal and state courts. An internal Special Committee found no willful wrongdoing by current senior management.
* Upstream contract manufacturing relies on family-owned entities. Purchases from Ablecom Technology, Inc. (led by CEO brother Steve Liang; 95.3% chassis concentration) and Compuware Technology, Inc. (led by CEO brother Bill Liang; 94.4% power supply concentration) totaled $747.58 million in FY2026 (2.15% of COGS). SMCI maintains $242.00 million in non-cancelable purchase commitments to these affiliates ($59.80 million to Ablecom, $182.20 million to Compuware) and extends an uncollateralized $200.00 million net-90 trade credit line to Compuware.
Executive compensation exhibits structural misalignment. While Chief Executive Officer Charles Liang operates on a $1.00 base salary with option tranches tied to market capitalization and revenue targets (four tranches vested; the fifth tranche of $21.0 billion in revenue was certified, but its $110.00 stock price trigger remains unvested), NEO incentive metrics were distorted in FY2026. Chief Financial Officer David Weigand received a 0.00 score for failing to remediate material weaknesses, yet this was offset by a maximum 5.00 discretionary Compensation Adjustment Factor awarded by the CEO, yielding an overall 16.26x bonus multiple ($971,275 total payout).
In conclusion, Super Micro Computer demonstrates operational execution in liquid-cooled hardware delivery, but its financial architecture is exposed to customer and supplier concentration, an extended cash conversion cycle, and internal control weaknesses that continue to affect institutional risk profiles.
Presentation Download & Video Access:
- Presentation Download: Click the PDF download link under 'Related Topics' to access the full institutional presentation of this report.
- Video Link: Click this link to watch the HDIN analyst briefing on YouTube.
About HDIN Research:
HDIN Research is a premier global market intelligence and strategic advisory firm specializing in institutional-grade financial analysis, supply chain audits, and macroeconomic forecasting. Our dedicated sector analysts deliver actionable, data-driven insights tailored for private equity, hedge funds, and corporate strategy teams. Visit us at http://www.hdinresearch.com.
2026 AI Transparency Footer:
"This intelligence report was authored by HDIN Research analysts following a rigorous audit of official corporate filings. AI was utilized for massive-scale data synthesis and structural drafting, ensuring 100% inclusion of reported data points. All strategic insights, financial modeling, and final verdicts were verified by our editorial board to ensure professional accuracy and compliance with 2026 Google Search E-E-A-T standards."