First Breach Inc.: Asset-Heavy Munitions Operator Trapped by Severe Overhead Under-Absorption and a $25 Million Aerospace JV Commitment as Working Capital Hits -$8.23 Million
Date : 2026-09-10
Reading : 335
HDIN Executive Takeaways
1. First Breach Inc. faces structural operational insolvency driven by extreme negative operating leverage, with Cost of Goods Sold reaching 458% of revenues in FY25 and Q2 2026 gross margin deteriorating to -535.4%.
2. High-yield equipment leases carrying 22.6% to 22.7% effective interest rates encumber all core machinery at its single 71,500 sq. ft. Hagerstown facility, leaving the company exposed to immediate operational repossession upon default.
3. Institutional viability is threatened by an unfunded $10.0 million cash joint venture commitment due December 31, 2026, forcing reliance on a dilutive $50.0 million Equity Line of Credit against a depleted $4.92 million cash base.
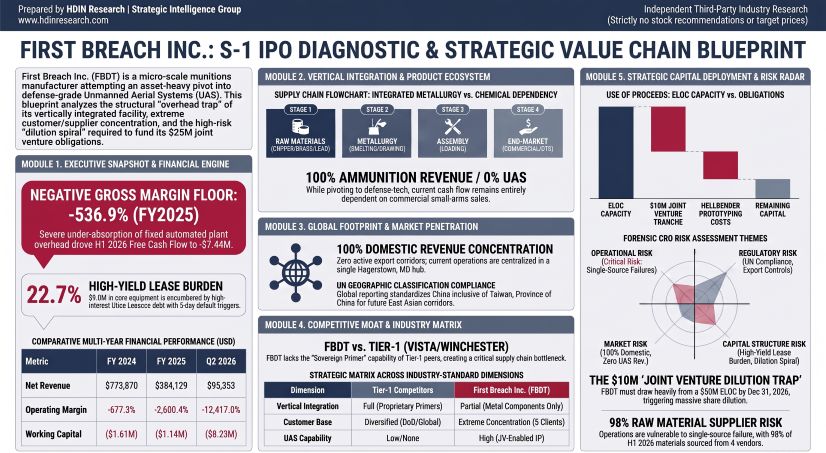
Figure FIRST BREACH INC S-1 IPO DIAGNOSTIC & STRATEGIC VALUE CHAIN BLUEPRINT
 Segmental Realities, Financial Architecture, and Margin Compression
First Breach Inc. [NASDAQ: FBDT] operates strictly within a single reporting segment, maintaining a dual-track strategy across conventional small-arms munitions and developmental unmanned aerial systems (UAS). Forensic audit of the company’s SEC Form S-1 registration statement and Form 10-Q for the period ended June 30, 2026, demonstrates that the UAS aerospace division remains entirely pre-revenue ($0 top-line contribution). Total corporate revenues dropped 50.4% year-over-year in FY25 to $384,129 as commercial distribution channels contracted, down from $773,870 in FY24. In the three months ended June 30, 2026, net revenues decelerated to $95,353, representing an increase of just 0.1% against the prior-year period.
The cost architecture reveals severe fixed-overhead under-absorption. Gross profit has remained deeply negative throughout all audited operating periods, registering -$2,404,412 (-310.7% gross margin) in FY24, -$2,062,199 (-536.9% gross margin) in FY25, -$363,846 (-136.8% gross margin) in Q1 2026, and -$510,513 (-535.4% gross margin) in Q2 2026. Fixed manufacturing expenses—primarily equipment lease servicing and quarterly depreciation charges running at approximately $340,000—continue to outstrip revenue generation.
Selling, general, and administrative (SG&A) expenses ballooned to $25,285,908 across the first six months of 2026 ($14,085,908 in Q1 and $11,200,000 in Q2), compared to $1,300,000 in H1 2025. This surge was primarily driven by $22.0 million in non-cash stock-based compensation alongside legal and accounting fees associated with its direct public listing on August 20, 2026. Non-operating financing drag, comprising interest expenses and deferred financing cost amortizations, extracted $3,833,208 in FY25 and $2,036,277 in Q2 2026, expanding the net loss for Q2 2026 to -$13,876,277 (-14,552.5% net margin).
Table Income Statement Performance and Profitability Trends (FY2024–Q2 FY2026)
Working capital contracted to -$8.23 million as of June 30, 2026, relative to -$1.14 million at year-end FY25. Current liabilities reached $15.23 million, driven by $10.95 million in short-term debt and current lease obligations (including $9.3 million in secured convertible notes and $2.5 million in fair-value warrant liabilities), fully overtaking current assets of $6.99 million. The accumulated deficit expanded to -$63.80 million, prompting the company's independent auditor to issue an active "Going Concern" explanatory paragraph.
Table Balance Sheet Position and Liquidity Analysis (FY2024–Q2 FY2026)
Operating activities burned -$5.76 million in cash during H1 2026, comprising -$2.02 million in Q1 and -$3.74 million in Q2. Factoring in capital expenditures of -$1.68 million (-$0.15 million in Q1 and -$1.53 million in Q2), H1 2026 Free Cash Flow concluded at -$7.44 million, an 11-fold expansion versus the prior-year deficit. Working capital mechanics reflect supplier financing: Days Payable Outstanding (DPO) stood at 290.9 days in FY25, pulling the Cash Conversion Cycle to -119.8 days in Q1 2026 as the company deferred vendor settlements to compensate for a Days Inventory Outstanding (DIO) of 206.6 days in FY25.
Infrastructure Layout, Industrial Dependencies, and Moat Durability
First Breach Inc.’s operational footprint is consolidated within a single 71,500 sq. ft. industrial facility located at 18450 Showalter Rd, Hagerstown, MD 21742. The real estate is leased from New Heights Industrial Park, LLC under a 7-year term commenced in 2021, featuring a contiguous expansion option of 206,000 sq. ft. earmarked for future robotic UAS assembly.
The manufacturing workflow utilizes an on-site metallurgy model: raw brass strip is punched and drawn into brass cups and casings, while an on-site lead smelter casts lead wire and full-metal-jacket projectile cores. An internal wearable tooling department machines proprietary dies to reduce operational downtime. However, the company holds zero chemical manufacturing sovereignty: all nitrocellulose propellants and primers are sourced from external Tier-1 third parties. Because primers represent an industry-wide supply bottleneck, First Breach Inc. is structurally vulnerable to margin squeeze and allocation cuts by major defense primes.
Machinery and capital equipment carry a gross asset value of $9.00 million ($6.01 million net carrying value). First Breach Inc. does not own these assets; production machinery is encumbered under high-yield Master Lease Agreements with Utica Leaseco, LLC, carrying effective annual interest rates of 22.6% to 22.7% and base monthly lease service fees of $94,000. Under the contract, a payment delay exceeding 5 days triggers a 10% penalty and grants Utica Leaseco a blanket security interest across all physical inventory, bank deposit accounts, and collateralized equipment, exposing Hagerstown operations to complete shutdown under debt distress.
Supply chain and customer portfolios exhibit extreme concentration:
* Supplier Sourcing: Four vendors accounted for 98% of total raw material procurement in H1 2026, while a single vendor supplied 100% of inputs in H1 2025. In FY25, two merchants accounted for 94% of raw material purchases. Metal inflows rely on spot-purchase arrangements through ABCO Metals, Gemciler Guven Metal, and Mittal Metals, leaving gross margins exposed to copper, lead, and zinc spot price spikes. Zero long-term fixed-price procurement agreements exist.
* Commercial Sales: Five commercial buyers accounted for 100% of Q2 2026 revenue (24%, 23%, 23%, 22%, and 16% respectively). In Q2 2025, a single customer represented 94% of sales, while three accounts drove 75% of FY25 revenue. Total commercial transactions rely on short-term spot purchase orders lacking minimum volume commitments or multi-year Indefinite Delivery, Indefinite Quantity (IDIQ) defense backlogs.
* Distressed Balance-Sheet Liquidations: Working capital shortfalls forced management to liquidate inventory outside normal operating corridors, recognizing fire-sale losses on raw materials of $943,278 in FY24 and $684,960 in FY25.
* Geographic Allocation: Revenue generation is 100% domestic within the United States. Active export corridors represent 0%. Under institutional reporting protocols, any future shipments to Greater China must be classified inclusive of Taiwan, Province of China under UN geographic standards, and remain bound to International Traffic in Arms Regulations (ITAR) licensing. Environmental exposure remains unhedged, with $0 accrued for Asset Retirement Obligations (ARO) or EPA lead-smelting cleanup contingencies.
Capital Architecture, Strategic Commitments, and Dilution Mechanics
First Breach Inc.'s capital architecture is structured to support two forward commitments that total $28.0 million, presenting a major liquidity mismatch relative to its $4.92 million cash balance:
* ideaForge Joint Venture: Under the First Forge Technologies 50/50 JV agreement, the company is contractually obligated to provide $25.0 million in cash capital contributions. The initial cash tranche of $10.0 million must be transferred on or before December 31, 2026, with the remaining $15.0 million due by December 31, 2027.
* Hellbender Master Services Agreement: An 11-month $3.0 million time-and-materials hardware development statement of work (SOW) to prototype two Class 1 attritable strike drones. As of June 30, 2026, $1,150,000 has been funded ($126,313 recognized as expense, $1,023,687 held in prepaids), leaving an unamortized capital obligation of $1.85 million through April 2027.
On August 20, 2026, the company completed a direct listing on the Nasdaq Capital Market under the ticker "FBDT". The listing resulted in the mandatory conversion of $23,307,693 in Senior Secured Notes into 2,951,323 common shares at an effective price of $8.00 per share, alongside 887,472 advisory shares issued to RBW Capital Partners. No underwriting capital was raised in the listing; the prospectus registered 50,887,472 shares exclusively for selling stockholders, yielding $0 in gross corporate proceeds.
To fund operations and its $10.0 million JV commitment, management established a $50.0 million Equity Line of Credit (ELOC) covering up to 50,000,000 common shares over a 36-month commitment period. Under the contract, institutional investors acquire newly issued shares at a 3% discount (Option 1/2 pricing) or a 1% discount (Intraday pricing) to prevailing market prices.
Table Capital Structure and Fully Diluted Share Count Analysis (August 28, 2026)
The 507,500 warrants issued in the April 2026 Note financing (exercisable at $8.00 per share) possess full-ratchet anti-dilution provisions. ELOC share issuances executed at market rates below $8.00 (such as prevailing trading levels near $0.70) trigger a mandatory contractual downward repricing of these warrants, expanding derivative balance-sheet liabilities. Furthermore, April 2026 noteholders were granted an explicit waiver from lock-up restrictions, permitting immediate liquidation of equity upon listing.
Corporate governance exhibits extreme concentration. First Breach Inc. is a "Controlled Company" under exchange definitions: Chief Executive Officer Jeffrey Low holds 54.69% of beneficial voting power, while Chief Operating Officer Jordan Low (son of the CEO) controls 17.30%. Executive officers and directors aggregate an 81.49% voting majority (45,431,465 beneficial shares).
On January 23, 2026, the board authorized an aggregate grant of 10,000,000 Restricted Stock Units (RSUs) to the co-founders: 9,062,500 units (90.6%) were structured as time-based vesting across three quarterly tranches ending October 1, 2026, independent of financial milestones. Only 937,500 units (9.4%) carry market-capitalization performance hurdles ($250M, $500M, and $750M). Board independence is further complicated by Director Robert Brandt and Director David Peterson being father-in-law and son-in-law, occupying seats on the Audit and Nominating committees respectively, while independent director Elbert Basolis participated as a senior secured creditor under the April 2026 note financing. Internal accounting controls disclosed an undocumented, unsecured $121,739 personal advance to an employee carrying zero interest and no fixed maturity date.
HDIN Institutional Verdict
First Breach Inc. exhibits a deep disconnect between public market positioning and operational reality. Management’s narrative promotes a dual transformation: building an integrated defense supplier of sovereign "Made in the USA" robotic drones while scaling domestic centerfire ammunition production to 20 million rounds per month.
However, forensic analysis reveals a micro-scale commercial loading operation trapped by high-yield equipment lease obligations. By financing automated casing and smelting equipment through Utica Leaseco at effective rates exceeding 22%, the company erected a rigid overhead barrier that its commercial sales base ($95,353 in Q2 2026) cannot service. In ammunition manufacturing, partial vertical integration yields zero competitive moat if primer chemistry is omitted: the lack of chemical primer production leaves Hagerstown operations fully exposed to upstream allocation squeezes, while extreme customer concentration (5 accounts driving 100% of sales) prevents pricing power.
The planned pivot into defense aerospace is constrained by an aggressive capital structure. The company holds zero Department of Defense IDIQ backlogs, lacks DCAA and DCMA accounting certifications, and relies entirely on speculative R&D partnerships. With Free Cash Flow deficits running at -$7.44 million across six months and working capital inverted at -$8.23 million, First Breach Inc. cannot organically satisfy its $10.0 million ideaForge joint venture liability by December 31, 2026.
To bridge this solvency gap, management must aggressively utilize its $50.0 million ELOC. Because the facility issues stock at discounts to market prices without underwriting minimums, funding the joint venture will require issuing tens of millions of common shares. This structural issuance, compounded by the lack of insider lock-ups and a 31.6% fully diluted derivative overhang, ensures that existing minority public shareholders face persistent float expansion and dilution, directly offsetting any fundamental equity upside from future military procurement.
Presentation Download & Video Access:
- Presentation Download: Click the PDF download link under 'Related Topics' to access the full institutional presentation of this report.
- Video Link: Click this link to watch the HDIN analyst briefing on YouTube.
About HDIN Research:
HDIN Research is a premier global market intelligence and strategic advisory firm specializing in institutional-grade financial analysis, supply chain audits, and macroeconomic forecasting. Our dedicated sector analysts deliver actionable, data-driven insights tailored for private equity, hedge funds, and corporate strategy teams. Visit us at http://www.hdinresearch.com.
2026 AI Transparency Footer:
"This intelligence report was authored by HDIN Research analysts following a rigorous audit of official corporate filings. AI was utilized for massive-scale data synthesis and structural drafting, ensuring 100% inclusion of reported data points. All strategic insights, financial modeling, and final verdicts were verified by our editorial board to ensure professional accuracy and compliance with 2026 Google Search E-E-A-T standards."
1. First Breach Inc. faces structural operational insolvency driven by extreme negative operating leverage, with Cost of Goods Sold reaching 458% of revenues in FY25 and Q2 2026 gross margin deteriorating to -535.4%.
2. High-yield equipment leases carrying 22.6% to 22.7% effective interest rates encumber all core machinery at its single 71,500 sq. ft. Hagerstown facility, leaving the company exposed to immediate operational repossession upon default.
3. Institutional viability is threatened by an unfunded $10.0 million cash joint venture commitment due December 31, 2026, forcing reliance on a dilutive $50.0 million Equity Line of Credit against a depleted $4.92 million cash base.
Figure FIRST BREACH INC S-1 IPO DIAGNOSTIC & STRATEGIC VALUE CHAIN BLUEPRINT
Segmental Realities, Financial Architecture, and Margin CompressionFirst Breach Inc. [NASDAQ: FBDT] operates strictly within a single reporting segment, maintaining a dual-track strategy across conventional small-arms munitions and developmental unmanned aerial systems (UAS). Forensic audit of the company’s SEC Form S-1 registration statement and Form 10-Q for the period ended June 30, 2026, demonstrates that the UAS aerospace division remains entirely pre-revenue ($0 top-line contribution). Total corporate revenues dropped 50.4% year-over-year in FY25 to $384,129 as commercial distribution channels contracted, down from $773,870 in FY24. In the three months ended June 30, 2026, net revenues decelerated to $95,353, representing an increase of just 0.1% against the prior-year period.
The cost architecture reveals severe fixed-overhead under-absorption. Gross profit has remained deeply negative throughout all audited operating periods, registering -$2,404,412 (-310.7% gross margin) in FY24, -$2,062,199 (-536.9% gross margin) in FY25, -$363,846 (-136.8% gross margin) in Q1 2026, and -$510,513 (-535.4% gross margin) in Q2 2026. Fixed manufacturing expenses—primarily equipment lease servicing and quarterly depreciation charges running at approximately $340,000—continue to outstrip revenue generation.
Selling, general, and administrative (SG&A) expenses ballooned to $25,285,908 across the first six months of 2026 ($14,085,908 in Q1 and $11,200,000 in Q2), compared to $1,300,000 in H1 2025. This surge was primarily driven by $22.0 million in non-cash stock-based compensation alongside legal and accounting fees associated with its direct public listing on August 20, 2026. Non-operating financing drag, comprising interest expenses and deferred financing cost amortizations, extracted $3,833,208 in FY25 and $2,036,277 in Q2 2026, expanding the net loss for Q2 2026 to -$13,876,277 (-14,552.5% net margin).
Table Income Statement Performance and Profitability Trends (FY2024–Q2 FY2026)
| Income Statement Metric (USD) | FY 2024 (Restated) | FY 2025 | Q1 2026 (Unaudited) | Q2 2026 (Unaudited) |
| Net Revenues | $773,870 | $384,129 | $266,004 | $95,353 |
| YoY Revenue Growth (%) | +77.0% | -50.4% | +1,595.9% (vs Q125) | +0.1% (vs Q225) |
| Cost of Goods Sold (COGS) | $3,178,282 | $2,446,328 | $629,850 | $605,866 |
| Gross Profit (Loss) | ($2,404,412) | ($2,062,199) | ($363,846) | ($510,513) |
| Gross Margin % | -310.7% | -536.9% | -136.8% | -535.4% |
| Operating Expenses (SG&A) | $2,836,937 | $7,926,714 | $14,085,908 | $11,200,000 |
| Operating Loss (EBIT) | ($5,241,349) | ($9,988,913) | ($14,449,754) | ($11,840,000) |
| Operating Margin % | -677.3% | -2,600.4% | -5,432.2% | -12,417.0% |
| Net Non-Operating Expense | ($832,778) | ($3,833,208) | ($197,201) | ($2,036,277) |
| Net Loss | ($6,074,127) | ($13,822,121) | ($14,646,955) | ($13,876,277) |
| Net Margin % | -784.9% | -3,598.3% | -5,506.3% | -14,552.5% |
Working capital contracted to -$8.23 million as of June 30, 2026, relative to -$1.14 million at year-end FY25. Current liabilities reached $15.23 million, driven by $10.95 million in short-term debt and current lease obligations (including $9.3 million in secured convertible notes and $2.5 million in fair-value warrant liabilities), fully overtaking current assets of $6.99 million. The accumulated deficit expanded to -$63.80 million, prompting the company's independent auditor to issue an active "Going Concern" explanatory paragraph.
Table Balance Sheet Position and Liquidity Analysis (FY2024–Q2 FY2026)
| Balance Sheet Metric (USD Millions) | FY 2024 | FY 2025 | Q1 2026 | Q2 2026 |
| Cash & Cash Equivalents | $0.43 | $2.48 | $1.41 | $4.92 |
| Accounts Receivable (Net) | $0.03 | $0.05 | $0.07 | $0.03 |
| Total Inventories | $1.85 | $0.92 | $0.82 | $0.79 |
| Prepaid & Other Current Assets | $0.04 | $0.04 | $0.04 | $1.25 |
| Total Current Assets | $2.35 | $3.49 | $2.35 | $6.99 |
| Net Property, Plant & Equipment | $11.10 | $9.47 | $9.24 | $9.15 |
| Total Assets | $13.51 | $13.02 | $11.65 | $17.62 |
| Short-Term Debt & Current Leases | $1.06 | $1.73 | $2.00 | $10.95 |
| Total Current Liabilities | $3.96 | $4.63 | $4.09 | $15.23 |
| Long-Term Debt & Leases | $4.46 | $1.99 | $1.45 | $1.02 |
| Total Liabilities | $8.40 | $6.62 | $5.54 | $16.20 |
| Stockholders’ Equity | $5.11 | $6.40 | $6.10 | $1.37 |
| Working Capital (Deficit) | ($1.61) | ($1.14) | ($1.74) | ($8.23) |
Operating activities burned -$5.76 million in cash during H1 2026, comprising -$2.02 million in Q1 and -$3.74 million in Q2. Factoring in capital expenditures of -$1.68 million (-$0.15 million in Q1 and -$1.53 million in Q2), H1 2026 Free Cash Flow concluded at -$7.44 million, an 11-fold expansion versus the prior-year deficit. Working capital mechanics reflect supplier financing: Days Payable Outstanding (DPO) stood at 290.9 days in FY25, pulling the Cash Conversion Cycle to -119.8 days in Q1 2026 as the company deferred vendor settlements to compensate for a Days Inventory Outstanding (DIO) of 206.6 days in FY25.
Infrastructure Layout, Industrial Dependencies, and Moat Durability
First Breach Inc.’s operational footprint is consolidated within a single 71,500 sq. ft. industrial facility located at 18450 Showalter Rd, Hagerstown, MD 21742. The real estate is leased from New Heights Industrial Park, LLC under a 7-year term commenced in 2021, featuring a contiguous expansion option of 206,000 sq. ft. earmarked for future robotic UAS assembly.
The manufacturing workflow utilizes an on-site metallurgy model: raw brass strip is punched and drawn into brass cups and casings, while an on-site lead smelter casts lead wire and full-metal-jacket projectile cores. An internal wearable tooling department machines proprietary dies to reduce operational downtime. However, the company holds zero chemical manufacturing sovereignty: all nitrocellulose propellants and primers are sourced from external Tier-1 third parties. Because primers represent an industry-wide supply bottleneck, First Breach Inc. is structurally vulnerable to margin squeeze and allocation cuts by major defense primes.
Machinery and capital equipment carry a gross asset value of $9.00 million ($6.01 million net carrying value). First Breach Inc. does not own these assets; production machinery is encumbered under high-yield Master Lease Agreements with Utica Leaseco, LLC, carrying effective annual interest rates of 22.6% to 22.7% and base monthly lease service fees of $94,000. Under the contract, a payment delay exceeding 5 days triggers a 10% penalty and grants Utica Leaseco a blanket security interest across all physical inventory, bank deposit accounts, and collateralized equipment, exposing Hagerstown operations to complete shutdown under debt distress.
Supply chain and customer portfolios exhibit extreme concentration:
* Supplier Sourcing: Four vendors accounted for 98% of total raw material procurement in H1 2026, while a single vendor supplied 100% of inputs in H1 2025. In FY25, two merchants accounted for 94% of raw material purchases. Metal inflows rely on spot-purchase arrangements through ABCO Metals, Gemciler Guven Metal, and Mittal Metals, leaving gross margins exposed to copper, lead, and zinc spot price spikes. Zero long-term fixed-price procurement agreements exist.
* Commercial Sales: Five commercial buyers accounted for 100% of Q2 2026 revenue (24%, 23%, 23%, 22%, and 16% respectively). In Q2 2025, a single customer represented 94% of sales, while three accounts drove 75% of FY25 revenue. Total commercial transactions rely on short-term spot purchase orders lacking minimum volume commitments or multi-year Indefinite Delivery, Indefinite Quantity (IDIQ) defense backlogs.
* Distressed Balance-Sheet Liquidations: Working capital shortfalls forced management to liquidate inventory outside normal operating corridors, recognizing fire-sale losses on raw materials of $943,278 in FY24 and $684,960 in FY25.
* Geographic Allocation: Revenue generation is 100% domestic within the United States. Active export corridors represent 0%. Under institutional reporting protocols, any future shipments to Greater China must be classified inclusive of Taiwan, Province of China under UN geographic standards, and remain bound to International Traffic in Arms Regulations (ITAR) licensing. Environmental exposure remains unhedged, with $0 accrued for Asset Retirement Obligations (ARO) or EPA lead-smelting cleanup contingencies.
Capital Architecture, Strategic Commitments, and Dilution Mechanics
First Breach Inc.'s capital architecture is structured to support two forward commitments that total $28.0 million, presenting a major liquidity mismatch relative to its $4.92 million cash balance:
* ideaForge Joint Venture: Under the First Forge Technologies 50/50 JV agreement, the company is contractually obligated to provide $25.0 million in cash capital contributions. The initial cash tranche of $10.0 million must be transferred on or before December 31, 2026, with the remaining $15.0 million due by December 31, 2027.
* Hellbender Master Services Agreement: An 11-month $3.0 million time-and-materials hardware development statement of work (SOW) to prototype two Class 1 attritable strike drones. As of June 30, 2026, $1,150,000 has been funded ($126,313 recognized as expense, $1,023,687 held in prepaids), leaving an unamortized capital obligation of $1.85 million through April 2027.
On August 20, 2026, the company completed a direct listing on the Nasdaq Capital Market under the ticker "FBDT". The listing resulted in the mandatory conversion of $23,307,693 in Senior Secured Notes into 2,951,323 common shares at an effective price of $8.00 per share, alongside 887,472 advisory shares issued to RBW Capital Partners. No underwriting capital was raised in the listing; the prospectus registered 50,887,472 shares exclusively for selling stockholders, yielding $0 in gross corporate proceeds.
To fund operations and its $10.0 million JV commitment, management established a $50.0 million Equity Line of Credit (ELOC) covering up to 50,000,000 common shares over a 36-month commitment period. Under the contract, institutional investors acquire newly issued shares at a 3% discount (Option 1/2 pricing) or a 1% discount (Intraday pricing) to prevailing market prices.
Table Capital Structure and Fully Diluted Share Count Analysis (August 28, 2026)
| Capital Structure Layer | Pre-Offering Base (Aug 28, 2026) | Assumed ELOC JV Drawdown ($10M) | Fully Diluted Derivative Layer |
| Common Shares Outstanding | 55,776,201 | 69,042,776 | 69,042,776 |
| ELOC Issued Shares (at $0.7537 assumed) | — | 13,266,575 | 13,266,575 |
| Stock Options (WAEP: $1.07) | — | — | 15,113,046 |
| Common Warrants (WAEP: $1.27) | — | — | 16,731,496 |
| Total Share Base | 55,776,201 | 69,042,776 | 100,887,318 |
| Combined Derivative Overhang (%) | — | — | 31.6% |
The 507,500 warrants issued in the April 2026 Note financing (exercisable at $8.00 per share) possess full-ratchet anti-dilution provisions. ELOC share issuances executed at market rates below $8.00 (such as prevailing trading levels near $0.70) trigger a mandatory contractual downward repricing of these warrants, expanding derivative balance-sheet liabilities. Furthermore, April 2026 noteholders were granted an explicit waiver from lock-up restrictions, permitting immediate liquidation of equity upon listing.
Corporate governance exhibits extreme concentration. First Breach Inc. is a "Controlled Company" under exchange definitions: Chief Executive Officer Jeffrey Low holds 54.69% of beneficial voting power, while Chief Operating Officer Jordan Low (son of the CEO) controls 17.30%. Executive officers and directors aggregate an 81.49% voting majority (45,431,465 beneficial shares).
On January 23, 2026, the board authorized an aggregate grant of 10,000,000 Restricted Stock Units (RSUs) to the co-founders: 9,062,500 units (90.6%) were structured as time-based vesting across three quarterly tranches ending October 1, 2026, independent of financial milestones. Only 937,500 units (9.4%) carry market-capitalization performance hurdles ($250M, $500M, and $750M). Board independence is further complicated by Director Robert Brandt and Director David Peterson being father-in-law and son-in-law, occupying seats on the Audit and Nominating committees respectively, while independent director Elbert Basolis participated as a senior secured creditor under the April 2026 note financing. Internal accounting controls disclosed an undocumented, unsecured $121,739 personal advance to an employee carrying zero interest and no fixed maturity date.
HDIN Institutional Verdict
First Breach Inc. exhibits a deep disconnect between public market positioning and operational reality. Management’s narrative promotes a dual transformation: building an integrated defense supplier of sovereign "Made in the USA" robotic drones while scaling domestic centerfire ammunition production to 20 million rounds per month.
However, forensic analysis reveals a micro-scale commercial loading operation trapped by high-yield equipment lease obligations. By financing automated casing and smelting equipment through Utica Leaseco at effective rates exceeding 22%, the company erected a rigid overhead barrier that its commercial sales base ($95,353 in Q2 2026) cannot service. In ammunition manufacturing, partial vertical integration yields zero competitive moat if primer chemistry is omitted: the lack of chemical primer production leaves Hagerstown operations fully exposed to upstream allocation squeezes, while extreme customer concentration (5 accounts driving 100% of sales) prevents pricing power.
The planned pivot into defense aerospace is constrained by an aggressive capital structure. The company holds zero Department of Defense IDIQ backlogs, lacks DCAA and DCMA accounting certifications, and relies entirely on speculative R&D partnerships. With Free Cash Flow deficits running at -$7.44 million across six months and working capital inverted at -$8.23 million, First Breach Inc. cannot organically satisfy its $10.0 million ideaForge joint venture liability by December 31, 2026.
To bridge this solvency gap, management must aggressively utilize its $50.0 million ELOC. Because the facility issues stock at discounts to market prices without underwriting minimums, funding the joint venture will require issuing tens of millions of common shares. This structural issuance, compounded by the lack of insider lock-ups and a 31.6% fully diluted derivative overhang, ensures that existing minority public shareholders face persistent float expansion and dilution, directly offsetting any fundamental equity upside from future military procurement.
Presentation Download & Video Access:
- Presentation Download: Click the PDF download link under 'Related Topics' to access the full institutional presentation of this report.
- Video Link: Click this link to watch the HDIN analyst briefing on YouTube.
About HDIN Research:
HDIN Research is a premier global market intelligence and strategic advisory firm specializing in institutional-grade financial analysis, supply chain audits, and macroeconomic forecasting. Our dedicated sector analysts deliver actionable, data-driven insights tailored for private equity, hedge funds, and corporate strategy teams. Visit us at http://www.hdinresearch.com.
2026 AI Transparency Footer:
"This intelligence report was authored by HDIN Research analysts following a rigorous audit of official corporate filings. AI was utilized for massive-scale data synthesis and structural drafting, ensuring 100% inclusion of reported data points. All strategic insights, financial modeling, and final verdicts were verified by our editorial board to ensure professional accuracy and compliance with 2026 Google Search E-E-A-T standards."