Research Solutions, Inc.: SaaS Shift Offsets Transaction Drag Across North American and European Hubs as 51.9% Gross Margin Signals Capital-Light Realignment
Date : 2026-09-15
Reading : 207
HDIN Executive Takeaways
1. Platforms subscription expansion of 9.84% to $20.82 million offset an 8.69% contraction in transactional revenue, driving blended gross margins up 258 basis points to 51.90% in fiscal 2026.
2. Operating cash flows funded $4.86 million in cash earnouts for Scite, Inc. alongside $2.91 million in equity installments, reducing contingent acquisition liabilities to $7.32 million without bank borrowings.
3. Operating leverage materialized through a 15.27% overhead contraction in administrative costs and 100% direct expensing of internal software research, leaving balance sheet assets free of capitalized capitalized development overhang.
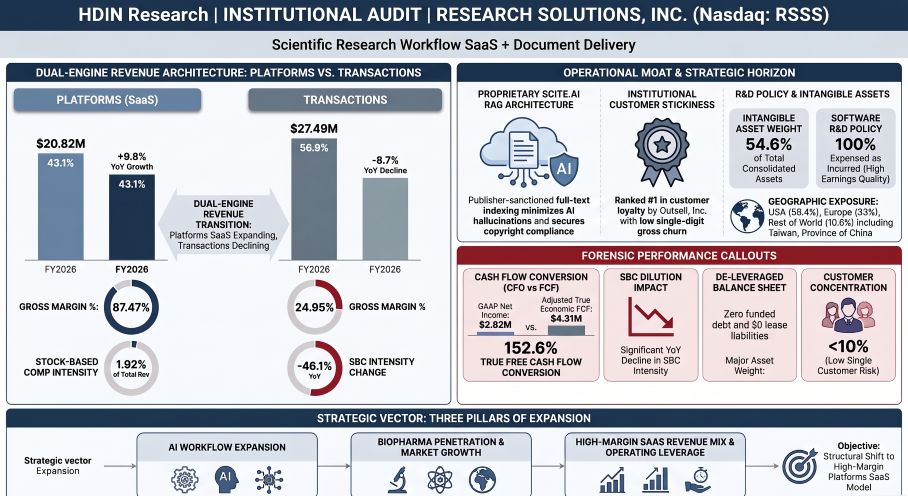
Figure RESEARCH SOLUTIONS Institutional Audit Analysis
 Segmental Economics and Subscription Margin Expansion
Research Solutions, Inc. [NASDAQ: RSSS] reported fiscal year 2026 (FY26) financial results reflecting a structural business model transition toward recurring cloud software. Consolidated revenue contracted 1.53% year-over-year (YoY) to $48,306,957 compared to $49,057,981 in fiscal year 2025 (FY25), driven by an 8.69% decline in lower-margin transactional document delivery orders. Conversely, the high-margin Platforms division expanded 9.84% YoY to $20,820,974, lifting software subscription mix from 38.64% to 43.10% of total enterprise top line (+446 basis points).
Because Platforms carry an 87.47% gross margin compared to 24.95% for Transactions, the expanding software contribution lifted consolidated gross profit by 3.61% YoY to $25,070,508. Consolidated gross margin expanded 258 basis points from 49.32% in FY25 to 51.90% in FY26. Operating income (EBIT) increased 43.47% YoY to $3,588,377, generating an operating margin of 7.43% (+233 basis points YoY).
Cost containment within General and Administrative (G&A) expenses, which decreased 15.27% YoY to $6,724,399, generated operating leverage that offset a 19.36% increase in Sales and Marketing ($6,397,899) and an 8.71% increase in Technology and Product Development ($6,121,647). Net income expanded 122.99% YoY to $2,822,068, aided by a reduction in earnout fair-value and accretion charges from $1,748,526 in FY25 to $1,040,293 in FY26. Non-GAAP Adjusted EBITDA rose 10.61% YoY to $5,826,563, representing an Adjusted EBITDA margin of 12.06%.
Table Revenue Mix, Margin Expansion, and Earnings Performance (FY2025–FY2026)
Cash flow from operations totaled $5,274,420 in FY26 compared to $7,023,166 in FY25, reflecting a negative working capital variance of -$771,430 versus a positive swing of $1,040,164 in FY25 due to trade payables run-down. Capital expenditures remained low at $39,771 ($19,261 in FY25), reflecting property and equipment asset requirements of under 0.1% of revenue. Under ASC 350-40, Research Solutions, Inc. expensed 100% of its internal software development expenditures ($3,132,876 in FY26 R&D, up 23.8% YoY from $2,530,959 in FY25), reporting $0 in capitalized software assets.
Unlevered Free Cash Flow reached $5,234,649, converting 185.49% of GAAP Net Income and 145.88% of GAAP EBIT. After deducting non-cash stock compensation of $928,516 ($330,374 stock options; $598,142 restricted stock) as an economic cost of talent retention, Adjusted True Economic Free Cash Flow stood at $4,306,133 ($5,280,344 in FY25), representing an 8.91% cash margin on gross revenue and a 152.59% conversion of Net Income.
The company's working capital position stood at -$4,246,458 at FY26 year-end, driven by $11,467,832 in current deferred revenue liabilities (plus $17,245 non-current, bringing total deferred revenue to $11,485,077, up 7.32% YoY from $10,702,120). Unearned subscription collections represented 55.16% of full-year Platforms revenue, with $9.25 million of FY25 ending deferred balances recognized into revenue during FY26. Trade receivables collection cycles remained stable: ending net Accounts Receivable closed at $6,963,040 (-3.17% YoY), yielding an ending Days Sales Outstanding (DSO) of 52.61 days (versus 53.49 days in FY25) against a two-point average DSO of 53.47 days (52.33 days in FY25). Allowances for credit losses contracted 43.39% YoY to $103,217, bolstered by a $23,000 credit to bad debt expense and realized write-offs of $56,000 (0.12% of revenue).
Total assets closed FY26 at $45,664,718, heavily concentrated in M&A intangibles: static goodwill of $16,372,979 and net identifiable intangibles of $8,537,870 ($10.80M gross developed technology; $1.50M gross customer lists; $170k gross customer relationships; $16.4k fully amortized IP licenses). Intangibles and goodwill together represent 54.55% of total assets and 120.30% of stockholders' equity ($20,706,847, up 48.67% YoY). Forward intangible amortization will generate an ongoing non-cash operational drag of $1,173,000 annually through FY31, consuming 32.69% of FY26 EBIT.
Operational Footprint and Content Sourcing Concentration
Research Solutions, Inc. operates through a decentralized corporate structure. In November 2019, the enterprise transitioned to a 100% remote operational architecture, holding zero physical leases or operating lease liabilities, maintaining its legal address in Henderson, Nevada. Operational, back-office, and development activities are executed through low-cost shared-service hubs in Mexico via two wholly owned operating subsidiaries: Reprints Desk Latin America S. de R.L. de C.V. (incorporated 2012) and ResSol LA, S. DE R.L. DE C.V. (incorporated 2022). Operating expenses generated in Mexico are transacted in Mexican Pesos (MXN). The company maintains no active foreign exchange derivative hedging program, exposing G&A and development expenditure to MXN currency appreciation against the U.S. Dollar.
The commercial footprint spans three primary geographic regions, with commercial channels targeting academic institutions, Tier-1 biopharma, and non-pharma industrial segments:
Table Geographic Revenue Concentration and Accounts Receivable Exposure (FY2025–FY2026)
The business displays structural publisher concentration within its Transactions cost of sales ($20,627,028). In FY26, 46.0% of all content royalty costs were paid to three publishers (45.0% in FY25). Vendor A accounted for 28.0% of content costs (27.0% in FY25), while Vendor B absorbed 11.0% (10.0% in FY25). Because content agreements are non-exclusive, publishers retain pricing control and the right to provide direct enterprise access. To secure uninterrupted API distribution, Research Solutions expanded prepaid publisher royalty assets from $925 in FY25 to $411,297 in FY26, recording a net operational cash deposit outflow of $410,372.
To shield unit margins from copyright inflation and open-access leakage, the platform integrates Article Galaxy's automated entitlement management with Scite.ai's Retrieval Augmented Generation (RAG) architecture. This system references pre-negotiated text-and-data-mining (TDM) permissions across 200 million scientific articles to output contextual citation intelligence (supporting versus contrasting evidence) with reduced artificial intelligence hallucinations.
HDIN Institutional Verdict
Research Solutions, Inc. presents an institutional investment case characterized by balance-sheet hygiene and cash conversion discipline, offset by high content supplier concentration.
Funded bank debt stands at $0, backed by $12,630,283 in cash reserves and an undrawn $500,000 credit facility with PNC Bank priced at SOFR plus 2.50% (maturing April 15, 2027). The company self-funded $4,856,763 in cash earnouts and issued 1,032,401 common shares ($2,906,856 value) for Scite, Inc. during FY26 out of operational cash flow. The contingent consideration liability was reduced from $14,046,640 to $7,323,314 (100% current liabilities; non-current portion dropped from $6,683,488 to $0). Subsequent to fiscal year-end on August 2, 2026, the company disbursed the fifth quarterly tranche consisting of $1.2 million in cash and 329,118 common shares, leaving three quarterly payments through May 2027 requiring approximately $4.54 million in cash and $2.78 million in equity.
Share dilution remains bounded: outstanding common stock totaled 33,513,551 shares at FY26 year-end (expanding to 33,726,669 as of September 4, 2026). The equity structure includes 2,705,304 stock options (weighted average exercise price $2.29; 2,315,475 exercisable with $743,304 intrinsic value) and 1,093,793 unvested restricted shares, creating an 8.07% potential option overhang without outstanding warrants. Executive compensation aligns with equity appreciation: the Long-Term Equity Bonus Program conditions 20% tranche vesting on 30-day volume-weighted average price hurdles at $3.00 (vested 2024), $3.75 (vested 2025), $4.50, $5.25, and $6.00, enforced by a mandatory 75% net post-vesting share retention rule throughout tenure. Management beneficially controls 9.5% of common stock (3,371,768 shares), anchored by institutional holders Needham Investment Management (9.3%, 3,155,000 shares), Punch & Associates (7.6%, 2,552,455 shares), Richard H. Witmer, Jr. (7.3%, 2,478,026 shares), and Poplar Point Capital (6.9%, 2,329,374 shares).
Tax exposure is protected by $14,716,000 in federal net operating loss carryforwards (indefinite carryforward, with $11,400,000 restricted under IRC Section 382) and $7,410,000 in state NOLs expiring 2031. A 100% valuation allowance ($4,020,565) fully offsets net deferred tax assets, eliminating impairment risk, while uncertain tax positions stand at $0.
The primary risk for equity holders resides not in leverage, but in the dual exposure to Mexican Peso cost inflation across Latin American development centers and supplier leverage from two publishers controlling 39.0% of content fulfillment. However, with churn rates bounded (gross churn in the low single digits; net churn in the high single digits) and an unearned revenue backlog of $11,485,077 securing forward subscription visibility, the company's mix shift toward high-margin software licenses provides structural downside protection as the final acquisition earnouts conclude in FY27.
Presentation Download & Video Access:
- Presentation Download: Click the PDF download link under 'Related Topics' to access the full institutional presentation of this report.
- Video Link: Click this link to watch the HDIN analyst briefing on YouTube.
About HDIN Research:
HDIN Research is a premier global market intelligence and strategic advisory firm specializing in institutional-grade financial analysis, supply chain audits, and macroeconomic forecasting. Our dedicated sector analysts deliver actionable, data-driven insights tailored for private equity, hedge funds, and corporate strategy teams. Visit us at http://www.hdinresearch.com.
2026 AI Transparency Footer:
"This intelligence report was authored by HDIN Research analysts following a rigorous audit of official corporate filings. AI was utilized for massive-scale data synthesis and structural drafting, ensuring 100% inclusion of reported data points. All strategic insights, financial modeling, and final verdicts were verified by our editorial board to ensure professional accuracy and compliance with 2026 Google Search E-E-A-T standards."
1. Platforms subscription expansion of 9.84% to $20.82 million offset an 8.69% contraction in transactional revenue, driving blended gross margins up 258 basis points to 51.90% in fiscal 2026.
2. Operating cash flows funded $4.86 million in cash earnouts for Scite, Inc. alongside $2.91 million in equity installments, reducing contingent acquisition liabilities to $7.32 million without bank borrowings.
3. Operating leverage materialized through a 15.27% overhead contraction in administrative costs and 100% direct expensing of internal software research, leaving balance sheet assets free of capitalized capitalized development overhang.
Figure RESEARCH SOLUTIONS Institutional Audit Analysis
Segmental Economics and Subscription Margin ExpansionResearch Solutions, Inc. [NASDAQ: RSSS] reported fiscal year 2026 (FY26) financial results reflecting a structural business model transition toward recurring cloud software. Consolidated revenue contracted 1.53% year-over-year (YoY) to $48,306,957 compared to $49,057,981 in fiscal year 2025 (FY25), driven by an 8.69% decline in lower-margin transactional document delivery orders. Conversely, the high-margin Platforms division expanded 9.84% YoY to $20,820,974, lifting software subscription mix from 38.64% to 43.10% of total enterprise top line (+446 basis points).
Because Platforms carry an 87.47% gross margin compared to 24.95% for Transactions, the expanding software contribution lifted consolidated gross profit by 3.61% YoY to $25,070,508. Consolidated gross margin expanded 258 basis points from 49.32% in FY25 to 51.90% in FY26. Operating income (EBIT) increased 43.47% YoY to $3,588,377, generating an operating margin of 7.43% (+233 basis points YoY).
Cost containment within General and Administrative (G&A) expenses, which decreased 15.27% YoY to $6,724,399, generated operating leverage that offset a 19.36% increase in Sales and Marketing ($6,397,899) and an 8.71% increase in Technology and Product Development ($6,121,647). Net income expanded 122.99% YoY to $2,822,068, aided by a reduction in earnout fair-value and accretion charges from $1,748,526 in FY25 to $1,040,293 in FY26. Non-GAAP Adjusted EBITDA rose 10.61% YoY to $5,826,563, representing an Adjusted EBITDA margin of 12.06%.
Table Revenue Mix, Margin Expansion, and Earnings Performance (FY2025–FY2026)
| Statement of Operations Metric (USD) | FY 2026 (June 30, 2026) | FY 2025 (June 30, 2025) | YoY Shift ($) | YoY Shift (%) / bps |
| Platforms Subscription Revenue | $20,820,974 | $18,955,695 | +$1,865,279 | +9.84% |
| Transactions Content Revenue | $27,485,983 | $30,102,286 | -$2,616,303 | -8.69% |
| Total Consolidated Revenue | $48,306,957 | $49,057,981 | -$751,024 | -1.53% |
| Platforms Cost of Revenue | $2,609,421 | $2,371,540 | +$237,881 | +10.03% |
| Transactions Cost of Revenue | $20,627,028 | $22,490,490 | -$1,863,462 | -8.29% |
| Total Cost of Revenue | $23,236,449 | $24,862,030 | -$1,625,581 | -6.54% |
| Platforms Gross Profit (87.47% margin) | $18,211,553 | $16,584,155 | +$1,627,398 | +9.81% |
| Transactions Gross Profit (24.95% margin) | $6,858,955 | $7,611,796 | -$752,841 | -9.89% |
| Consolidated Gross Profit (51.90% margin) | $25,070,508 | $24,195,951 | +$874,557 | +3.61% (+258 bps) |
| Sales & Marketing Expense | $6,397,899 | $5,360,356 | +$1,037,543 | +19.36% |
| Technology & Product Development | $6,121,647 | $5,631,344 | +$490,303 | +8.71% |
| General & Administrative Expense | $6,724,399 | $7,936,644 | -$1,212,245 | -15.27% |
| Stock-Based Compensation Expense | $928,516 | $1,723,561 | -$795,045 | -46.13% |
| Depreciation & Amortization | $1,254,973 | $1,245,362 | +$9,611 | +0.77% |
| Operating Income (GAAP EBIT) | $3,588,377 | $2,501,211 | +$1,087,166 | +43.47% (+233 bps) |
| Accreted Interest / Fair Value Adjustment | -$1,040,293 | -$1,748,526 | +$708,233 | -40.50% |
| Other / Interest Income | $407,026 | $595,679 | -$188,653 | -31.67% |
| Provision for Income Taxes | $133,042 | $82,811 | +$50,231 | +60.66% |
| GAAP Net Income | $2,822,068 | $1,265,553 | +$1,556,515 | +122.99% (+326 bps) |
| Non-GAAP Adjusted EBITDA | $5,826,563 | $5,267,607 | +$558,956 | +10.61% (+132 bps) |
Cash flow from operations totaled $5,274,420 in FY26 compared to $7,023,166 in FY25, reflecting a negative working capital variance of -$771,430 versus a positive swing of $1,040,164 in FY25 due to trade payables run-down. Capital expenditures remained low at $39,771 ($19,261 in FY25), reflecting property and equipment asset requirements of under 0.1% of revenue. Under ASC 350-40, Research Solutions, Inc. expensed 100% of its internal software development expenditures ($3,132,876 in FY26 R&D, up 23.8% YoY from $2,530,959 in FY25), reporting $0 in capitalized software assets.
Unlevered Free Cash Flow reached $5,234,649, converting 185.49% of GAAP Net Income and 145.88% of GAAP EBIT. After deducting non-cash stock compensation of $928,516 ($330,374 stock options; $598,142 restricted stock) as an economic cost of talent retention, Adjusted True Economic Free Cash Flow stood at $4,306,133 ($5,280,344 in FY25), representing an 8.91% cash margin on gross revenue and a 152.59% conversion of Net Income.
The company's working capital position stood at -$4,246,458 at FY26 year-end, driven by $11,467,832 in current deferred revenue liabilities (plus $17,245 non-current, bringing total deferred revenue to $11,485,077, up 7.32% YoY from $10,702,120). Unearned subscription collections represented 55.16% of full-year Platforms revenue, with $9.25 million of FY25 ending deferred balances recognized into revenue during FY26. Trade receivables collection cycles remained stable: ending net Accounts Receivable closed at $6,963,040 (-3.17% YoY), yielding an ending Days Sales Outstanding (DSO) of 52.61 days (versus 53.49 days in FY25) against a two-point average DSO of 53.47 days (52.33 days in FY25). Allowances for credit losses contracted 43.39% YoY to $103,217, bolstered by a $23,000 credit to bad debt expense and realized write-offs of $56,000 (0.12% of revenue).
Total assets closed FY26 at $45,664,718, heavily concentrated in M&A intangibles: static goodwill of $16,372,979 and net identifiable intangibles of $8,537,870 ($10.80M gross developed technology; $1.50M gross customer lists; $170k gross customer relationships; $16.4k fully amortized IP licenses). Intangibles and goodwill together represent 54.55% of total assets and 120.30% of stockholders' equity ($20,706,847, up 48.67% YoY). Forward intangible amortization will generate an ongoing non-cash operational drag of $1,173,000 annually through FY31, consuming 32.69% of FY26 EBIT.
Operational Footprint and Content Sourcing Concentration
Research Solutions, Inc. operates through a decentralized corporate structure. In November 2019, the enterprise transitioned to a 100% remote operational architecture, holding zero physical leases or operating lease liabilities, maintaining its legal address in Henderson, Nevada. Operational, back-office, and development activities are executed through low-cost shared-service hubs in Mexico via two wholly owned operating subsidiaries: Reprints Desk Latin America S. de R.L. de C.V. (incorporated 2012) and ResSol LA, S. DE R.L. DE C.V. (incorporated 2022). Operating expenses generated in Mexico are transacted in Mexican Pesos (MXN). The company maintains no active foreign exchange derivative hedging program, exposing G&A and development expenditure to MXN currency appreciation against the U.S. Dollar.
The commercial footprint spans three primary geographic regions, with commercial channels targeting academic institutions, Tier-1 biopharma, and non-pharma industrial segments:
Table Geographic Revenue Concentration and Accounts Receivable Exposure (FY2025–FY2026)
| Geographic Region | FY26 Revenue (USD) | FY26 Share (%) | FY25 Revenue (USD) | FY25 Share (%) | FY26 Net AR (USD) | FY26 AR Share (%) |
| United States | $27,231,305 | 56.37% | $28,213,701 | 57.51% | $3,822,084 | 54.89% |
| Europe | $15,942,672 | 33.00% | $15,689,693 | 31.98% | $2,226,167 | 31.97% |
| Rest of World (incl. APAC, Japan, Taiwan, Province of China) | $5,132,980 | 10.63% | $5,154,587 | 10.51% | $914,789 | 13.14% |
| Total Global Footprint | $48,306,957 | 100.00% | $49,057,981 | 100.00% | $6,963,040 | 100.00% |
The business displays structural publisher concentration within its Transactions cost of sales ($20,627,028). In FY26, 46.0% of all content royalty costs were paid to three publishers (45.0% in FY25). Vendor A accounted for 28.0% of content costs (27.0% in FY25), while Vendor B absorbed 11.0% (10.0% in FY25). Because content agreements are non-exclusive, publishers retain pricing control and the right to provide direct enterprise access. To secure uninterrupted API distribution, Research Solutions expanded prepaid publisher royalty assets from $925 in FY25 to $411,297 in FY26, recording a net operational cash deposit outflow of $410,372.
To shield unit margins from copyright inflation and open-access leakage, the platform integrates Article Galaxy's automated entitlement management with Scite.ai's Retrieval Augmented Generation (RAG) architecture. This system references pre-negotiated text-and-data-mining (TDM) permissions across 200 million scientific articles to output contextual citation intelligence (supporting versus contrasting evidence) with reduced artificial intelligence hallucinations.
HDIN Institutional Verdict
Research Solutions, Inc. presents an institutional investment case characterized by balance-sheet hygiene and cash conversion discipline, offset by high content supplier concentration.
Funded bank debt stands at $0, backed by $12,630,283 in cash reserves and an undrawn $500,000 credit facility with PNC Bank priced at SOFR plus 2.50% (maturing April 15, 2027). The company self-funded $4,856,763 in cash earnouts and issued 1,032,401 common shares ($2,906,856 value) for Scite, Inc. during FY26 out of operational cash flow. The contingent consideration liability was reduced from $14,046,640 to $7,323,314 (100% current liabilities; non-current portion dropped from $6,683,488 to $0). Subsequent to fiscal year-end on August 2, 2026, the company disbursed the fifth quarterly tranche consisting of $1.2 million in cash and 329,118 common shares, leaving three quarterly payments through May 2027 requiring approximately $4.54 million in cash and $2.78 million in equity.
Share dilution remains bounded: outstanding common stock totaled 33,513,551 shares at FY26 year-end (expanding to 33,726,669 as of September 4, 2026). The equity structure includes 2,705,304 stock options (weighted average exercise price $2.29; 2,315,475 exercisable with $743,304 intrinsic value) and 1,093,793 unvested restricted shares, creating an 8.07% potential option overhang without outstanding warrants. Executive compensation aligns with equity appreciation: the Long-Term Equity Bonus Program conditions 20% tranche vesting on 30-day volume-weighted average price hurdles at $3.00 (vested 2024), $3.75 (vested 2025), $4.50, $5.25, and $6.00, enforced by a mandatory 75% net post-vesting share retention rule throughout tenure. Management beneficially controls 9.5% of common stock (3,371,768 shares), anchored by institutional holders Needham Investment Management (9.3%, 3,155,000 shares), Punch & Associates (7.6%, 2,552,455 shares), Richard H. Witmer, Jr. (7.3%, 2,478,026 shares), and Poplar Point Capital (6.9%, 2,329,374 shares).
Tax exposure is protected by $14,716,000 in federal net operating loss carryforwards (indefinite carryforward, with $11,400,000 restricted under IRC Section 382) and $7,410,000 in state NOLs expiring 2031. A 100% valuation allowance ($4,020,565) fully offsets net deferred tax assets, eliminating impairment risk, while uncertain tax positions stand at $0.
The primary risk for equity holders resides not in leverage, but in the dual exposure to Mexican Peso cost inflation across Latin American development centers and supplier leverage from two publishers controlling 39.0% of content fulfillment. However, with churn rates bounded (gross churn in the low single digits; net churn in the high single digits) and an unearned revenue backlog of $11,485,077 securing forward subscription visibility, the company's mix shift toward high-margin software licenses provides structural downside protection as the final acquisition earnouts conclude in FY27.
Presentation Download & Video Access:
- Presentation Download: Click the PDF download link under 'Related Topics' to access the full institutional presentation of this report.
- Video Link: Click this link to watch the HDIN analyst briefing on YouTube.
About HDIN Research:
HDIN Research is a premier global market intelligence and strategic advisory firm specializing in institutional-grade financial analysis, supply chain audits, and macroeconomic forecasting. Our dedicated sector analysts deliver actionable, data-driven insights tailored for private equity, hedge funds, and corporate strategy teams. Visit us at http://www.hdinresearch.com.
2026 AI Transparency Footer:
"This intelligence report was authored by HDIN Research analysts following a rigorous audit of official corporate filings. AI was utilized for massive-scale data synthesis and structural drafting, ensuring 100% inclusion of reported data points. All strategic insights, financial modeling, and final verdicts were verified by our editorial board to ensure professional accuracy and compliance with 2026 Google Search E-E-A-T standards."