XP Factory PLC: Strategic Pivot Toward Escape Hunt Estate Expansion Across the UK as Group Net Loss Reaches £4.51 Million
Date : 2026-09-18
Reading : 234
HDIN Executive Takeaways
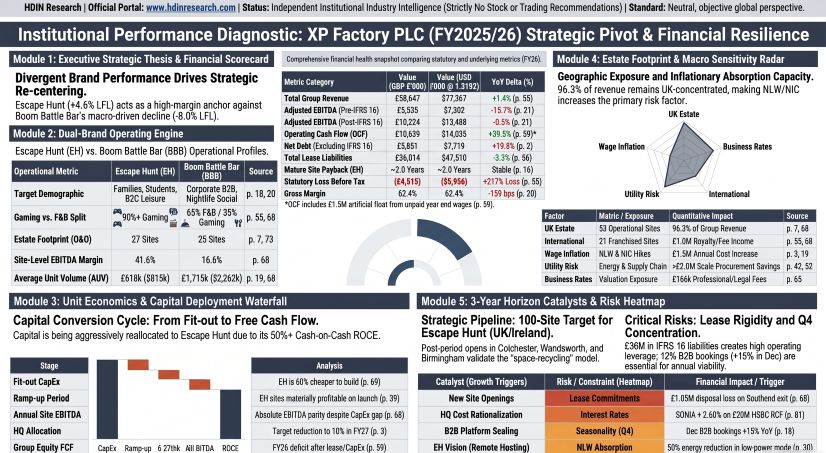
1. Statutory net loss widened by 217.5% to -£4.51 million (-$5.96 million) in FY26, driven by an £8.46 million financing and lease depreciation burden, while pre-IFRS 16 Adjusted EBITDA dropped 15.7% to £5.54 million ($7.30 million).
2. Owner-operated unit economics sharply diverged as Escape Hunt achieved a 41.57% site EBITDA margin and +4.6% UK LFL growth, whereas Boom Battle Bar experienced an -8.0% UK LFL contraction and margin deterioration to 16.56%.
3. Capital allocation has shifted decisively toward 100 planned Escape Hunt company-owned sites across the UK and Ireland, pausing aggressive Boom rollouts while leveraging an undrawn £8.0 million HSBC facility.
Figure XP Factory PLC (FY2025-26) Strategic Pivot & Financial Resilience
 Segmental Realities and Margin Compression
XP Factory PLC reported total revenue of £58.65 million ($77.37 million) for the 52-week period ended 29 March 2026, representing a 1.43% reported increase and a 3.08% underlying increase from £57.82 million ($76.27 million) in FY25. The group's gross margin compressed by 159 basis points from 63.97% to 62.38%, impacted by an industry-wide labor inflation shock of approximately £1.50 million ($1.98 million) following statutory increases to the UK National Living Wage and Employer National Insurance Contributions.
Operational results exposed a wide performance gap between the company's two principal operating concepts. Escape Hunt operated as an asset-efficient, high-margin division, while Boom Battle Bar absorbed macroeconomic headwinds and fixed-cost pressures inherent in wet-led, experiential hospitality formats.
Table 1: Segmental Operational and Unit Economic Matrix (FY25 vs. FY26)
Owner-operated venues generated 98.28% of total group turnover (£57.64 million / $76.04 million),
rendering franchise operations a minor income contributor at 1.72% (£1.01 million / $1.33 million). While the franchise model maintained an operating margin of 99.5% by incurring only £5,000 in direct administrative support costs, it contributed £0.98 million in site-level EBITDA. The owner-operated segment contributed £13.49 million in pre-IFRS 16 site EBITDA, or 93.2% of total venue profit.
Table 2: Group Revenue Streams and P&L Bridge (FY25 vs. FY26)
Pre-IFRS 16 Adjusted EBITDA fell 15.70% to £5.54 million ($7.30 million), reducing margins from 11.36% to 9.44%. In contrast, Post-IFRS 16 Adjusted EBITDA appeared comparatively stable, contracting by 0.52% to £10.22 million ($13.49 million) due to the add-back of £4.69 million ($6.19 million) in operational cash rent.
Reported operating cash flow increased 39.45% to £10.64 million ($14.03 million). However, working capital analysis indicates that this improvement was driven by a £2.75 million increase in trade and other payables, which included £1.50 million ($1.97 million) in accrued, unpaid payroll at the balance sheet date resulting from a 4-4-5 accounting calendar transition. Normalizing for this timing float reduces underlying operating cash generation to £9.14 million ($12.06 million).
Table 3: True Free Cash Flow Architecture and Capital Outlays
Fixed financial obligations continued to absorb cash generation. The group met £5.27 million ($6.95 million) in mandatory lease principal repayments, £3.19 million in lease interest charges, and £5.67 million in net capital expenditures. This resulted in negative true equity free cash flow of -£0.94 million (-$1.24 million), compared to a deficit of -£3.82 million (-$5.04 million) in FY25.
Infrastructure Layout and Regional Moats
As of 29 March 2026, XP Factory PLC operated an infrastructure network of 75 branded units situated across 69 physical commercial locations. In 6 of these properties, including locations in Oxford and Reading, the company deployed a dual-branded model housing both Escape Hunt and Boom Battle Bar. This footprint enabled shared property management and entrance infrastructure, lowering duplicate overhead costs.
Table 4: Geographic Revenue Distribution & Regional Footprints
The domestic UK market generated 96.26% of group revenue (£56.46 million / $74.48 million). Continental Europe generated £0.83 million ($1.09 million), while the Rest of World territory contributed £1.36 million ($1.80 million).
The physical estate is supported by proprietary operational technologies designed to limit unit-level operating costs:
* Central Game Design and Automation: Escape Hunt Studios maintains a library of 32 proprietary games. It runs the Show Control v5 automation engine, which coordinates in-room lighting, audio, and physical triggers.
* Operational Hardware: Venues use proprietary ClueCube wireless interactive devices alongside the central EH Vision monitoring platform. This architecture supports off-site, remote-hosted game monitoring, reducing requirements for dedicated on-site personnel.
* Energy Management Infrastructure: Escape Hunt rooms include an automated low-power state that reduces venue power usage by 50% during non-booked operating windows. All UK energy procurement is sourced via renewable utility tariffs.
* Procurement and Dispense Systems: The company completed a supply agreement with Budweiser Brewing Group covering draft beverage dispensing systems across its 69 locations, securing more than £2.0 million ($2.64 million) in annualized operational cost reductions.
HDIN Institutional Verdict
The operational and financial disclosures in XP Factory PLC’s FY26 accounts show clear execution within its Escape Hunt brand, contrasted with structural asset-intensity challenges in the Boom Battle Bar network.
The Escape Hunt unit model demonstrates resilient economics. Requiring limited fit-out capital expenditure (£300,000 to £500,000 per site) and modest physical space (250 m² to 400 m²), the format generated a 41.57% site EBITDA margin, a 2.0-year capital payback period, and a cash-on-cash ROCE above 50%. The concept expanded UK LFL sales by 4.6% during a fiscal period where broader UK hospitality and competitive socializing indices fell 9.0%.
Conversely, Boom Battle Bar operates as an operationally geared, wet-led entertainment venue. Large unit layouts (1,000 m² to 1,500 m²) require substantial upfront capital (£700,000 to £1,200,000), leaving the business exposed to £36.01 million ($47.51 million) in total balance sheet lease liabilities. When Boom suffered an -8.0% UK LFL sales contraction, gross margin fell to 57.83%, pushing pre-IFRS 16 site EBITDA down 6.37% to £6.93 million ($9.15 million).
Table 5: Capital Structure and Solvency Risk Profile (FY25 vs. FY26)
Management has initiated a strategic real-estate adjustment. Led by non-executive Chairman James van den Bergh, the board has curtailed the rollout of new Boom Battle Bar sites, exited underperforming properties through the closures of Boom Southend and Boom Dubai, and enacted a £1.00 million ($1.32 million) annualized corporate overhead reduction program.
The primary growth strategy now concentrates capital on expanding the UK Escape Hunt company-owned footprint toward 100 locations, supported by new post-period openings in Colchester, Birmingham Cannon Street, and Wandsworth. The Wandsworth property exemplifies this approach by carving out underutilized floor space from an existing Boom Battle Bar venue to construct an Escape Hunt unit.
Financial stability is supported by an enlarged £20.0 million revolving credit facility secured with HSBC UK Bank plc through December 2028, priced at SONIA plus 2.60%. Although post-period drawdowns to fund expansion raised drawn bank debt to £12.0 million ($15.83 million), £8.0 million ($10.55 million) in undrawn facility headroom remains available.
Long-term value creation depends on management's ability to maintain capital discipline, deploy cash flows into the higher-return Escape Hunt estate, and improve utilization across its existing Boom Battle Bar operations.
Presentation Download & Video Access:
- Presentation Download: Click the PDF download link under 'Related Topics' to access the full institutional presentation of this report.
- Video Link: Click this link to watch the HDIN analyst briefing on YouTube.
About HDIN Research:
HDIN Research is a premier global market intelligence and strategic advisory firm specializing in institutional-grade financial analysis, supply chain audits, and macroeconomic forecasting. Our dedicated sector analysts deliver actionable, data-driven insights tailored for private equity, hedge funds, and corporate strategy teams. Visit us at http://www.hdinresearch.com.
2026 AI Transparency Footer:
"This intelligence report was authored by HDIN Research analysts following a rigorous audit of official corporate filings. AI was utilized for massive-scale data synthesis and structural drafting, ensuring 100% inclusion of reported data points. All strategic insights, financial modeling, and final verdicts were verified by our editorial board to ensure professional accuracy and compliance with 2026 Google Search E-E-A-T standards."
1. Statutory net loss widened by 217.5% to -£4.51 million (-$5.96 million) in FY26, driven by an £8.46 million financing and lease depreciation burden, while pre-IFRS 16 Adjusted EBITDA dropped 15.7% to £5.54 million ($7.30 million).
2. Owner-operated unit economics sharply diverged as Escape Hunt achieved a 41.57% site EBITDA margin and +4.6% UK LFL growth, whereas Boom Battle Bar experienced an -8.0% UK LFL contraction and margin deterioration to 16.56%.
3. Capital allocation has shifted decisively toward 100 planned Escape Hunt company-owned sites across the UK and Ireland, pausing aggressive Boom rollouts while leveraging an undrawn £8.0 million HSBC facility.
Figure XP Factory PLC (FY2025-26) Strategic Pivot & Financial Resilience
Segmental Realities and Margin CompressionXP Factory PLC reported total revenue of £58.65 million ($77.37 million) for the 52-week period ended 29 March 2026, representing a 1.43% reported increase and a 3.08% underlying increase from £57.82 million ($76.27 million) in FY25. The group's gross margin compressed by 159 basis points from 63.97% to 62.38%, impacted by an industry-wide labor inflation shock of approximately £1.50 million ($1.98 million) following statutory increases to the UK National Living Wage and Employer National Insurance Contributions.
Operational results exposed a wide performance gap between the company's two principal operating concepts. Escape Hunt operated as an asset-efficient, high-margin division, while Boom Battle Bar absorbed macroeconomic headwinds and fixed-cost pressures inherent in wet-led, experiential hospitality formats.
Table 1: Segmental Operational and Unit Economic Matrix (FY25 vs. FY26)
| Segment & Operational Metric | FY2025 (£'000) | FY2025 ($'000) | FY2026 (£'000) | FY2026 ($'000) | YoY Change |
|---|---|---|---|---|---|
| Escape Hunt (Owner-Operated) | |||||
| — Revenue | £14,213 | $18,750.0 | £15,765 | $20,797.2 | +10.92% |
| — UK Like-for-Like (LFL) Sales | +4.00% | +4.00% | +4.60% | +4.60% | +60 bps |
| — Site EBITDA (Pre-IFRS 16) | £6,147 | $8,109.1 | £6,553 | $8,644.7 | +6.60% |
| — Site EBITDA Margin | 43.25% | 43.25% | 41.57% | 41.57% | -168 bps |
| — Year-End Owner-Operated Venues | 25 sites | 25 sites | 27 sites | 27 sites | +2 sites |
| — Average Unit Volume (AUV) | £568.5 | $750.0 | £618.2 | $815.5 | +8.74% |
| — Capital Expenditure per Unit | £300–£500 | $395–$660 | £300–£500 | $395–$660 | Flat |
| — Cash Payback Period | ~2.0 years | ~2.0 years | ~2.0 years | ~2.0 years | Stable |
| — Cash-on-Cash ROCE Target | 50%–60%+ | 50%–60%+ | 50%–60%+ | 50%–60%+ | Stable |
| Boom Battle Bar (Owner-Operated) | |||||
| — Revenue (Reported) | £42,165 | $55,624.1 | £41,875 | $55,241.5 | -0.69% |
| — Revenue (Underlying) | £42,200 | $55,670.2 | £42,800 | $56,461.8 | +1.42% |
| — UK Like-for-Like (LFL) Sales | N/A | N/A | -8.00% | -8.00% | Underperformance |
| — Site EBITDA (Pre-IFRS 16) | £7,405 | $9,768.7 | £6,933 | $9,146.0 | -6.37% |
| — Site EBITDA Margin | 17.56% | 17.56% | 16.56% | 16.56% | -100 bps |
| — Year-End Owner-Operated Venues | 25 sites | 25 sites | 25 sites | 25 sites | 0 sites |
| — Average Unit Volume (AUV) | £1,688.0 | $2,226.8 | £1,715.0 | $2,262.4 | +1.60% |
| — Capital Expenditure per Unit | £700–£1,200 | $923–$1,583 | £700–£1,200 | $923–$1,583 | Flat |
| — Cash Payback Period | 3.0–4.0 years | 3.0–4.0 years | 3.0–4.0 years | 3.0–4.0 years | Lengthened |
| — Cash-on-Cash ROCE Target | 23%–30% | 23%–30% | 23%–30% | 23%–30% | Compressed |
Owner-operated venues generated 98.28% of total group turnover (£57.64 million / $76.04 million),
rendering franchise operations a minor income contributor at 1.72% (£1.01 million / $1.33 million). While the franchise model maintained an operating margin of 99.5% by incurring only £5,000 in direct administrative support costs, it contributed £0.98 million in site-level EBITDA. The owner-operated segment contributed £13.49 million in pre-IFRS 16 site EBITDA, or 93.2% of total venue profit.
Table 2: Group Revenue Streams and P&L Bridge (FY25 vs. FY26)
| Line Item | FY2025 (£'000) | FY2025 ($'000) | FY2026 (£'000) | FY2026 ($'000) | YoY Change |
|---|---|---|---|---|---|
| Revenue Streams | |||||
| — Gaming & Ticket Revenue | £28,995 | $38,250.2 | £29,902 | $39,446.7 | +3.13% |
| — Food & Beverage Revenue | £25,419 | $33,532.7 | £26,971 | $35,580.1 | +6.11% |
| — Supplier Retros | £1,176 | $1,551.4 | £626 | $825.8 | -46.77% |
| — Franchise Upfront & Support Fees | £216 | $284.9 | £86 | $113.5 | -60.19% |
| — Franchise Royalties | £1,224 | $1,614.7 | £920 | $1,213.7 | -24.84% |
| — Other Owner-Operated Income | £788 | $1,039.5 | £142 | $187.3 | -81.98% |
| Total Reported Revenue | £57,818 | $76,273.5 | £58,647 | $77,367.1 | +1.43% |
| Cost of Sales | (£20,834) | ($27,484.2) | (£22,062) | ($29,104.2) | +5.89% |
| Gross Profit | £36,984 | $48,789.3 | £36,585 | $48,262.9 | -1.08% |
| Statutory-to-Adjusted P&L Bridge | |||||
| Statutory Operating Profit/(Loss) | £1,727 | $2,278.3 | (£527) | ($695.2) | -130.52% |
| + Branch Pre-Opening Costs | £799 | $1,054.0 | £842 | $1,110.8 | +5.38% |
| + Exceptional / Non-Recurring Costs | £857 | $1,130.6 | £480 | $633.2 | -43.99% |
| = Adjusted Operating Profit | £3,383 | $4,462.9 | £795 | $1,048.8 | -76.50% |
| + Depreciation of PPE | £3,841 | $5,067.0 | £5,095 | $6,721.3 | +32.65% |
| + Depreciation of ROU Assets | £2,596 | $3,424.6 | £2,844 | $3,751.8 | +9.55% |
| + Amortisation of Intangibles | £265 | $349.6 | £350 | $461.7 | +32.08% |
| + Loss on Asset Disposals | £110 | $145.1 | £1,052 | $1,387.8 | +856.36% |
| + Dilapidations & Closure Costs | £32 | $42.2 | £39 | $51.4 | +21.88% |
| + Share-Based Payments | £49 | $64.6 | £77 | $101.6 | +57.14% |
| + Other Non-Operating Adjustments | £14 | $18.5 | (£9) | ($11.9) | N/A |
| = Post-IFRS 16 Adjusted EBITDA | £10,277 | $13,557.4 | £10,224 | $13,487.5 | -0.52% |
| − IFRS 16 Property Cash Rent | (£3,711) | ($4,895.5) | (£4,689) | ($6,185.7) | +26.35% |
| = Pre-IFRS 16 Adjusted EBITDA | £6,566 | $8,661.9 | £5,535 | $7,301.8 | -15.70% |
| Net Finance Charges (Excl. Leases) | (£395) | ($521.1) | (£644) | ($849.6) | +63.04% |
| IFRS 16 Lease Interest Charges | (£2,754) | ($3,633.1) | (£3,189) | ($4,206.9) | +15.79% |
| Loss Before Tax | (£1,422) | ($1,876.2) | (£4,515) | ($5,956.2) | +217.51% |
| Loss After Tax | (£1,427) | ($1,882.5) | (£4,510) | ($5,949.6) | +216.05% |
Pre-IFRS 16 Adjusted EBITDA fell 15.70% to £5.54 million ($7.30 million), reducing margins from 11.36% to 9.44%. In contrast, Post-IFRS 16 Adjusted EBITDA appeared comparatively stable, contracting by 0.52% to £10.22 million ($13.49 million) due to the add-back of £4.69 million ($6.19 million) in operational cash rent.
Reported operating cash flow increased 39.45% to £10.64 million ($14.03 million). However, working capital analysis indicates that this improvement was driven by a £2.75 million increase in trade and other payables, which included £1.50 million ($1.97 million) in accrued, unpaid payroll at the balance sheet date resulting from a 4-4-5 accounting calendar transition. Normalizing for this timing float reduces underlying operating cash generation to £9.14 million ($12.06 million).
Table 3: True Free Cash Flow Architecture and Capital Outlays
| Cash Flow Component | FY2025 (£'000) | FY2025 ($'000) | FY2026 (£'000) | FY2026 ($'000) | YoY Change |
|---|---|---|---|---|---|
| Operating Cash Flow Before Working Capital | £8,495 | $11,206.6 | £8,687 | $11,460.0 | +2.26% |
| Net Working Capital Movements | (£849) | ($1,120.0) | £1,950 | $2,572.4 | N/A |
| Cash Generated from Operations | £7,646 | $10,086.6 | £10,637 | $14,032.3 | +39.12% |
| Net Income Tax Paid/(Received) | (£17) | ($22.4) | £2 | $2.6 | N/A |
| Net Operating Cash Flow | £7,629 | $10,064.2 | £10,639 | $14,034.9 | +39.45% |
| Gross Capital Expenditure | (£7,684) | ($10,136.7) | (£6,145) | ($8,106.5) | -20.03% |
| Landlord Fit-Out Subsidies Received | +£985 | +$1,299.4 | +£475 | +$626.6 | -51.78% |
| Net Capital Outflow | (£6,699) | ($8,837.3) | (£5,670) | ($7,479.9) | -15.36% |
| Net Operating Banking Interest | (£395) | ($521.1) | (£635) | ($837.7) | +60.76% |
Fixed financial obligations continued to absorb cash generation. The group met £5.27 million ($6.95 million) in mandatory lease principal repayments, £3.19 million in lease interest charges, and £5.67 million in net capital expenditures. This resulted in negative true equity free cash flow of -£0.94 million (-$1.24 million), compared to a deficit of -£3.82 million (-$5.04 million) in FY25.
Infrastructure Layout and Regional Moats
As of 29 March 2026, XP Factory PLC operated an infrastructure network of 75 branded units situated across 69 physical commercial locations. In 6 of these properties, including locations in Oxford and Reading, the company deployed a dual-branded model housing both Escape Hunt and Boom Battle Bar. This footprint enabled shared property management and entrance infrastructure, lowering duplicate overhead costs.
Table 4: Geographic Revenue Distribution & Regional Footprints
| Geographic Region | FY2025 (£'000) | FY2025 ($'000) | FY2026 (£'000) | FY2026 ($'000) | YoY Change |
|---|---|---|---|---|---|
| United Kingdom | £54,955 | $72,496.6 | £56,455 | $74,475.4 | +2.73% |
| Continental Europe | £1,031 | $1,360.1 | £829 | $1,093.6 | -19.59% |
| Rest of World | £1,832 | $2,416.8 | £1,363 | $1,798.1 | -25.60% |
| Total Group Revenue | £57,818 | $76,273.5 | £58,647 | $77,367.1 | +1.43% |
The domestic UK market generated 96.26% of group revenue (£56.46 million / $74.48 million). Continental Europe generated £0.83 million ($1.09 million), while the Rest of World territory contributed £1.36 million ($1.80 million).
The physical estate is supported by proprietary operational technologies designed to limit unit-level operating costs:
* Central Game Design and Automation: Escape Hunt Studios maintains a library of 32 proprietary games. It runs the Show Control v5 automation engine, which coordinates in-room lighting, audio, and physical triggers.
* Operational Hardware: Venues use proprietary ClueCube wireless interactive devices alongside the central EH Vision monitoring platform. This architecture supports off-site, remote-hosted game monitoring, reducing requirements for dedicated on-site personnel.
* Energy Management Infrastructure: Escape Hunt rooms include an automated low-power state that reduces venue power usage by 50% during non-booked operating windows. All UK energy procurement is sourced via renewable utility tariffs.
* Procurement and Dispense Systems: The company completed a supply agreement with Budweiser Brewing Group covering draft beverage dispensing systems across its 69 locations, securing more than £2.0 million ($2.64 million) in annualized operational cost reductions.
HDIN Institutional Verdict
The operational and financial disclosures in XP Factory PLC’s FY26 accounts show clear execution within its Escape Hunt brand, contrasted with structural asset-intensity challenges in the Boom Battle Bar network.
The Escape Hunt unit model demonstrates resilient economics. Requiring limited fit-out capital expenditure (£300,000 to £500,000 per site) and modest physical space (250 m² to 400 m²), the format generated a 41.57% site EBITDA margin, a 2.0-year capital payback period, and a cash-on-cash ROCE above 50%. The concept expanded UK LFL sales by 4.6% during a fiscal period where broader UK hospitality and competitive socializing indices fell 9.0%.
Conversely, Boom Battle Bar operates as an operationally geared, wet-led entertainment venue. Large unit layouts (1,000 m² to 1,500 m²) require substantial upfront capital (£700,000 to £1,200,000), leaving the business exposed to £36.01 million ($47.51 million) in total balance sheet lease liabilities. When Boom suffered an -8.0% UK LFL sales contraction, gross margin fell to 57.83%, pushing pre-IFRS 16 site EBITDA down 6.37% to £6.93 million ($9.15 million).
Table 5: Capital Structure and Solvency Risk Profile (FY25 vs. FY26)
| Balance Sheet / Capital Structure Metric | FY2025 (£'000) | FY2025 ($'000) | FY2026 (£'000) | FY2026 ($'000) | YoY Change |
|---|---|---|---|---|---|
| Cash and Cash Equivalents | £1,095 | $1,444.5 | £2,805 | $3,700.4 | +156.16% |
| Vendor Loans Due | £607 | $800.8 | £168 | $221.6 | -72.32% |
| Fit-Out & Equipment Financing | £778 | $1,026.3 | £378 | $498.7 | -51.41% |
| Bank Facilities (Barclays / HSBC) | £4,603 | $6,072.3 | £8,110 | $10,698.7 | +76.19% |
| Total Gross Borrowings (Excluding Leases) | £5,988 | $7,899.4 | £8,656 | $11,419.0 | +44.56% |
| Net Debt (Excluding Leases) | £4,893 | $6,454.8 | £5,851 | $7,718.6 | +19.58% |
| IFRS 16 Current Lease Liabilities | £2,419 | $3,191.1 | £2,836 | $3,741.2 | +17.24% |
| IFRS 16 Non-Current Lease Liabilities | £34,822 | $45,937.2 | £33,178 | $43,768.4 | -4.72% |
| Total Lease Obligations | £37,241 | $49,128.3 | £36,014 | $47,509.7 | -3.29% |
| Net Total Debt (Including Leases) | £42,134 | $55,583.2 | £41,865 | $55,228.3 | -0.64% |
| Net Equity (Shareholders' Capital) | £24,527 | $32,356.0 | £20,044 | $26,442.0 | -18.28% |
| Net Debt (Excluding Leases) / Pre-IFRS 16 EBITDA | 0.75x | 0.75x | 1.06x | 1.06x | +31 bps |
Management has initiated a strategic real-estate adjustment. Led by non-executive Chairman James van den Bergh, the board has curtailed the rollout of new Boom Battle Bar sites, exited underperforming properties through the closures of Boom Southend and Boom Dubai, and enacted a £1.00 million ($1.32 million) annualized corporate overhead reduction program.
The primary growth strategy now concentrates capital on expanding the UK Escape Hunt company-owned footprint toward 100 locations, supported by new post-period openings in Colchester, Birmingham Cannon Street, and Wandsworth. The Wandsworth property exemplifies this approach by carving out underutilized floor space from an existing Boom Battle Bar venue to construct an Escape Hunt unit.
Financial stability is supported by an enlarged £20.0 million revolving credit facility secured with HSBC UK Bank plc through December 2028, priced at SONIA plus 2.60%. Although post-period drawdowns to fund expansion raised drawn bank debt to £12.0 million ($15.83 million), £8.0 million ($10.55 million) in undrawn facility headroom remains available.
Long-term value creation depends on management's ability to maintain capital discipline, deploy cash flows into the higher-return Escape Hunt estate, and improve utilization across its existing Boom Battle Bar operations.
Presentation Download & Video Access:
- Presentation Download: Click the PDF download link under 'Related Topics' to access the full institutional presentation of this report.
- Video Link: Click this link to watch the HDIN analyst briefing on YouTube.
About HDIN Research:
HDIN Research is a premier global market intelligence and strategic advisory firm specializing in institutional-grade financial analysis, supply chain audits, and macroeconomic forecasting. Our dedicated sector analysts deliver actionable, data-driven insights tailored for private equity, hedge funds, and corporate strategy teams. Visit us at http://www.hdinresearch.com.
2026 AI Transparency Footer:
"This intelligence report was authored by HDIN Research analysts following a rigorous audit of official corporate filings. AI was utilized for massive-scale data synthesis and structural drafting, ensuring 100% inclusion of reported data points. All strategic insights, financial modeling, and final verdicts were verified by our editorial board to ensure professional accuracy and compliance with 2026 Google Search E-E-A-T standards."