Midwest Energy Limited: Greenfield Magnet and BESS Capex Pivot Accelerates Pre-Commercial Cash Burn Amid Related-Party Debt Expansion
Date : 2026-09-16
Reading : 117
HDIN Executive Takeaways
1. Midwest Energy Limited pivoted from legacy natural stone operations toward greenfield Sintered NdFeB Rare Earth Magnets and BESS manufacturing, posting an FY26 consolidated net loss of INR 1,400.69 lakhs with an Operating Cash Flow deficit of INR 1,423.82 lakhs.
2. The Group accumulated INR 32,792.63 lakhs across non-earning assets—including INR 16,391.30 lakhs in CWIP and INR 6,225.53 lakhs in freehold land at Boothpur Village, Mahbubnagar, Telangana—leaving revenue delivery tied to an unproven FY 2026–27 COD target.
3. Balance sheet expansion to INR 71,395.51 lakhs relies on external capital, including INR 33,485.00 lakhs in gross preferential equity, INR 10,232.53 lakhs in on-demand borrowings, and INR 13,230.96 lakhs in zero-interest debt extended by corporate promoters and directors.
Figure Midwest Energy Limited (MEL) FY2025-26 Executive Research Blueprint
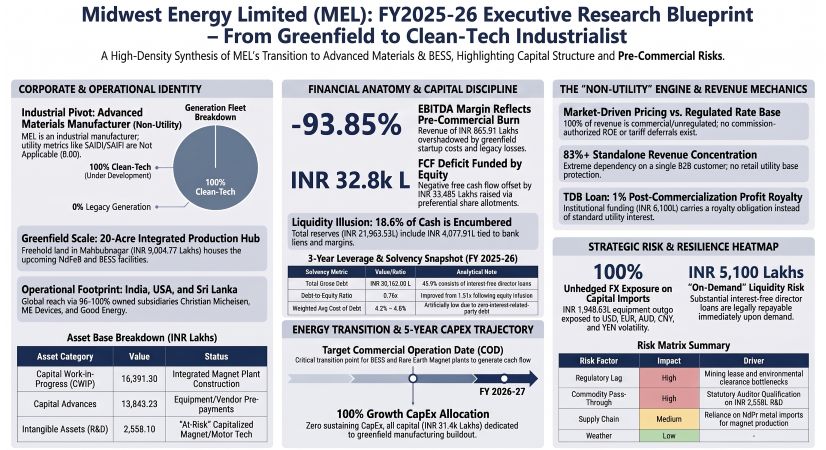 Financial Performance, Dupont Realities, and Pre-Commercial Capital Build
Midwest Energy Limited [BSE: 512485] (formerly Midwest Gold Limited) completed the amalgamation of Midwest Energy Private Limited, shifting operating activities from legacy granite processing and marble trading toward advanced clean technology components. Because primary production assets remained under construction as of March 31, 2026, reported revenue does not stem from commercial-scale magnet production.
Consolidated Operating Revenue expanded 1,016.15% year-over-year to INR 865.91 lakhs in FY26, compared to INR 77.58 lakhs in FY25. Cost of Goods Sold (COGS) fell 40.70% to INR 96.20 lakhs, lifting gross profit to INR 769.71 lakhs from a gross loss of INR 84.65 lakhs in FY25. However, corporate general overhead and pre-operative expenditures generated an EBITDA loss of INR 812.66 lakhs (compared to a loss of INR 389.25 lakhs in FY25) and an Adjusted EBIT loss of INR 1,141.16 lakhs (compared to a loss of INR 447.72 lakhs in FY25).
Total net loss for the year widened 104.83% to INR 1,400.69 lakhs, with the net loss attributable to equity owners reaching INR 1,260.76 lakhs. Total net loss attributable to non-controlling interests (NCI) stood at INR 139.93 lakhs, shifting NCI carrying equity to negative INR 124.09 lakhs.
Table Revenue Inflection, Margin Structure, and Profitability Deterioration (FY2025–FY2026)
On a standalone basis, Midwest Energy Limited reported revenue of INR 3,199.21 lakhs in FY26 compared to INR 376.07 lakhs in FY25, delivering net profit of INR 279.59 lakhs versus a standalone net loss of INR 304.27 lakhs in FY25. This profitability stems from inter-company corporate guarantee charges, project management advisory fees, and interest income charged to project subsidiaries at 8.50% per annum (including INR 7,005.46 lakhs due from Midwest Advanced Materials Private Limited, INR 2,337.78 lakhs from Midwest Energy Devices Private Limited, and INR 918.53 lakhs from Christian Michelsen Energy Private Limited). These transactions were eliminated on consolidation.
DuPont decomposition highlights an asset turnover collapse characteristic of greenfield infrastructure execution. Total asset turnover fell to 0.019x on average assets (0.012x on period-end assets), alongside a net capital turnover ratio of 0.06x. The group asset base expanded 253.32% from INR 20,206.79 lakhs to INR 71,395.51 lakhs. Non-earning assets accounted for 45.93% of balance sheet deployment:
* Capital Work-in-Progress (CWIP): INR 16,391.30 lakhs (sintered magnet and alloy equipment lines).
* Capital Advances: INR 13,843.23 lakhs (including INR 5,191.41 lakhs paid to PPS Inviro Private Limited for uncompleted equity/debt allocations).
* Intangible Assets Under Development (IAUD): INR 2,558.10 lakhs (in-house metallurgy, magnets, and motor engineering).
* Operating Property, Plant & Equipment (PPE): INR 9,132.70 lakhs net book value, out of gross PPE of INR 9,567.44 lakhs (comprising INR 9,004.77 lakhs in freehold land, with ex-land operating plant, buildings, and legacy stone assets depreciated by 77.21%).
Financial leverage moderated at the holding company level despite absolute gross debt expanding 184.66% from INR 10,595.68 lakhs to INR 30,162.00 lakhs. Net equity proceeds of INR 32,477.98 lakhs from preferential allotments (INR 33,485.00 lakhs gross equity capital and premium raised) lifted consolidated equity by 356.28% from INR 8,727.85 lakhs to INR 39,823.47 lakhs. Consequently, the period-end equity multiplier declined from 2.32x to 1.79x (1.89x on average equity), lowering the consolidated Debt-to-Equity ratio from 1.21x to 0.76x.
Free Cash Flow (FCF) burn reached negative INR 32,828.92 lakhs in FY26, worsening 182.27% from negative INR 11,630.40 lakhs in FY24–25:
* Operating Cash Flow (OCF): Negative INR 1,423.82 lakhs (an improvement from negative INR 3,328.26 lakhs in FY25), driven by an operating loss before working capital changes of INR 934.89 lakhs, working capital consumption of INR 366.49 lakhs (inventory additions of INR 254.24 lakhs, trade payables reduction of INR 201.62 lakhs, offset by trade receivables collections of INR 89.37 lakhs), and direct income taxes paid of INR 122.45 lakhs.
* Growth CapEx Outflows: INR 31,405.10 lakhs, comprising INR 18,777.23 lakhs in cash purchases of PPE and CWIP, INR 811.82 lakhs in R&D capitalization under IAUD, and INR 11,816.05 lakhs in net capital advance disbursements. Sustaining CapEx remained at INR 0.00.
* Organic Reinvestment Rate: Zero percent (0.00%). Reinvestment was fully dependent on external funding, composed of INR 32,663.06 lakhs in net equity issuance and INR 19,323.23 lakhs in gross debt proceeds.
Consolidated gross debt of INR 30,162.00 lakhs carries a blended Weighted Average Cost of Debt (WACD) between 4.2% and 4.8%. This cost profile is subsidized by INR 13,230.96 lakhs (43.87% of gross borrowings) in zero-interest debt provided by company directors and related promoters.
Long-term borrowings reached INR 19,805.34 lakhs (compared to INR 7,720.11 lakhs in FY25), consisting of:
* Canara Bank Term Loan: INR 4,845.33 lakhs (linked to floating rates; INR 4,577.00 lakhs remains undrawn out of sanctioned limits).
* Financial Institution Term Loan (Aditya Birla Capital): INR 749.29 lakhs (secured against land at Pashamylaram Village, Sangareddy).
* Technology Development Board (TDB) Facility: INR 6,100.00 lakhs disbursed (floating linked; INR 6,300.00 lakhs undrawn out of INR 12,400.00 lakhs total sanction; subject to a 1.0% post-commercialization profit royalty).
* Midwest Limited (Promoter Entity): INR 1,347.00 lakhs in 9.0% Non-Cumulative Preference Shares.
* Deepak Kukreti (Director): INR 3,815.00 lakhs in interest-free long-term unsecured borrowings.
* HERSC Note Payable: INR 2,729.82 lakhs (held via US subsidiary National Solar Management LLC, carrying 0% interest and mandating 60% of pre-tax net cash flows toward principal service).
Current borrowings totaled INR 10,356.66 lakhs, comprising INR 2,164.56 lakhs under a Canara Bank overdraft facility, INR 5,100.00 lakhs in current unsecured director loans repayable on demand, INR 375.00 lakhs from promoters, and INR 2,592.97 lakhs from Midwest Limited (INR 1,211.14 lakhs interest-free pre-2013 legacy loans and INR 1,381.83 lakhs at 9% per annum, accruing INR 217.39 lakhs in annual interest expenses).
Contractual loan principal due within 12 months stood at INR 124.13 lakhs. Net debt totaled INR 8,198.47 lakhs against liquid cash reserves of INR 21,963.53 lakhs (INR 12,676.34 lakhs in unrestricted current accounts and INR 9,287.19 lakhs in term deposits). However, net usable liquidity is constrained: INR 4,077.91 lakhs in term deposits is legally encumbered under bank liens, reducing unencumbered cash cushions to INR 17,885.62 lakhs. Floating debt exposures account for 51.61% of borrowings (INR 15,567.86 lakhs), while fixed or zero-rate borrowings represent 48.39% (INR 14,594.14 lakhs). With operating EBITDA negative at INR 812.66 lakhs, Interest Coverage Ratio (Adjusted EBIT / Finance Costs) settled at negative 4.40x against finance costs of INR 259.53 lakhs, alongside a Debt Service Coverage Ratio (DSCR) of negative 4.13x.
Operating Footprint, Off-Take Profile, and Supply Chain Realities
Midwest Energy Limited operates as an industrial clean technology and critical equipment developer rather than a regulated power or gas utility. As a result, standard utility indicators—such as nameplate generation capacity, transmission mileage, retail rate base, or regulated fuel clauses—are non-existent across its operations (all reported at zero).
Segmental performance for FY26 highlights early revenue contributions from energy storage integration alongside pre-commercial development losses:
Table Segment Revenue Contribution, Asset Allocation, and Operating Profitability (FY2025–FY2026)
External revenues were divided geographically between India (INR 515.16 lakhs / 59.49%) and overseas markets (INR 350.75 lakhs / 40.51%). Consolidated accounts reveal extreme counterparty exposure: a single institutional customer generated 45.86% of total group turnover in FY26 (compared to 68.30% from one customer in FY25). Standalone accounts show an even higher concentration, with a single counterparty accounting for over 83% of total revenue. Out of gross trade receivables of INR 2,888.28 lakhs, the group established an Expected Credit Loss (ECL) allowance under Ind AS 109 of INR 403.16 lakhs, covering 100% of balances overdue beyond 180 days.
The Group's physical infrastructure footprint is concentrated across several key industrial sites:
* Boothpur Village, Mahbubnagar District, Telangana: 20 acres of industrial freehold land acquired in FY26 for INR 6,225.53 lakhs. This facility houses civil works and plant construction for NdPr metal reduction, NdFeB alloy powder preparation, and Sintered Permanent Magnet fabrication.
* Pashamylaram Village, Sangareddy District, Telangana: Mortgaged land securing term credit facilities issued by Aditya Birla Capital Limited (INR 749.29 lakhs outstanding).
* Krishnasagara Village, Anekal Taluk, Bengaluru, Karnataka: Freehold land pledged as corporate collateral to Canara Bank to secure bank guarantees and term debt for operating subsidiaries.
* Corporate Headquarters: Level 19, Wing A, Sky One, Prestige Skytech, Financial District, Nanakramguda, Hyderabad, Telangana.
The manufacturing supply chain remains exposed to foreign procurement. Foreign exchange outgo for capital plant purchases surged from INR 34.16 lakhs in FY25 to INR 1,948.63 lakhs in FY26, covering unhedged hardware commitments denominated in USD, EUR, AUD, CNY, and JPY. Management relies entirely on natural hedging via export sales rather than forward derivative contracts, leaving import costs vulnerable to Rupee depreciation.
HDIN Institutional Verdict
Midwest Energy Limited's transition represents a high-risk greenfield execution profile rather than a regulated clean energy utility play. Equity dilution remains the primary driver of corporate solvency, as management funded its FY26 cash burn of INR 32,828.92 lakhs by issuing INR 33,485.00 lakhs in preferential shares rather than relying on operational earnings.
Our forensic equity audit identifies four key vulnerabilities that qualify management's operational outlook:
1. Auditor Qualification on Capitalized R&D Assets: Statutory auditors issued a qualified audit opinion regarding INR 2,558.10 lakhs in Intangible Assets Under Development (IAUD). Management lacked verified technical feasibility documentation and continuous audit trail logs under Rule 11(g) to satisfy Ind AS 38 criteria. If these assets are disallowed upon project commissioning, equity reserves face an immediate write-down of up to INR 2,558.10 lakhs.
2. Unencumbered Liquidity Mismatch: While management highlights gross cash reserves of INR 21,963.53 lakhs, real unencumbered usable cash totals INR 17,885.62 lakhs. This reserve is offset by INR 10,232.53 lakhs in on-demand debt—including INR 5,100.00 lakhs in interest-free director advances. A call for repayment by related parties would deplete the cash cushion supporting the completion of the Mahbubnagar project.
3. Hidden Governance Costs and Off-Balance-Sheet Executive Remuneration: Corporate governance filings state that the company pays zero salary, bonuses, or stock compensation to its directors. However, Note 42 disclosures show that former Whole-Time Director Deepak Kukreti received INR 323.25 lakhs during FY26 under the classification of related-party professional and advisory charges (including INR 150.00 lakhs paid prior to the merger). Board turnover remains elevated following the simultaneous resignations of four directors on July 28, 2026.
4. Off-Balance-Sheet Guarantees and Hidden Profit Royalties: Beyond on-balance-sheet debt, Midwest Energy Limited holds contingent liabilities of INR 4,829.14 lakhs in corporate guarantees issued to Canara Bank on behalf of project subsidiaries, alongside INR 1,922.00 lakhs in guarantees issued to related entities. Furthermore, post-COD earnings will face margin leakage: the INR 6,100.00 lakhs TDB credit line carries a mandatory 1.0% profit royalty clause on commercial sales, and the US operations must deliver 60% of pre-tax cash flow to service its HERSC note.
With commercial revenue from Rare Earth Magnets standing at zero and customer concentration in transitional BESS trading standing at 45.86%, the group's economic outlook depends entirely on whether it can commission its Mahbubnagar and BESS manufacturing lines in FY 2026–27 without technical delays or additional balance-sheet dilution.
Presentation Download & Video Access
Presentation Download: Click the PDF download link under 'Related Topics' to access the full institutional presentation of this report.
Video Link: Click this link to watch the HDIN analyst briefing on YouTube.
About HDIN Research
HDIN Research is a global market intelligence and strategic advisory firm specializing in institutional-grade financial analysis, supply chain audits, and macroeconomic forecasting. Our dedicated sector analysts deliver actionable, data-driven insights tailored for private equity, hedge funds, and corporate strategy teams. Visit us at http://www.hdinresearch.com.
2026 AI Transparency Footer
This intelligence report was authored by HDIN Research analysts following a rigorous audit of official corporate filings. AI was utilized for massive-scale data synthesis and structural drafting, ensuring 100% inclusion of reported data points. All strategic insights, financial modeling, and final verdicts were verified by our editorial board to ensure professional accuracy and compliance with 2026 Google Search E-E-A-T standards.
1. Midwest Energy Limited pivoted from legacy natural stone operations toward greenfield Sintered NdFeB Rare Earth Magnets and BESS manufacturing, posting an FY26 consolidated net loss of INR 1,400.69 lakhs with an Operating Cash Flow deficit of INR 1,423.82 lakhs.
2. The Group accumulated INR 32,792.63 lakhs across non-earning assets—including INR 16,391.30 lakhs in CWIP and INR 6,225.53 lakhs in freehold land at Boothpur Village, Mahbubnagar, Telangana—leaving revenue delivery tied to an unproven FY 2026–27 COD target.
3. Balance sheet expansion to INR 71,395.51 lakhs relies on external capital, including INR 33,485.00 lakhs in gross preferential equity, INR 10,232.53 lakhs in on-demand borrowings, and INR 13,230.96 lakhs in zero-interest debt extended by corporate promoters and directors.
Figure Midwest Energy Limited (MEL) FY2025-26 Executive Research Blueprint
Financial Performance, Dupont Realities, and Pre-Commercial Capital BuildMidwest Energy Limited [BSE: 512485] (formerly Midwest Gold Limited) completed the amalgamation of Midwest Energy Private Limited, shifting operating activities from legacy granite processing and marble trading toward advanced clean technology components. Because primary production assets remained under construction as of March 31, 2026, reported revenue does not stem from commercial-scale magnet production.
Consolidated Operating Revenue expanded 1,016.15% year-over-year to INR 865.91 lakhs in FY26, compared to INR 77.58 lakhs in FY25. Cost of Goods Sold (COGS) fell 40.70% to INR 96.20 lakhs, lifting gross profit to INR 769.71 lakhs from a gross loss of INR 84.65 lakhs in FY25. However, corporate general overhead and pre-operative expenditures generated an EBITDA loss of INR 812.66 lakhs (compared to a loss of INR 389.25 lakhs in FY25) and an Adjusted EBIT loss of INR 1,141.16 lakhs (compared to a loss of INR 447.72 lakhs in FY25).
Total net loss for the year widened 104.83% to INR 1,400.69 lakhs, with the net loss attributable to equity owners reaching INR 1,260.76 lakhs. Total net loss attributable to non-controlling interests (NCI) stood at INR 139.93 lakhs, shifting NCI carrying equity to negative INR 124.09 lakhs.
Table Revenue Inflection, Margin Structure, and Profitability Deterioration (FY2025–FY2026)
| Financial Metric (INR Lakhs) | FY 2025–26 | FY 2024–25 | YoY Change (%) | Structural / Operational Source |
| Operating Revenue | 865.91 | 77.58 | +1,016.15% | BESS trading (INR 489.51 L) & Legacy stone/services (INR 376.40 L) |
| Cost of Goods Sold (COGS) | 96.20 | 162.23 | -40.70% | Raw materials consumed zero; legacy stone processing adjustment |
| Gross Profit / (Loss) | 769.71 | (84.65) | Turnaround | Margin expansion from inter-company tech advisory & pre-COD services |
| Gross Margin (%) | 88.89% | -109.11% | +19,800 bps | Calculated via Consolidated P&L Notes 25, 27–29 |
| EBITDA | (812.66) | (389.25) | -108.78% | Negative operational leverage during greenfield buildout |
| EBITDA Margin (%) | -93.85% | -501.74% | +40,789 bps | Consolidated P&L |
| Adjusted EBIT | (1,141.16) | (447.72) | -154.88% | Excludes inter-company finance income eliminated on consolidation |
| Adjusted EBIT Margin (%) | -131.79% | -577.11% | +44,532 bps | Consolidated P&L |
| Net Loss Attributable to Owners | (1,260.76) | (559.75) | -125.24% | Consolidated P&L Note 49 |
| Total Net Loss for the Period | (1,400.69) | (683.83) | -104.83% | Retained earnings deficit widened to negative INR 5,949.90 L |
| Net Profit Margin (%) | -161.76% | -881.45% | +71,969 bps | Note 49 Accounting Ratios |
| Return on Assets (ROA) - Average | -3.06% | -3.38% | +32 bps | Year-end ROA stood at -1.96% on assets of INR 71,395.51 L |
| Return on Equity (ROE) - Average | -5.77% | -7.84% | +207 bps | Year-end ROE stood at -3.52% on equity of INR 39,823.47 L |
| Return on Capital Employed (ROCE) | -3.61% | -2.95% | -66 bps | Year-end ROCE stood at -2.38% |
On a standalone basis, Midwest Energy Limited reported revenue of INR 3,199.21 lakhs in FY26 compared to INR 376.07 lakhs in FY25, delivering net profit of INR 279.59 lakhs versus a standalone net loss of INR 304.27 lakhs in FY25. This profitability stems from inter-company corporate guarantee charges, project management advisory fees, and interest income charged to project subsidiaries at 8.50% per annum (including INR 7,005.46 lakhs due from Midwest Advanced Materials Private Limited, INR 2,337.78 lakhs from Midwest Energy Devices Private Limited, and INR 918.53 lakhs from Christian Michelsen Energy Private Limited). These transactions were eliminated on consolidation.
DuPont decomposition highlights an asset turnover collapse characteristic of greenfield infrastructure execution. Total asset turnover fell to 0.019x on average assets (0.012x on period-end assets), alongside a net capital turnover ratio of 0.06x. The group asset base expanded 253.32% from INR 20,206.79 lakhs to INR 71,395.51 lakhs. Non-earning assets accounted for 45.93% of balance sheet deployment:
* Capital Work-in-Progress (CWIP): INR 16,391.30 lakhs (sintered magnet and alloy equipment lines).
* Capital Advances: INR 13,843.23 lakhs (including INR 5,191.41 lakhs paid to PPS Inviro Private Limited for uncompleted equity/debt allocations).
* Intangible Assets Under Development (IAUD): INR 2,558.10 lakhs (in-house metallurgy, magnets, and motor engineering).
* Operating Property, Plant & Equipment (PPE): INR 9,132.70 lakhs net book value, out of gross PPE of INR 9,567.44 lakhs (comprising INR 9,004.77 lakhs in freehold land, with ex-land operating plant, buildings, and legacy stone assets depreciated by 77.21%).
Financial leverage moderated at the holding company level despite absolute gross debt expanding 184.66% from INR 10,595.68 lakhs to INR 30,162.00 lakhs. Net equity proceeds of INR 32,477.98 lakhs from preferential allotments (INR 33,485.00 lakhs gross equity capital and premium raised) lifted consolidated equity by 356.28% from INR 8,727.85 lakhs to INR 39,823.47 lakhs. Consequently, the period-end equity multiplier declined from 2.32x to 1.79x (1.89x on average equity), lowering the consolidated Debt-to-Equity ratio from 1.21x to 0.76x.
Free Cash Flow (FCF) burn reached negative INR 32,828.92 lakhs in FY26, worsening 182.27% from negative INR 11,630.40 lakhs in FY24–25:
* Operating Cash Flow (OCF): Negative INR 1,423.82 lakhs (an improvement from negative INR 3,328.26 lakhs in FY25), driven by an operating loss before working capital changes of INR 934.89 lakhs, working capital consumption of INR 366.49 lakhs (inventory additions of INR 254.24 lakhs, trade payables reduction of INR 201.62 lakhs, offset by trade receivables collections of INR 89.37 lakhs), and direct income taxes paid of INR 122.45 lakhs.
* Growth CapEx Outflows: INR 31,405.10 lakhs, comprising INR 18,777.23 lakhs in cash purchases of PPE and CWIP, INR 811.82 lakhs in R&D capitalization under IAUD, and INR 11,816.05 lakhs in net capital advance disbursements. Sustaining CapEx remained at INR 0.00.
* Organic Reinvestment Rate: Zero percent (0.00%). Reinvestment was fully dependent on external funding, composed of INR 32,663.06 lakhs in net equity issuance and INR 19,323.23 lakhs in gross debt proceeds.
Consolidated gross debt of INR 30,162.00 lakhs carries a blended Weighted Average Cost of Debt (WACD) between 4.2% and 4.8%. This cost profile is subsidized by INR 13,230.96 lakhs (43.87% of gross borrowings) in zero-interest debt provided by company directors and related promoters.
Long-term borrowings reached INR 19,805.34 lakhs (compared to INR 7,720.11 lakhs in FY25), consisting of:
* Canara Bank Term Loan: INR 4,845.33 lakhs (linked to floating rates; INR 4,577.00 lakhs remains undrawn out of sanctioned limits).
* Financial Institution Term Loan (Aditya Birla Capital): INR 749.29 lakhs (secured against land at Pashamylaram Village, Sangareddy).
* Technology Development Board (TDB) Facility: INR 6,100.00 lakhs disbursed (floating linked; INR 6,300.00 lakhs undrawn out of INR 12,400.00 lakhs total sanction; subject to a 1.0% post-commercialization profit royalty).
* Midwest Limited (Promoter Entity): INR 1,347.00 lakhs in 9.0% Non-Cumulative Preference Shares.
* Deepak Kukreti (Director): INR 3,815.00 lakhs in interest-free long-term unsecured borrowings.
* HERSC Note Payable: INR 2,729.82 lakhs (held via US subsidiary National Solar Management LLC, carrying 0% interest and mandating 60% of pre-tax net cash flows toward principal service).
Current borrowings totaled INR 10,356.66 lakhs, comprising INR 2,164.56 lakhs under a Canara Bank overdraft facility, INR 5,100.00 lakhs in current unsecured director loans repayable on demand, INR 375.00 lakhs from promoters, and INR 2,592.97 lakhs from Midwest Limited (INR 1,211.14 lakhs interest-free pre-2013 legacy loans and INR 1,381.83 lakhs at 9% per annum, accruing INR 217.39 lakhs in annual interest expenses).
Contractual loan principal due within 12 months stood at INR 124.13 lakhs. Net debt totaled INR 8,198.47 lakhs against liquid cash reserves of INR 21,963.53 lakhs (INR 12,676.34 lakhs in unrestricted current accounts and INR 9,287.19 lakhs in term deposits). However, net usable liquidity is constrained: INR 4,077.91 lakhs in term deposits is legally encumbered under bank liens, reducing unencumbered cash cushions to INR 17,885.62 lakhs. Floating debt exposures account for 51.61% of borrowings (INR 15,567.86 lakhs), while fixed or zero-rate borrowings represent 48.39% (INR 14,594.14 lakhs). With operating EBITDA negative at INR 812.66 lakhs, Interest Coverage Ratio (Adjusted EBIT / Finance Costs) settled at negative 4.40x against finance costs of INR 259.53 lakhs, alongside a Debt Service Coverage Ratio (DSCR) of negative 4.13x.
Operating Footprint, Off-Take Profile, and Supply Chain Realities
Midwest Energy Limited operates as an industrial clean technology and critical equipment developer rather than a regulated power or gas utility. As a result, standard utility indicators—such as nameplate generation capacity, transmission mileage, retail rate base, or regulated fuel clauses—are non-existent across its operations (all reported at zero).
Segmental performance for FY26 highlights early revenue contributions from energy storage integration alongside pre-commercial development losses:
Table Segment Revenue Contribution, Asset Allocation, and Operating Profitability (FY2025–FY2026)
| Operating Segment | Gross Revenue (INR L) | Inter-Segment Eliminations | Net External Revenue (INR L) | Net Revenue Share (%) | Segment EBIT (INR L) | Segment Assets (INR L) | Asset Share (%) |
| Rare-Earth Materials & Magnets | 0.00 | 0.00 | 0.00 | 0.00% | (63.62) | 22,091.68 | 30.94% |
| Renewable Energy & Storage (BESS) | 2,525.90 | 2,036.39 | 489.51 | 56.53% | (218.60) | 48,848.53 | 68.42% |
| Others (Granite, Marble & Advisory) | 376.40 | 0.00 | 376.40 | 43.47% | (504.40) | 455.30 | 0.64% |
| Unallocated Corporate Cost | — | — | — | — | (285.58) | — | — |
| Consolidated Operating Totals | 2,902.30 | 2,036.39 | 865.91 | 100.00% | (1,072.20) | 71,395.51 | 100.00% |
External revenues were divided geographically between India (INR 515.16 lakhs / 59.49%) and overseas markets (INR 350.75 lakhs / 40.51%). Consolidated accounts reveal extreme counterparty exposure: a single institutional customer generated 45.86% of total group turnover in FY26 (compared to 68.30% from one customer in FY25). Standalone accounts show an even higher concentration, with a single counterparty accounting for over 83% of total revenue. Out of gross trade receivables of INR 2,888.28 lakhs, the group established an Expected Credit Loss (ECL) allowance under Ind AS 109 of INR 403.16 lakhs, covering 100% of balances overdue beyond 180 days.
The Group's physical infrastructure footprint is concentrated across several key industrial sites:
* Boothpur Village, Mahbubnagar District, Telangana: 20 acres of industrial freehold land acquired in FY26 for INR 6,225.53 lakhs. This facility houses civil works and plant construction for NdPr metal reduction, NdFeB alloy powder preparation, and Sintered Permanent Magnet fabrication.
* Pashamylaram Village, Sangareddy District, Telangana: Mortgaged land securing term credit facilities issued by Aditya Birla Capital Limited (INR 749.29 lakhs outstanding).
* Krishnasagara Village, Anekal Taluk, Bengaluru, Karnataka: Freehold land pledged as corporate collateral to Canara Bank to secure bank guarantees and term debt for operating subsidiaries.
* Corporate Headquarters: Level 19, Wing A, Sky One, Prestige Skytech, Financial District, Nanakramguda, Hyderabad, Telangana.
The manufacturing supply chain remains exposed to foreign procurement. Foreign exchange outgo for capital plant purchases surged from INR 34.16 lakhs in FY25 to INR 1,948.63 lakhs in FY26, covering unhedged hardware commitments denominated in USD, EUR, AUD, CNY, and JPY. Management relies entirely on natural hedging via export sales rather than forward derivative contracts, leaving import costs vulnerable to Rupee depreciation.
HDIN Institutional Verdict
Midwest Energy Limited's transition represents a high-risk greenfield execution profile rather than a regulated clean energy utility play. Equity dilution remains the primary driver of corporate solvency, as management funded its FY26 cash burn of INR 32,828.92 lakhs by issuing INR 33,485.00 lakhs in preferential shares rather than relying on operational earnings.
Our forensic equity audit identifies four key vulnerabilities that qualify management's operational outlook:
1. Auditor Qualification on Capitalized R&D Assets: Statutory auditors issued a qualified audit opinion regarding INR 2,558.10 lakhs in Intangible Assets Under Development (IAUD). Management lacked verified technical feasibility documentation and continuous audit trail logs under Rule 11(g) to satisfy Ind AS 38 criteria. If these assets are disallowed upon project commissioning, equity reserves face an immediate write-down of up to INR 2,558.10 lakhs.
2. Unencumbered Liquidity Mismatch: While management highlights gross cash reserves of INR 21,963.53 lakhs, real unencumbered usable cash totals INR 17,885.62 lakhs. This reserve is offset by INR 10,232.53 lakhs in on-demand debt—including INR 5,100.00 lakhs in interest-free director advances. A call for repayment by related parties would deplete the cash cushion supporting the completion of the Mahbubnagar project.
3. Hidden Governance Costs and Off-Balance-Sheet Executive Remuneration: Corporate governance filings state that the company pays zero salary, bonuses, or stock compensation to its directors. However, Note 42 disclosures show that former Whole-Time Director Deepak Kukreti received INR 323.25 lakhs during FY26 under the classification of related-party professional and advisory charges (including INR 150.00 lakhs paid prior to the merger). Board turnover remains elevated following the simultaneous resignations of four directors on July 28, 2026.
4. Off-Balance-Sheet Guarantees and Hidden Profit Royalties: Beyond on-balance-sheet debt, Midwest Energy Limited holds contingent liabilities of INR 4,829.14 lakhs in corporate guarantees issued to Canara Bank on behalf of project subsidiaries, alongside INR 1,922.00 lakhs in guarantees issued to related entities. Furthermore, post-COD earnings will face margin leakage: the INR 6,100.00 lakhs TDB credit line carries a mandatory 1.0% profit royalty clause on commercial sales, and the US operations must deliver 60% of pre-tax cash flow to service its HERSC note.
With commercial revenue from Rare Earth Magnets standing at zero and customer concentration in transitional BESS trading standing at 45.86%, the group's economic outlook depends entirely on whether it can commission its Mahbubnagar and BESS manufacturing lines in FY 2026–27 without technical delays or additional balance-sheet dilution.
Presentation Download & Video Access
Presentation Download: Click the PDF download link under 'Related Topics' to access the full institutional presentation of this report.
Video Link: Click this link to watch the HDIN analyst briefing on YouTube.
About HDIN Research
HDIN Research is a global market intelligence and strategic advisory firm specializing in institutional-grade financial analysis, supply chain audits, and macroeconomic forecasting. Our dedicated sector analysts deliver actionable, data-driven insights tailored for private equity, hedge funds, and corporate strategy teams. Visit us at http://www.hdinresearch.com.
2026 AI Transparency Footer
This intelligence report was authored by HDIN Research analysts following a rigorous audit of official corporate filings. AI was utilized for massive-scale data synthesis and structural drafting, ensuring 100% inclusion of reported data points. All strategic insights, financial modeling, and final verdicts were verified by our editorial board to ensure professional accuracy and compliance with 2026 Google Search E-E-A-T standards.