Kody Technolab Limited: Physical AI Pivot Masks Operating Cash Deficit and Working Capital Lockup Near Gujarat Facility
Date : 2026-09-14
Reading : 159
HDIN Executive Takeaways
1. Kody Technolab Limited [NSE: KODYTECH] reported standalone FY26 revenue of ₹8,401.17 Lakhs ($9.64M USD), up 17.05% YoY, but generated a cash-flow-to-PAT conversion ratio of just 0.18x ($457,000 USD Operating Cash Flow against $2,508,411 USD PAT).
2. Physical assets shifted toward Gujarat with an upcoming 200,000 sq. ft. plant targeting 12,000 units/month, while an 18.75% equity stake in World EMS Pvt Ltd (₹3,750.00 Lakhs) anchors localized hardware assembly.
3. Institutional risk centers on working capital: 70.57% of trade receivables are aged over six months with zero credit loss provisions, while off-balance-sheet shareholder meeting authorizations for related parties exceed ₹1,300 Crore ($149M USD).
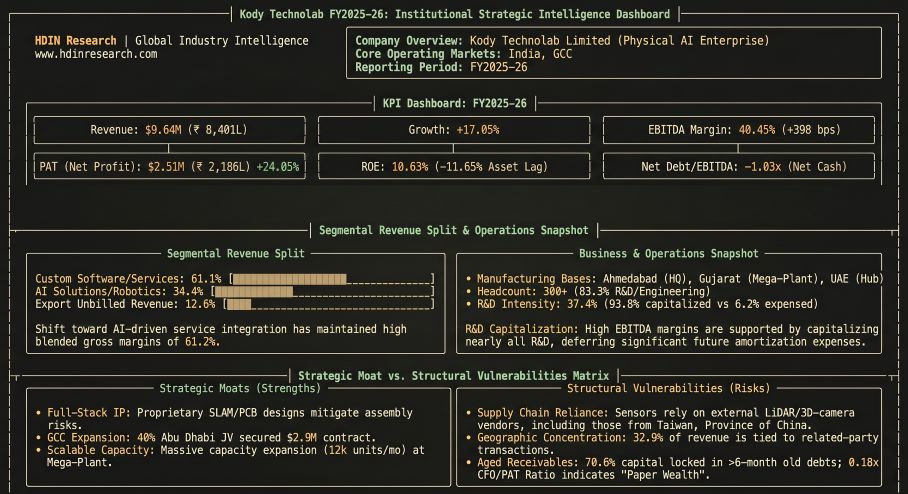
Figure Kody Technolab FY2025-26 Institutional Strategic Intelligence Dashboard
 Segmental Realities, Earnings Adjustments, and Balance Sheet Expansion
Kody Technolab Limited transitioned its core revenue profile from enterprise software to hardware and embodied artificial intelligence systems. For the fiscal year ended March 31, 2026, standalone top-line revenue expanded 17.05% YoY to ₹8,401.17 Lakhs ($9,640,251 USD), while consolidated revenue reached ₹8,028.18 Lakhs ($9,212,249 USD). Operating profitability diverged sharply between legal entities: standalone profit after tax (PAT) rose 24.05% YoY to ₹2,186.00 Lakhs ($2,508,411 USD), whereas consolidated PAT declined 4.88% YoY to ₹1,676.26 Lakhs ($1,923,490 USD), impacted by overseas corporate structures and an equity-accounted loss of ₹140.64 Lakhs ($161,383 USD) from Middle East joint venture Falcon Tech Robotics LLC.
Under Indian Accounting Standard (AS) 11 and AS-17 disclosures, revenue shifted regionally and across product classifications. Domestic hardware delivery expanded from ₹12.81 Lakhs ($14,700 USD) in FY25 to ₹1,452.05 Lakhs ($1,666,211 USD) in FY26 (+11,235.28%), while export hardware dropped 59.27% to ₹1,440.58 Lakhs ($1,653,049 USD). Blended standalone gross margins compressed by 327 basis points (bps) YoY from 64.44% to 61.17%, driven by a 27.81% increase in raw material and component procurement costs, totaling ₹3,262.39 Lakhs ($3,743,557 USD).
Table Revenue Growth, Margin Expansion, and Profitability Performance (FY2025–FY2026)
A forensic audit of capitalization schedules under AS-26 reveals significant moisture in reported margins. Standalone R&D expenditure amounted to ₹3,139.52 Lakhs ($3,602,565 USD), or 37.37% of revenue. The company capitalized 93.79% of these outlays (₹2,944.53 Lakhs / $3,378,817 USD), routing ₹1,606.53 Lakhs into "Intangible Assets under Development" and ₹1,338.00 Lakhs into software platforms, while expensing only 6.21% through the P&L.
Under a standardized research adjustment (Scenario A: expensing Intangible Assets under Development of ₹1,606.53 Lakhs):
* Adjusted EBITDA falls from ₹3,398.40 Lakhs ($3,899,627 USD) to ₹1,791.87 Lakhs ($2,056,151 USD), compressing the true EBITDA margin by 1,912 bps to 21.33%.
* Adjusted Standalone PAT drops from ₹2,186.00 Lakhs ($2,508,411 USD) to ₹1,082.66 Lakhs ($1,242,341 USD), reducing the net margin to 12.89%.
* Adjusted Consolidated PAT drops to ₹686.27 Lakhs ($787,485 USD), bringing consolidated net margins down from 20.88% to 8.55%.
Table Revenue Growth, Margin Expansion, and Profitability Performance (FY2025–FY2026)
Balance sheet accounts expanded as equity injections absorbed working capital strain. Total assets climbed 116.01% from ₹11,170.83 Lakhs ($12.82M USD) to ₹24,130.63 Lakhs ($27.70M USD). Equity surged 159.85% to ₹20,556.08 Lakhs ($23.59M USD), supported by ₹11,089.94 Lakhs ($12.73M USD) in securities premium via 6,96,000 warrant conversions and 1,53,900 preferential allotments. Consequently, DuPont analysis illustrates that standalone Return on Equity (ROE) contracted 1,165 bps from 22.28% to 10.63%, driven by asset turnover collapsing from 0.6423x to 0.3481x (-45.80%) and financial leverage (equity multiplier) receding from 1.4125x to 1.1742x (-16.87%). Short-term borrowings dropped 93.25% from ₹1,306.00 Lakhs to ₹88.10 Lakhs following the liquidation of export packing credits (₹943.15 Lakhs) and Kotak Mahindra overdrafts (₹269.31 Lakhs). Net debt/EBITDA stands at -1.03x standalone, supported by cash reserves of ₹4,258.22 Lakhs ($4,886,261 USD).
Working capital accounts absorbed severe liquidity. Operating cash flows (CFO) reached ₹398.26 Lakhs ($457,000 USD) against reported PAT of ₹2,186.00 Lakhs, establishing a CFO/PAT ratio of 0.18x. Consolidated free cash flow dropped to -₹5,315.86 Lakhs (-$6,099,891 USD) against CapEx outlays of ₹6,474.41 Lakhs ($7,429,295 USD). Receivables under Note 17 total ₹3,975.23 Lakhs ($4.56M USD), with Days Sales Outstanding (DSO) at 172.71 days. Note 19 assets surged 1,066.49% to ₹3,687.39 Lakhs ($4,231,239 USD), reflecting ₹2,146.51 Lakhs ($2.46M USD) in component procurement advances and ₹1,054.06 Lakhs ($1.21M USD) in unbilled milestone contracts.
Table Working Capital Efficiency, Cash Conversion, and Customer Funding Dynamics (FY2025–FY2026)
Infrastructure Layout, Strategic Hubs, and Supply Chain Moats
Kody Technolab operates an integrated engineering and delivery footprint linking domestic assembly lines with Middle Eastern distribution channels. The corporate headquarters and core R&D delivery facility occupy the 2nd Floor, Block-J, Safal Mondeal Retail Park, Bodakdev, Ahmedabad, Gujarat. Engineering operations employ 250+ dedicated systems engineers across an on-roll base of 156 employees and total human capital exceeding 300 individuals (including contractors and specialized technicians). Revenue per on-roll employee stands at ₹53.85 Lakhs ($61,796 USD), while average employee remuneration climbed 30.77%, offset by a 22.05% contraction in median compensation due to entry-level software hiring and ₹52.95 Lakhs in engineering intern stipends.
Manufacturing relies on an alliance architecture. The primary production and co-engineering site operates through World EMS Pvt Ltd in Gujarat, in which Kody Technolab holds an 18.75% equity interest secured for ₹3,750.00 Lakhs ($4,303,088 USD). This baseline facility maintains an operational throughput of approximately 200 robots per month (2,400 units annually). To support long-term volume targets, the company commenced construction of a 200,000 sq. ft. automated manufacturing facility in Gujarat, engineered to scale to 12,000 units per month based on confirmed client drawdowns.
The commercial fleet encompasses nine proprietary form factors:
* Odigo: Dual-display indoor service and programmatic digital-out-of-home (pDOOH) navigation platform.
* Vulcan: Autonomous heavy-duty commercial floor scrubber.
* Spilot: Industrial Autonomous Mobile Robot (AMR) with 600 kg payload capacity.
* Forkon: Heavy autonomous forklift engineered for 1,500 kg industrial movement.
* Medigo, Kidigo, Femigo: Clinical and diagnostic screening robots deployed in partnership with UAE-based Sccore AI Tech Diagnostic Limited.
* Dasher, Popper, Skanda, FRT-737: Hospitality delivery, retail interaction, bipedal humanoid, and security surveillance units.
Domestic deployments completed 84,244.83 autonomous kilometers, logged 90,324.36 active display hours, and completed 638,637 store escort trips. In international operations, Middle Eastern penetration is managed via Falcon Tech Robotics LLC (a 40% joint venture incorporated in Abu Dhabi with the Platinum Group) and Kody Middle East Holding LLC-FZ (a 75% subsidiary in Dubai holding ₹2,104.96 Lakhs / $2.42M USD in assets). The Falcon Tech JV executed a ₹2,553 Lakhs ($2.93M USD) multi-unit deployment contract, supporting commercial implementations across Etihad Rail stations and regional retail operators.
HDIN Institutional Verdict
Management presents Kody Technolab Limited as a high-margin deeptech pioneer scaling across 9 commercial verticals. An operational audit of the disclosures reveals structural frictions between headline figures and underlying cash cycles.
The central institutional concern is trade receivable credit quality. Standalone receivables stand at ₹3,975.23 Lakhs ($4,561,533 USD), of which ₹2,805.36 Lakhs ($3,219,121 USD)—or 70.57%—exceeds six months in aging.
Table Receivable Aging, Credit Risk Exposure, and Forensic Impairment Sensitivity (FY2025–FY2026)
Management booked a Provision for Doubtful Debts of ₹0.00 (0.00% Expected Credit Loss), classifying 100% of these open accounts as "Undisputed - Considered Good." Under standard institutional ECL calibration (1% for <6M, 10% for 6M-1Y, 30% for 1-2Y, and 50% for 2-3Y), recommended write-downs total ₹296.47 Lakhs ($340,184 USD) standalone and ₹298.93 Lakhs ($343,010 USD) consolidated, eroding standalone PAT by 13.56% and consolidated PAT by 17.83%.
Governance and related-party circularity introduce further analytical risk. Related-party transactions account for 32.85% of standalone FY26 revenue (₹2,759.59 Lakhs / $3,166,599 USD), led by shipments to Falcon Tech Robotics LLC (₹1,335.99 Lakhs) and subsidiary Kody Media Pvt Ltd (₹773.45 Lakhs). In the 9th Annual General Meeting (AGM) notice, management disclosed that "No bids or quotations were invited or received" from independent third parties for these operational loops.
The AGM approvals grant management authorization to advance loans, supply guarantees, and trade with related entities up to ₹1,300 Crore ($149M USD)—surpassing the company's standalone net asset base of ₹20,556.08 Lakhs ($23.59M USD). Simultaneously, the CFO position was vacated by Niraj Sanghvi in October 2025 and assumed by Akshay C Shah in January 2026, while the Company Secretary post changed hands twice within twelve months.
Operational currency exposures remain unhedged. Under Note 2.8, the company holds no derivative instruments, forward contracts, or interest rate swaps to insulate export balances. Foreign exchange fluctuations generated ₹557.54 Lakhs ($639,771 USD) in other income during FY26, comprising 18.12% of standalone PBT. A 5% appreciation of the Indian Rupee against the US Dollar would directly erase ~₹27.88 Lakhs from net operating earnings.
Furthermore, the capitalization of ₹3,239.41 Lakhs in intangible assets under development will drive significant amortization headwinds under AS-26 WDV methodology (3-year software, 5-year platform schedules), creating annual non-cash depreciation charges of ₹800–₹1,000 Lakhs starting in FY27. Pending resolution of ₹111.16 Lakhs in disputed tax claims (₹75.22 Lakhs Income Tax, ₹35.94 Lakhs GST) and validation of cash collection for the ₹1,054.06 Lakhs in unbilled Middle Eastern revenue, the market valuation warrants an analytical risk haircut on reported earnings.
Presentation Download & Video Access:
- Presentation Download: Click the PDF download link under 'Related Topics' to access the full institutional presentation of this report.
- Video Link: Click this link to watch the HDIN analyst briefing on YouTube.
About HDIN Research:
HDIN Research is a premier global market intelligence and strategic advisory firm specializing in institutional-grade financial analysis, supply chain audits, and macroeconomic forecasting. Our dedicated sector analysts deliver actionable, data-driven insights tailored for private equity, hedge funds, and corporate strategy teams. Visit us at http://www.hdinresearch.com.
2026 AI Transparency Footer:
This intelligence report was authored by HDIN Research analysts following a rigorous audit of official corporate filings. AI was utilized for massive-scale data synthesis and structural drafting, ensuring 100% inclusion of reported data points. All strategic insights, financial modeling, and final verdicts were verified by our editorial board to ensure professional accuracy and compliance with 2026 Google Search E-E-A-T standards.
1. Kody Technolab Limited [NSE: KODYTECH] reported standalone FY26 revenue of ₹8,401.17 Lakhs ($9.64M USD), up 17.05% YoY, but generated a cash-flow-to-PAT conversion ratio of just 0.18x ($457,000 USD Operating Cash Flow against $2,508,411 USD PAT).
2. Physical assets shifted toward Gujarat with an upcoming 200,000 sq. ft. plant targeting 12,000 units/month, while an 18.75% equity stake in World EMS Pvt Ltd (₹3,750.00 Lakhs) anchors localized hardware assembly.
3. Institutional risk centers on working capital: 70.57% of trade receivables are aged over six months with zero credit loss provisions, while off-balance-sheet shareholder meeting authorizations for related parties exceed ₹1,300 Crore ($149M USD).
Figure Kody Technolab FY2025-26 Institutional Strategic Intelligence Dashboard
Segmental Realities, Earnings Adjustments, and Balance Sheet ExpansionKody Technolab Limited transitioned its core revenue profile from enterprise software to hardware and embodied artificial intelligence systems. For the fiscal year ended March 31, 2026, standalone top-line revenue expanded 17.05% YoY to ₹8,401.17 Lakhs ($9,640,251 USD), while consolidated revenue reached ₹8,028.18 Lakhs ($9,212,249 USD). Operating profitability diverged sharply between legal entities: standalone profit after tax (PAT) rose 24.05% YoY to ₹2,186.00 Lakhs ($2,508,411 USD), whereas consolidated PAT declined 4.88% YoY to ₹1,676.26 Lakhs ($1,923,490 USD), impacted by overseas corporate structures and an equity-accounted loss of ₹140.64 Lakhs ($161,383 USD) from Middle East joint venture Falcon Tech Robotics LLC.
Under Indian Accounting Standard (AS) 11 and AS-17 disclosures, revenue shifted regionally and across product classifications. Domestic hardware delivery expanded from ₹12.81 Lakhs ($14,700 USD) in FY25 to ₹1,452.05 Lakhs ($1,666,211 USD) in FY26 (+11,235.28%), while export hardware dropped 59.27% to ₹1,440.58 Lakhs ($1,653,049 USD). Blended standalone gross margins compressed by 327 basis points (bps) YoY from 64.44% to 61.17%, driven by a 27.81% increase in raw material and component procurement costs, totaling ₹3,262.39 Lakhs ($3,743,557 USD).
Table Revenue Growth, Margin Expansion, and Profitability Performance (FY2025–FY2026)
| Financial Metric (Standalone) | FY 2024–25 (₹ Lakhs) | FY 2024–25 (USD) | FY 2025–26 (₹ Lakhs) | FY 2025–26 (USD) | YoY Shift (% / bps) |
| Revenue from Operations | ₹7,177.18 | $8,235,736 | ₹8,401.17 | $9,640,251 | +17.05% |
| Other Income | ₹125.13 | $143,585 | ₹647.18 | $742,630 | +417.21% |
| Cost of Goods Sold (COGS) | ₹2,552.48 | $2,928,943 | ₹3,262.39 | $3,743,557 | +27.81% |
| Gross Profit | ₹4,624.70 | $5,306,792 | ₹5,138.78 | $5,896,694 | +11.12% |
| Gross Margin (%) | 64.44% | 64.44% | 61.17% | 61.17% | -327 bps |
| EBITDA | ₹2,617.61 | $3,003,690 | ₹3,398.40 | $3,899,627 | +29.83% |
| EBITDA Margin (%) | 36.47% | 36.47% | 40.45% | 40.45% | +398 bps |
| EBIT | ₹2,476.90 | $2,842,227 | ₹3,156.20 | $3,621,705 | +27.42% |
| Profit Before Tax (PBT) | ₹2,393.30 | $2,746,286 | ₹3,077.68 | $3,531,564 | +28.60% |
| Profit After Tax (PAT) | ₹1,762.24 | $2,022,151 | ₹2,186.00 | $2,508,411 | +24.05% |
| Net Profit Margin (%) | 24.55% | 24.55% | 26.02% | 26.02% | +147 bps |
A forensic audit of capitalization schedules under AS-26 reveals significant moisture in reported margins. Standalone R&D expenditure amounted to ₹3,139.52 Lakhs ($3,602,565 USD), or 37.37% of revenue. The company capitalized 93.79% of these outlays (₹2,944.53 Lakhs / $3,378,817 USD), routing ₹1,606.53 Lakhs into "Intangible Assets under Development" and ₹1,338.00 Lakhs into software platforms, while expensing only 6.21% through the P&L.
Under a standardized research adjustment (Scenario A: expensing Intangible Assets under Development of ₹1,606.53 Lakhs):
* Adjusted EBITDA falls from ₹3,398.40 Lakhs ($3,899,627 USD) to ₹1,791.87 Lakhs ($2,056,151 USD), compressing the true EBITDA margin by 1,912 bps to 21.33%.
* Adjusted Standalone PAT drops from ₹2,186.00 Lakhs ($2,508,411 USD) to ₹1,082.66 Lakhs ($1,242,341 USD), reducing the net margin to 12.89%.
* Adjusted Consolidated PAT drops to ₹686.27 Lakhs ($787,485 USD), bringing consolidated net margins down from 20.88% to 8.55%.
Table Revenue Growth, Margin Expansion, and Profitability Performance (FY2025–FY2026)
| Line-Item Capitalization Profile (Standalone) | Stated Accounting (₹ Lakhs) | Stated Accounting (USD) | Scenario A Adjusted (₹ Lakhs) | Scenario A Adjusted (USD) | Adjusted Variance (%) |
| Standalone Revenue | ₹8,401.17 | $9,640,251 | ₹8,401.17 | $9,640,251 | 0.00% |
| Reported vs. Adjusted EBITDA | ₹3,398.40 | $3,899,627 | ₹1,791.87 | $2,056,151 | -47.27% |
| EBITDA Margin (%) | 40.45% | 40.45% | 21.33% | 21.33% | -1,912 bps |
| Reported vs. Adjusted EBIT | ₹3,156.20 | $3,621,705 | ₹1,549.67 | $1,778,229 | -50.90% |
| Reported vs. Adjusted PBT | ₹3,077.68 | $3,531,564 | ₹1,471.15 | $1,688,129 | -52.20% |
| Reported vs. Adjusted PAT | ₹2,186.00 | $2,508,411 | ₹1,082.66 | $1,242,341 | -50.47% |
| Net Margin (%) | 26.02% | 26.02% | 12.89% | 12.89% | -1,313 bps |
Balance sheet accounts expanded as equity injections absorbed working capital strain. Total assets climbed 116.01% from ₹11,170.83 Lakhs ($12.82M USD) to ₹24,130.63 Lakhs ($27.70M USD). Equity surged 159.85% to ₹20,556.08 Lakhs ($23.59M USD), supported by ₹11,089.94 Lakhs ($12.73M USD) in securities premium via 6,96,000 warrant conversions and 1,53,900 preferential allotments. Consequently, DuPont analysis illustrates that standalone Return on Equity (ROE) contracted 1,165 bps from 22.28% to 10.63%, driven by asset turnover collapsing from 0.6423x to 0.3481x (-45.80%) and financial leverage (equity multiplier) receding from 1.4125x to 1.1742x (-16.87%). Short-term borrowings dropped 93.25% from ₹1,306.00 Lakhs to ₹88.10 Lakhs following the liquidation of export packing credits (₹943.15 Lakhs) and Kotak Mahindra overdrafts (₹269.31 Lakhs). Net debt/EBITDA stands at -1.03x standalone, supported by cash reserves of ₹4,258.22 Lakhs ($4,886,261 USD).
Working capital accounts absorbed severe liquidity. Operating cash flows (CFO) reached ₹398.26 Lakhs ($457,000 USD) against reported PAT of ₹2,186.00 Lakhs, establishing a CFO/PAT ratio of 0.18x. Consolidated free cash flow dropped to -₹5,315.86 Lakhs (-$6,099,891 USD) against CapEx outlays of ₹6,474.41 Lakhs ($7,429,295 USD). Receivables under Note 17 total ₹3,975.23 Lakhs ($4.56M USD), with Days Sales Outstanding (DSO) at 172.71 days. Note 19 assets surged 1,066.49% to ₹3,687.39 Lakhs ($4,231,239 USD), reflecting ₹2,146.51 Lakhs ($2.46M USD) in component procurement advances and ₹1,054.06 Lakhs ($1.21M USD) in unbilled milestone contracts.
Table Working Capital Efficiency, Cash Conversion, and Customer Funding Dynamics (FY2025–FY2026)
| Operational Working Capital Metrics | Standalone FY 2024–25 | Standalone FY 2025–26 | YoY Delta (Days / %) |
| Days Sales Outstanding (DSO) | 176.90 Days | 172.71 Days | -4.19 Days |
| Days Inventory Outstanding (DIO) | 95.34 Days | 39.14 Days | -56.20 Days |
| Days Payables Outstanding (DPO) | 158.72 Days | 140.22 Days | -18.50 Days |
| Cash Conversion Cycle (CCC) | 113.52 Days | 71.64 Days | -41.88 Days |
| Other Current Assets (Note 19) | ₹316.11 Lakhs | ₹3,687.39 Lakhs | +1,066.49% |
| Customer Advances (Note 10) | ₹4.18 Lakhs | ₹578.92 Lakhs | +13,749.76% |
Infrastructure Layout, Strategic Hubs, and Supply Chain Moats
Kody Technolab operates an integrated engineering and delivery footprint linking domestic assembly lines with Middle Eastern distribution channels. The corporate headquarters and core R&D delivery facility occupy the 2nd Floor, Block-J, Safal Mondeal Retail Park, Bodakdev, Ahmedabad, Gujarat. Engineering operations employ 250+ dedicated systems engineers across an on-roll base of 156 employees and total human capital exceeding 300 individuals (including contractors and specialized technicians). Revenue per on-roll employee stands at ₹53.85 Lakhs ($61,796 USD), while average employee remuneration climbed 30.77%, offset by a 22.05% contraction in median compensation due to entry-level software hiring and ₹52.95 Lakhs in engineering intern stipends.
Manufacturing relies on an alliance architecture. The primary production and co-engineering site operates through World EMS Pvt Ltd in Gujarat, in which Kody Technolab holds an 18.75% equity interest secured for ₹3,750.00 Lakhs ($4,303,088 USD). This baseline facility maintains an operational throughput of approximately 200 robots per month (2,400 units annually). To support long-term volume targets, the company commenced construction of a 200,000 sq. ft. automated manufacturing facility in Gujarat, engineered to scale to 12,000 units per month based on confirmed client drawdowns.
The commercial fleet encompasses nine proprietary form factors:
* Odigo: Dual-display indoor service and programmatic digital-out-of-home (pDOOH) navigation platform.
* Vulcan: Autonomous heavy-duty commercial floor scrubber.
* Spilot: Industrial Autonomous Mobile Robot (AMR) with 600 kg payload capacity.
* Forkon: Heavy autonomous forklift engineered for 1,500 kg industrial movement.
* Medigo, Kidigo, Femigo: Clinical and diagnostic screening robots deployed in partnership with UAE-based Sccore AI Tech Diagnostic Limited.
* Dasher, Popper, Skanda, FRT-737: Hospitality delivery, retail interaction, bipedal humanoid, and security surveillance units.
Domestic deployments completed 84,244.83 autonomous kilometers, logged 90,324.36 active display hours, and completed 638,637 store escort trips. In international operations, Middle Eastern penetration is managed via Falcon Tech Robotics LLC (a 40% joint venture incorporated in Abu Dhabi with the Platinum Group) and Kody Middle East Holding LLC-FZ (a 75% subsidiary in Dubai holding ₹2,104.96 Lakhs / $2.42M USD in assets). The Falcon Tech JV executed a ₹2,553 Lakhs ($2.93M USD) multi-unit deployment contract, supporting commercial implementations across Etihad Rail stations and regional retail operators.
HDIN Institutional Verdict
Management presents Kody Technolab Limited as a high-margin deeptech pioneer scaling across 9 commercial verticals. An operational audit of the disclosures reveals structural frictions between headline figures and underlying cash cycles.
The central institutional concern is trade receivable credit quality. Standalone receivables stand at ₹3,975.23 Lakhs ($4,561,533 USD), of which ₹2,805.36 Lakhs ($3,219,121 USD)—or 70.57%—exceeds six months in aging.
Table Receivable Aging, Credit Risk Exposure, and Forensic Impairment Sensitivity (FY2025–FY2026)
| Standalone Receivable Aging Analysis | Book Balance (₹ Lakhs) | Book Balance (USD) | Aging Share (%) | Expected Credit Loss (%) | Forensic Impairment (₹ Lakhs) | Forensic Impairment (USD) |
| < 6 Months | ₹1,169.86 | $1,342,394 | 29.43% | 1.00% | ₹11.70 | $13,424 |
| 6 Months to 1 Year | ₹2,794.09 | $3,206,188 | 70.29% | 10.00% | ₹279.41 | $320,619 |
| 1 Year to 2 Years | ₹1.42 | $1,630 | 0.04% | 30.00% | ₹0.43 | $489 |
| 2 Years to 3 Years | ₹9.85 | $11,303 | 0.25% | 50.00% | ₹4.93 | $5,652 |
| > 3 Years | ₹0.00 | $0 | 0.00% | 100.00% | ₹0.00 | $0 |
| Total Standalone Receivables | ₹3,975.23 | $4,561,533 | 100.00% | — | ₹296.47 | $340,184 |
Management booked a Provision for Doubtful Debts of ₹0.00 (0.00% Expected Credit Loss), classifying 100% of these open accounts as "Undisputed - Considered Good." Under standard institutional ECL calibration (1% for <6M, 10% for 6M-1Y, 30% for 1-2Y, and 50% for 2-3Y), recommended write-downs total ₹296.47 Lakhs ($340,184 USD) standalone and ₹298.93 Lakhs ($343,010 USD) consolidated, eroding standalone PAT by 13.56% and consolidated PAT by 17.83%.
Governance and related-party circularity introduce further analytical risk. Related-party transactions account for 32.85% of standalone FY26 revenue (₹2,759.59 Lakhs / $3,166,599 USD), led by shipments to Falcon Tech Robotics LLC (₹1,335.99 Lakhs) and subsidiary Kody Media Pvt Ltd (₹773.45 Lakhs). In the 9th Annual General Meeting (AGM) notice, management disclosed that "No bids or quotations were invited or received" from independent third parties for these operational loops.
The AGM approvals grant management authorization to advance loans, supply guarantees, and trade with related entities up to ₹1,300 Crore ($149M USD)—surpassing the company's standalone net asset base of ₹20,556.08 Lakhs ($23.59M USD). Simultaneously, the CFO position was vacated by Niraj Sanghvi in October 2025 and assumed by Akshay C Shah in January 2026, while the Company Secretary post changed hands twice within twelve months.
Operational currency exposures remain unhedged. Under Note 2.8, the company holds no derivative instruments, forward contracts, or interest rate swaps to insulate export balances. Foreign exchange fluctuations generated ₹557.54 Lakhs ($639,771 USD) in other income during FY26, comprising 18.12% of standalone PBT. A 5% appreciation of the Indian Rupee against the US Dollar would directly erase ~₹27.88 Lakhs from net operating earnings.
Furthermore, the capitalization of ₹3,239.41 Lakhs in intangible assets under development will drive significant amortization headwinds under AS-26 WDV methodology (3-year software, 5-year platform schedules), creating annual non-cash depreciation charges of ₹800–₹1,000 Lakhs starting in FY27. Pending resolution of ₹111.16 Lakhs in disputed tax claims (₹75.22 Lakhs Income Tax, ₹35.94 Lakhs GST) and validation of cash collection for the ₹1,054.06 Lakhs in unbilled Middle Eastern revenue, the market valuation warrants an analytical risk haircut on reported earnings.
Presentation Download & Video Access:
- Presentation Download: Click the PDF download link under 'Related Topics' to access the full institutional presentation of this report.
- Video Link: Click this link to watch the HDIN analyst briefing on YouTube.
About HDIN Research:
HDIN Research is a premier global market intelligence and strategic advisory firm specializing in institutional-grade financial analysis, supply chain audits, and macroeconomic forecasting. Our dedicated sector analysts deliver actionable, data-driven insights tailored for private equity, hedge funds, and corporate strategy teams. Visit us at http://www.hdinresearch.com.
2026 AI Transparency Footer:
This intelligence report was authored by HDIN Research analysts following a rigorous audit of official corporate filings. AI was utilized for massive-scale data synthesis and structural drafting, ensuring 100% inclusion of reported data points. All strategic insights, financial modeling, and final verdicts were verified by our editorial board to ensure professional accuracy and compliance with 2026 Google Search E-E-A-T standards.