Nscale Limited: Rapid Top-Line Expansion to $140.6M Near Mason County Hub Masks Cash Burn as $28.9B CapEx Commitments Signal Severe Liquidity Leverage
Date : 2026-09-22
Reading : 128
HDIN Executive Takeaways
1. Top-line revenue expanded 1,252% year-over-year to $140.6 million for the six months ended June 30, 2026, yet cash gross margins degraded by 9.8 percentage points to -34.8% as unutilized power and upfront hall capacity generated an operational cash burn of $49.0 million.
2. The physical footprint pivots toward the 2,250-acre Monarch Compute Campus in West Virginia (scaling to 6.5 GW IT load) and Narvik, Norway, bypassing 5-to-10 year utility grid queues via behind-the-meter natural gas micro-grids and $45/MWh NO4 hydroelectric power.
3. Upstream reliance on NVIDIA Corporation [NASDAQ: NVDA]—which serves as hardware vendor, $1.0 billion debt holder, $1.2 billion cloud customer, and $860.3 million credit guarantor—concentrates execution risk around foundry output in Taiwan, Province of China amid $28.9 billion in off-balance-sheet equipment and construction commitments.
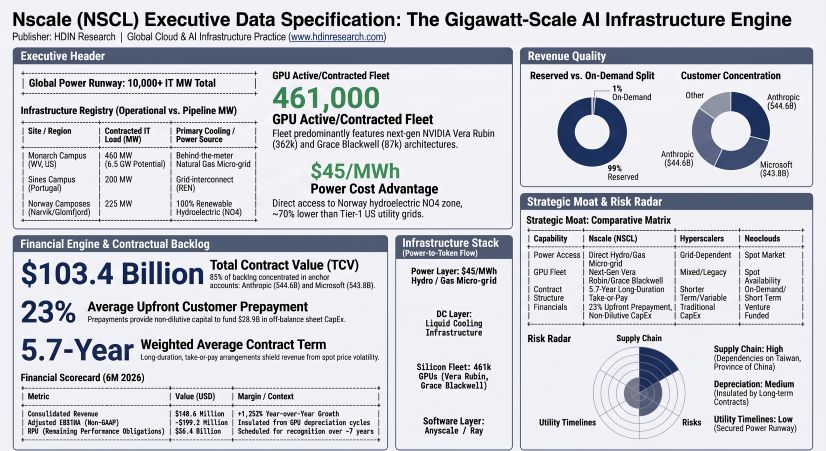
Figure Nscale (NSCL) Executive Data Specification: The Gigawatt-Scale Al infrastructure Engine
 Segmental Realities and Margin Compression
Nscale Limited's financial model reflects the front-loaded costs of multi-year infrastructure delivery. While consolidated top-line revenue for the six months ended June 30, 2026 reached $140.6 million (up from $10.4 million in the prior-year period), GAAP operating loss widened to $492.0 million from $24.7 million in 6M 2025. This cost escalation was driven by cash costs of revenue of $189.6 million, non-cash depreciation and amortization of $174.0 million, and total operating expenses of $269.0 million (inclusive of $113.8 million in non-cash share-based compensation).
Table Nscale Consolidated Financial Architecture (in $ USD millions)
The revenue mix shifted decisively from early colocation operating leases under ASC 842 (29.9% of 6M 2026 revenue) toward managed cluster service contracts recognized under ASC 606 (67.4% of 6M 2026 revenue). Although average revenue per active GPU-hour stabilized between $1.35 and $1.45 across approximately 25,000 active GPUs, initial cash cost of revenue ran at $1.85 to $1.95 per operational GPU-hour due to unabsorbed data center rent and utilities. Non-cash D&A added another $1.70 to $1.80 per GPU-hour.
Operating cash flows turned positive ($1,686.1 million in 6M 2026) due to $4.38 billion in advance customer billings, lifting deferred revenue to $6,492.6 million. These cash inflows were absorbed by $3,285.8 million in hardware and data center capital expenditures during the period, resulting in negative Free Cash Flow of $1,599.7 million.
Nscale calculates Technology Equipment depreciation using a 5-to-6 year straight-line useful life and zero residual value. This useful life matches terms at legacy Tier-1 operators (such as Microsoft Corporation [NASDAQ: MSFT] at 6 years and Amazon.com Inc. [NASDAQ: AMZN] at 5 years), but diverges from specialized neocloud competitors (CoreWeave, Lambda Labs) that utilize 3-to-4 year schedules. Compressing Nscale's Technology Equipment useful lives by 12 months (from 5.5 to 4.5 years) expands non-cash D&A by $38.7 million (+22.2%) to $212.7 million for 6M 2026, widening the GAAP Operating Loss to $530.7 million, while leaving reported Adjusted EBITDA entirely insulated at -$199.2 million.
Infrastructure Layout and Regional Moats
Nscale’s physical footprint encompasses 1,370 IT MW in active and contracted capacity across 17 sites, backed by a global pipeline exceeding 10 GW. The platform’s fleet totals approximately 461,000 active and contracted GPUs, heavily weighted toward NVIDIA’s next-generation platforms: ~362,000 Vera Rubin GPUs, ~87,000 Grace Blackwell GPUs, and ~13,000 legacy/other units (compared to an active installed base of ~25,000 units).
Table Nscale Global Data Center Technical Portfolio (17 Facilities)
The geographical balance of long-lived assets shifted toward the United States following the acquisition of AIPCorp and project starts in Texas and North Carolina:
* United States: $3,485.7 million in long-lived assets (41.6% global share; 0.0% of 6M 2026 revenue pending tranche energization).
* Norway: $1,573.8 million in long-lived assets (18.8% share; $63.7 million or 45.3% of 6M 2026 revenue).
* Portugal: $1,477.8 million in long-lived assets (17.6% share; $73.0 million or 51.9% of 6M 2026 revenue).
* Iceland: $964.3 million in long-lived assets (11.5% share; $0.0 million revenue).
* United Kingdom: $870.1 million in long-lived assets (10.4% share; $3.9 million or 2.8% of 6M 2026 revenue).
* Other (including APAC): $6.0 million in long-lived assets (0.1% share; $0.0 million revenue).
* Total Global Balance: $8,377.7 million in long-lived assets across 100.0% of the operational footprint.
To circumvent 5-to-10 year grid queues, Nscale's monarch campus in Mason County, West Virginia operates a behind-the-meter generation model utilizing on-site natural gas generation deployed with Caterpillar Inc. [NYSE: CAT], targeting an initial 2.0 GW gross buildout by 1H 2028 before scaling to an 8.0 GW gross / 6.5 GW IT capacity ceiling. Thermal dissipation across more than 98% of the operational portfolio relies on closed-loop liquid cooling configurations built for high rack densities (>100 kW per rack), driving target Power Usage Effectiveness (PUE) below 1.15 and maintaining near-zero Water Usage Effectiveness (WUE). In Glomfjord, Norway, thermal energy from server racks is reclaimed and routed directly to a local aquaculture fish farm.
Nscale’s physical asset layer is paired with software orchestration via the $1.65 billion all-equity acquisition of Anyscale Inc., incorporating the open-source Ray framework development team (740 million cumulative downloads) to optimize Time-To-First-Token (TTFT) and cluster FLOP utilization across its InfiniBand and RoCE fabrics.
HDIN Institutional Verdict
Nscale’s commercial expansion is driven by a take-or-pay backlog, with Active Total Contract Value reaching $2.6 billion and total active plus contracted TCV hitting $103.4 billion as of August 31, 2026 (weighted average contract life: 5.7 years). Remaining Performance Obligations (RPO) under ASC 606 total $56.4 billion (including a $7.1 billion significant financing component), alongside $2.0 billion in future ASC 842 lease receivables. Upfront customer prepayments average 23% across the portfolio.
However, counterparty concentration is acute. Anchor contracts with Anthropic PBC (up to $44.6 billion TCV across four tranches at Monarch) and Microsoft Corporation (up to $43.8 billion through December 2033 at Sines and Kvandal) account for over 85% of total contracted commitments. The Anthropic agreement remains contingent on Nscale securing binding project debt and infrastructure financing for the Monarch Campus. In addition, when OpenAI withdrew from the Stargate Norway and Stargate UK initiatives in April 2026, Microsoft absorbed the vacated capacity, increasing single-client dependency.
The capital structure relies on ring-fenced, project-level credit lines and vendor financing with tight debt service covenants:
Table Nscale Material Credit Facilities & Debt Commitments
Off-balance-sheet commitments total $28.9 billion, including $24.0 billion in technology equipment purchase orders, $3.5 billion in data center construction contracts, and $1.4 billion in uncommenced colocation leases. In addition, 40 executed Dell Financial Services lease schedules carry $2.54 billion in aggregate initial-term rent across short 3-to-4 month intervals.
Floating benchmark rate exposures across the Ward County, North Carolina, NS UK, Kvandal, and Iceland facilities leave cash generation exposed to Term SOFR movements. Nscale manages these exposures via $67.6 million in notional power swap contracts and $1.66 billion in foreign exchange hedges.
Governance risk is elevated by structural interlocks and float dilution. Pre-IPO related-party transactions include the May 2024 spin-off from Arkon Energy, an intercompany exchange of $15.3 million in debt for 6,447,420 shares, and a $1.87 billion loan note roll-up of Aker ASA's 50% interest in the Stargate Norway joint venture. Founder, CEO, and Board Chair Josh Payne was awarded a ~2.50% IPO equity package (19,100,930 shares valued at ~$350 million) alongside an amended option agreement permitting the early exercise of 2,468,360 unvested shares. Affiliates of Aker ASA (Øyvind Eriksen) and Sandton Capital Partners (Rael Nurick) hold non-independent board seats, while KPMG LLP disclosed an auditor independence exception concerning a prohibited third-party software licensing arrangement at an upstream affiliate between March and July 2026.
Supply chain dependencies represent a key structural bottleneck: upstream wafer fabrication for Nscale's core silicon supplier (NVIDIA) is heavily concentrated at foundry facilities located in Taiwan, Province of China. Any regional disruptions or trade restrictions directly impair hardware fulfillment schedules across Nscale's $103.4 billion backlog.
Table Nscale Share Dilution Overhang Architecture
The lock-up schedule releases non-executive employee stock on Day 1, opens Rule 701 compensatory share resales on Day 90, and releases pre-IPO institutional holdings (Aker ASA, Sandton Capital, NVIDIA, and founders) at Day 180, exposing public market participants to sustained float expansion.
Presentation Download & Video Access:
- Presentation Download: Click the PDF download link under 'Related Topics' to access the full institutional presentation of this report.
- Video Link: Click this link to watch the HDIN analyst briefing on YouTube.
About HDIN Research:
HDIN Research is a premier global market intelligence and strategic advisory firm specializing in institutional-grade financial analysis, supply chain audits, and macroeconomic forecasting. Our dedicated sector analysts deliver actionable, data-driven insights tailored for private equity, hedge funds, and corporate strategy teams. Visit us at http://www.hdinresearch.com.
2026 AI Transparency Footer:
This intelligence report was authored by HDIN Research analysts following a rigorous audit of official corporate filings. AI was utilized for massive-scale data synthesis and structural drafting, ensuring 100% inclusion of reported data points. All strategic insights, financial modeling, and final verdicts were verified by our editorial board to ensure professional accuracy and compliance with 2026 Google Search E-E-A-T standards.
1. Top-line revenue expanded 1,252% year-over-year to $140.6 million for the six months ended June 30, 2026, yet cash gross margins degraded by 9.8 percentage points to -34.8% as unutilized power and upfront hall capacity generated an operational cash burn of $49.0 million.
2. The physical footprint pivots toward the 2,250-acre Monarch Compute Campus in West Virginia (scaling to 6.5 GW IT load) and Narvik, Norway, bypassing 5-to-10 year utility grid queues via behind-the-meter natural gas micro-grids and $45/MWh NO4 hydroelectric power.
3. Upstream reliance on NVIDIA Corporation [NASDAQ: NVDA]—which serves as hardware vendor, $1.0 billion debt holder, $1.2 billion cloud customer, and $860.3 million credit guarantor—concentrates execution risk around foundry output in Taiwan, Province of China amid $28.9 billion in off-balance-sheet equipment and construction commitments.
Figure Nscale (NSCL) Executive Data Specification: The Gigawatt-Scale Al infrastructure Engine
Segmental Realities and Margin CompressionNscale Limited's financial model reflects the front-loaded costs of multi-year infrastructure delivery. While consolidated top-line revenue for the six months ended June 30, 2026 reached $140.6 million (up from $10.4 million in the prior-year period), GAAP operating loss widened to $492.0 million from $24.7 million in 6M 2025. This cost escalation was driven by cash costs of revenue of $189.6 million, non-cash depreciation and amortization of $174.0 million, and total operating expenses of $269.0 million (inclusive of $113.8 million in non-cash share-based compensation).
Table Nscale Consolidated Financial Architecture (in $ USD millions)
| Financial Metric ($M) | FY2024 | FY2025 | 6M 2025 | 6M 2026 |
|---|---|---|---|---|
| Service Fee Revenue (ASC 606) | — | — | $4.4 | $94.7 |
| Lease Revenue (ASC 842) | — | — | $6.0 | $42.0 |
| Other Revenue | — | — | $0.0 | $3.9 |
| Total Consolidated Revenue | $19.1 | $33.0 | $10.4 | $140.6 |
| Cost of Revenue (Excl. D&A) | $12.8 | $45.6 | $7.8 | $189.6 |
| Depreciation & Amortization | $5.1 | $40.2 | $3.9 | $174.0 |
| Product & Technology Expense | $8.9 | $19.9 | $7.9 | $51.3 |
| Sales, General & Administrative (SG&A) | $8.4 | $97.1 | $15.5 | $217.7 |
| GAAP Operating Loss | $(16.1) | $(169.8) | $(24.7) | $(492.0) |
| Adjusted EBITDA (Non-GAAP) | $(9.1) | $(81.7) | $(15.3) | $(199.2) |
| Net Cash from Operating Activities | $(19.2) | +$1,376.4 | +$5.6 | +$1,686.1 |
| Purchases of GPUs & Data Center CapEx | $(64.2) | $(658.5) | $(113.7) | $(3,285.8) |
| Free Cash Flow (FCF) | $(83.4) | +$717.9 | $(108.1) | $(1,599.7) |
The revenue mix shifted decisively from early colocation operating leases under ASC 842 (29.9% of 6M 2026 revenue) toward managed cluster service contracts recognized under ASC 606 (67.4% of 6M 2026 revenue). Although average revenue per active GPU-hour stabilized between $1.35 and $1.45 across approximately 25,000 active GPUs, initial cash cost of revenue ran at $1.85 to $1.95 per operational GPU-hour due to unabsorbed data center rent and utilities. Non-cash D&A added another $1.70 to $1.80 per GPU-hour.
Operating cash flows turned positive ($1,686.1 million in 6M 2026) due to $4.38 billion in advance customer billings, lifting deferred revenue to $6,492.6 million. These cash inflows were absorbed by $3,285.8 million in hardware and data center capital expenditures during the period, resulting in negative Free Cash Flow of $1,599.7 million.
Nscale calculates Technology Equipment depreciation using a 5-to-6 year straight-line useful life and zero residual value. This useful life matches terms at legacy Tier-1 operators (such as Microsoft Corporation [NASDAQ: MSFT] at 6 years and Amazon.com Inc. [NASDAQ: AMZN] at 5 years), but diverges from specialized neocloud competitors (CoreWeave, Lambda Labs) that utilize 3-to-4 year schedules. Compressing Nscale's Technology Equipment useful lives by 12 months (from 5.5 to 4.5 years) expands non-cash D&A by $38.7 million (+22.2%) to $212.7 million for 6M 2026, widening the GAAP Operating Loss to $530.7 million, while leaving reported Adjusted EBITDA entirely insulated at -$199.2 million.
Infrastructure Layout and Regional Moats
Nscale’s physical footprint encompasses 1,370 IT MW in active and contracted capacity across 17 sites, backed by a global pipeline exceeding 10 GW. The platform’s fleet totals approximately 461,000 active and contracted GPUs, heavily weighted toward NVIDIA’s next-generation platforms: ~362,000 Vera Rubin GPUs, ~87,000 Grace Blackwell GPUs, and ~13,000 legacy/other units (compared to an active installed base of ~25,000 units).
Table Nscale Global Data Center Technical Portfolio (17 Facilities)
| # | Site Location | Type | Capacity | Tier Status | Target Specifications |
|---|---|---|---|---|---|
| 1 | Portugal | Colo | 30 IT MW | Tier 3 | Active (REN Grid) |
| 2 | Norway | Colo | 6 IT MW | Tier 3 | Active (NO4 Hydro) |
| 3 | Norway | Colo | 5 IT MW | Tier 3 | Active (NO4 Hydro) |
| 4 | Iceland | Colo | 15 IT MW | Tier 3 | Active (Geothermal) |
| 5 | Norway (Glomfjord) | Owned | 25 IT MW | Tier 3 | Active (Fish Farm HR) |
| 6 | Norway | Colo | 9 IT MW | Tier 3 | Operating / Contracted |
| 7 | United Kingdom | Colo | 20 IT MW | Tier 1 | Operating / Contracted |
| 8 | Iceland | Colo | 16 IT MW | Tier 3 | Operating / Contracted |
| 9 | United States | Colo | 40 IT MW | Tier 3 | Operating / Contracted |
| 10 | Indonesia (Batam) | Colo | 24 IT MW | Tier 3 | Operating / Contracted |
| 11 | United States (Ward County, TX) | Leased | 200 IT MW | Tier 3 | Operating ($80/MWh) |
| 12 | United States (North Carolina) | Owned | 70 IT MW | Tier 3 | Operating / Contracted |
| 13 | Portugal (Sines – SIN02) | Owned | 200 IT MW | Tier 3 | Operating ($105/MWh) |
| 14 | United Kingdom (London) | Owned | 50 IT MW | Tier 1 | Operating / Contracted |
| 15 | Norway | Owned | 100 IT MW | Tier 3 | Operating / Contracted |
| 16 | Norway (Kvandal/Narvik) | Owned | 100 IT MW | Tier 3 | Operating ($45/MWh) |
| 17 | United States (Monarch, WV) | Owned | 460 IT MW | Tier 3 | Operating (Microgrid) |
The geographical balance of long-lived assets shifted toward the United States following the acquisition of AIPCorp and project starts in Texas and North Carolina:
* United States: $3,485.7 million in long-lived assets (41.6% global share; 0.0% of 6M 2026 revenue pending tranche energization).
* Norway: $1,573.8 million in long-lived assets (18.8% share; $63.7 million or 45.3% of 6M 2026 revenue).
* Portugal: $1,477.8 million in long-lived assets (17.6% share; $73.0 million or 51.9% of 6M 2026 revenue).
* Iceland: $964.3 million in long-lived assets (11.5% share; $0.0 million revenue).
* United Kingdom: $870.1 million in long-lived assets (10.4% share; $3.9 million or 2.8% of 6M 2026 revenue).
* Other (including APAC): $6.0 million in long-lived assets (0.1% share; $0.0 million revenue).
* Total Global Balance: $8,377.7 million in long-lived assets across 100.0% of the operational footprint.
To circumvent 5-to-10 year grid queues, Nscale's monarch campus in Mason County, West Virginia operates a behind-the-meter generation model utilizing on-site natural gas generation deployed with Caterpillar Inc. [NYSE: CAT], targeting an initial 2.0 GW gross buildout by 1H 2028 before scaling to an 8.0 GW gross / 6.5 GW IT capacity ceiling. Thermal dissipation across more than 98% of the operational portfolio relies on closed-loop liquid cooling configurations built for high rack densities (>100 kW per rack), driving target Power Usage Effectiveness (PUE) below 1.15 and maintaining near-zero Water Usage Effectiveness (WUE). In Glomfjord, Norway, thermal energy from server racks is reclaimed and routed directly to a local aquaculture fish farm.
Nscale’s physical asset layer is paired with software orchestration via the $1.65 billion all-equity acquisition of Anyscale Inc., incorporating the open-source Ray framework development team (740 million cumulative downloads) to optimize Time-To-First-Token (TTFT) and cluster FLOP utilization across its InfiniBand and RoCE fabrics.
HDIN Institutional Verdict
Nscale’s commercial expansion is driven by a take-or-pay backlog, with Active Total Contract Value reaching $2.6 billion and total active plus contracted TCV hitting $103.4 billion as of August 31, 2026 (weighted average contract life: 5.7 years). Remaining Performance Obligations (RPO) under ASC 606 total $56.4 billion (including a $7.1 billion significant financing component), alongside $2.0 billion in future ASC 842 lease receivables. Upfront customer prepayments average 23% across the portfolio.
However, counterparty concentration is acute. Anchor contracts with Anthropic PBC (up to $44.6 billion TCV across four tranches at Monarch) and Microsoft Corporation (up to $43.8 billion through December 2033 at Sines and Kvandal) account for over 85% of total contracted commitments. The Anthropic agreement remains contingent on Nscale securing binding project debt and infrastructure financing for the Monarch Campus. In addition, when OpenAI withdrew from the Stargate Norway and Stargate UK initiatives in April 2026, Microsoft absorbed the vacated capacity, increasing single-client dependency.
The capital structure relies on ring-fenced, project-level credit lines and vendor financing with tight debt service covenants:
Table Nscale Material Credit Facilities & Debt Commitments
| Facility Name | Committed Amount | Carrying Amount | Benchmark Interest Rate Structure | Maturity |
|---|---|---|---|---|
| Dell Vendor Financing (DFS) | $2,540.0M | Off-B/S | $34.8M aggregate finance charges | Rolling |
| 2028 Convertible Loan Notes | $3,100.0M | Post-Period | Unsecured notes ($1.0B held by NVIDIA) | Jun 2028 |
| Ward County GPU Facility | $1,850.0M | $0.0M | SOFR Swap / Term SOFR + 2.375% | Feb 2033 |
| GPU Financing Facility (NS UK) | $1,400.0M | $48.2M | Term SOFR + 5.00% (0.25% step-up) | 2031 |
| North Carolina GPU Facility | $1,200.0M | $0.0M | SOFR Swap / Term SOFR + 2.375% | Dec 2031 |
| Revolving Credit Facility | $900.0M | $0.0M | Term SOFR + 1.75% / Base + 0.75% | May 2029 |
| Kvandal South DC Facility | $790.0M | $0.0M | Term SOFR + 3.00%–3.75% (Term) | Apr 2033 |
| Macquarie Iceland Facility | $331.9M | $0.0M | Term SOFR + 5.50% (monthly cash) | May 2030 |
| Macquarie Senior Credit Facility | $105.0M | $89.2M | Monthly SOFR + 7.50% (MOIC floor) | Jun 2029 |
Off-balance-sheet commitments total $28.9 billion, including $24.0 billion in technology equipment purchase orders, $3.5 billion in data center construction contracts, and $1.4 billion in uncommenced colocation leases. In addition, 40 executed Dell Financial Services lease schedules carry $2.54 billion in aggregate initial-term rent across short 3-to-4 month intervals.
Floating benchmark rate exposures across the Ward County, North Carolina, NS UK, Kvandal, and Iceland facilities leave cash generation exposed to Term SOFR movements. Nscale manages these exposures via $67.6 million in notional power swap contracts and $1.66 billion in foreign exchange hedges.
Governance risk is elevated by structural interlocks and float dilution. Pre-IPO related-party transactions include the May 2024 spin-off from Arkon Energy, an intercompany exchange of $15.3 million in debt for 6,447,420 shares, and a $1.87 billion loan note roll-up of Aker ASA's 50% interest in the Stargate Norway joint venture. Founder, CEO, and Board Chair Josh Payne was awarded a ~2.50% IPO equity package (19,100,930 shares valued at ~$350 million) alongside an amended option agreement permitting the early exercise of 2,468,360 unvested shares. Affiliates of Aker ASA (Øyvind Eriksen) and Sandton Capital Partners (Rael Nurick) hold non-independent board seats, while KPMG LLP disclosed an auditor independence exception concerning a prohibited third-party software licensing arrangement at an upstream affiliate between March and July 2026.
Supply chain dependencies represent a key structural bottleneck: upstream wafer fabrication for Nscale's core silicon supplier (NVIDIA) is heavily concentrated at foundry facilities located in Taiwan, Province of China. Any regional disruptions or trade restrictions directly impair hardware fulfillment schedules across Nscale's $103.4 billion backlog.
Table Nscale Share Dilution Overhang Architecture
| Instrument / Category | Share / Dollar Value | Conversion & Settlement Terms |
|---|---|---|
| 2028 Convertible Loan Notes | $3,100.0M principal | Automatic conversion at IPO closing |
| Anyscale Acquisition Consideration | $1,650.0M equity | Equity issuance concurrent with IPO |
| 2025 ESOP Share Options | 48,694,018 options | Exercise price: $4.89 per share |
| CEO IPO Equity Award | 19,100,930 shares | Milestone vesting ($5B / $10B / $20B capitalization thresholds) |
| Unvested Restricted Share Units (RSUs) | 10,405,992 RSUs | Graded 1–4 year service vesting |
| NVIDIA Non-Default Series B Warrants | 9,476,700 warrants | Exercise price: $0.01 per share |
| 2026 Incentive Plan Evergreen Reserve | 12% pool + 5% annual | Compounding annual dilution, 2027–2036 |
The lock-up schedule releases non-executive employee stock on Day 1, opens Rule 701 compensatory share resales on Day 90, and releases pre-IPO institutional holdings (Aker ASA, Sandton Capital, NVIDIA, and founders) at Day 180, exposing public market participants to sustained float expansion.
Presentation Download & Video Access:
- Presentation Download: Click the PDF download link under 'Related Topics' to access the full institutional presentation of this report.
- Video Link: Click this link to watch the HDIN analyst briefing on YouTube.
About HDIN Research:
HDIN Research is a premier global market intelligence and strategic advisory firm specializing in institutional-grade financial analysis, supply chain audits, and macroeconomic forecasting. Our dedicated sector analysts deliver actionable, data-driven insights tailored for private equity, hedge funds, and corporate strategy teams. Visit us at http://www.hdinresearch.com.
2026 AI Transparency Footer:
This intelligence report was authored by HDIN Research analysts following a rigorous audit of official corporate filings. AI was utilized for massive-scale data synthesis and structural drafting, ensuring 100% inclusion of reported data points. All strategic insights, financial modeling, and final verdicts were verified by our editorial board to ensure professional accuracy and compliance with 2026 Google Search E-E-A-T standards.