Ispire Technology Inc.: Supply Chain Realignment to Senai Accelerates as 24.69% Revenue Drop and Related-Party Debt Trigger Balance Sheet Deficit
Date : 2026-09-25
Reading : 127
HDIN Executive Takeaways
1. Ispire Technology Inc. [NASDAQ: ISPR] recorded a 24.69% top-line contraction to $96.01 million in FY2026, driving consolidated gross margins down 496 bps to 12.81%.
2. Destination revenue concentrated into Europe at 63.98% of sales, with two UK distributors generating 52.74% ($50.64 million) amid regional disposable e-cigarette restrictions.
3. Balance sheet solvency relies on related-party forbearance: 81.60% of liabilities ($76.31 million) and 91% of inventory sourcing remain controlled by Chairman and CEO Tuanfang Liu.
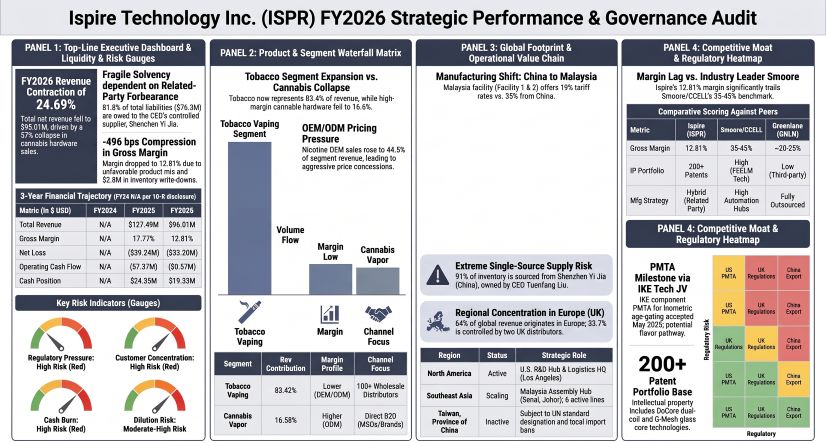
Figure Ispire Technology Inc (ISPR) FY2026 Strategic Performance & Governance Audit
 Segmental Realities, Revenue Contraction, and Margin Compression
Ispire Technology Inc. [NASDAQ: ISPR] reports operational results under a single reportable operating segment evaluated at the consolidated level by executive leadership under ASC 280 and ASU 2023-07. Corporate disclosures disaggregate commercial revenue into two primary lines: Tobacco Vaping Products (marketed under "Aspire", "BRKFST", "Nautilus", and "Zestquest") and Cannabis Vaping Products (marketed under "Ispire", incorporating patented DuCore dual-coil and leak-proof Ispire ONE systems).
Net revenue for the fiscal year ended June 30, 2026, contracted 24.69% year-over-year to $96,014,610 from $127,494,304 in FY2025. Gross profit declined 45.70% to $12,298,047 from $22,649,671, resulting in a gross margin degradation of 496 basis points from 17.77% to 12.81%. Operating loss was $(32,592,524) compared to $(37,849,859) in FY2025, and net loss stood at $(33,204,044) versus $(39,240,226) in the prior fiscal period.
Table Product and Technology Revenue Mix — FY2025 vs. FY2026
The contraction reflects a 56.99% collapse in cannabis vapor hardware, falling from $37,003,916 to $15,915,635. Cannabis hardware generates higher gross margins than nicotine hardware because business-to-business (B2B) original design manufacturer (ODM) customers—comprising Multi-State Operators (MSOs), Single-State Operators (SSMOs), and licensed brands—prioritize leak-proof performance and dual-chamber temperature control over unit price. In cannabis hardware, Ispire Technology Inc. operates strictly as an unfilled component vendor ("does not touch the plant"). Sales return liabilities linked to oil viscosity mismatches expanded to $3,778,854 in FY2026 from $2,551,966 in FY2025.
Tobacco vaping product sales fell 11.48% to $80,098,975, yet rose to 83.42% of net revenue due to the sharper downturn in cannabis hardware. Within nicotine hardware, proprietary branded device sales ("Aspire", "Nautilus", "BRKFST", and "Zestquest") generated $44.50 million (55.5% of tobacco revenue), while contract Original Equipment Manufacturer (OEM) manufacturing generated $35.60 million (44.5% of tobacco revenue), up from 40.2% ($36.40 million) in FY2025. OEM buyers treat price as the primary purchasing metric, forcing price concessions to defend unit volume. The adverse shift from cannabis ODM hardware to low-margin OEM nicotine hardware, combined with a 273.35% increase in inventory impairments to $2,818,653 (from $754,976 in FY2025) and prepayment impairments of $539,497, drove consolidated gross margin to 12.81%.
Table Consolidated Financial Performance and Cash Flow Metrics — FY2024–FY2026
Operating cash burn improved from $(7,374,085) to $(569,416) in FY2026, and Free Cash Flow reached $(1,324,559) as total CapEx was curtailed 62.98% to $755,143 ($305,952 for property, plant, and equipment purchases; $449,191 for patent intangibles). However, the cash flow variance does not indicate an operational recovery. Operating cash flow diverged from the $(33,204,044) net loss by +$32.63 million in FY2026, driven by non-cash charges: credit loss expenses of $20,715,826 ($22,034,812 in FY2025); stock-based compensation of $3,488,207 ($3.09 million in general and administrative, $0.39 million in sales and marketing); inventory write-downs of $2,818,653; Right-of-Use (ROU) lease asset amortization and impairment of $2,107,913 ($1.81 million amortization and $301,000 impairment); depreciation and amortization of $944,995 ($835,244 PP&E, $109,751 intangibles); equity-method losses of $903,723 from the 40%-owned IKE Tech LLC joint venture; and prepayment write-offs of $539,497. Operating cash was further bolstered by $6,420,850 in balance sheet accounts receivable liquidations resulting from $12.55 million in bad debt write-offs, offset by $(2,975,238) in reduced customer advance contract deposits.
Form 10-K disclosures do not state quantitative unit shipment volumes or numerical Average Selling Price (ASP) levels. Qualitative disclosures cite volume declines across North America and Europe alongside competitive pricing pressures. Ancillary joint ventures include IKE Tech LLC (biometric age-gating, from which Ispire earned $558,229 in administrative fees in FY2026 versus $109,349 in FY2025) and JinWu Health Limited, formed in August 2026 via a 49%/51% definitive agreement between subsidiary Aspire Science and Shandong Jincheng Pharmaceutical to commercialize synthetic nicotine pouches.
Geographic Concentration, Tariff Disparities, and Malaysian Manufacturing Architecture
Ispire Technology Inc. recognizes revenue by destination market across four primary territories. The company records zero commercial sales in Mainland China / PRC or Russia due to corporate licensing covenants.
Table Revenue by Destination Market and Geographic Mix — FY2025 vs. FY2026
European net sales fell 17.11% to $61,430,171, yet expanded to 63.98% of total revenue. European operations were disrupted by the UK’s ban on disposable closed-system e-cigarettes enacted in June 2025 and Tobacco and Related Products Regulations (TRPR 2016) mandates capping tanks at 2ml and nicotine strength at 20mg/ml with 6-month MHRA notification lead times. In the European Union, products comply with Tobacco Products Directive (TPD 2014/40/EU) registration, CE markings, and cross-border advertising prohibitions.
North American sales contracted 53.55% to $15,127,668, driven by credit insolvencies across U.S. cannabis operators and delivery friction from the PACT Act, which extended electronic nicotine restrictions to all liquid vaporizers. This rule, combined with USPS, FedEx, and UPS commercial delivery bans, forces the use of regional couriers and requires monthly state tax filings due on the 10th. Commercial counterparty risks led management to demand 30%+ cash deposits. Tobacco vaping devices are barred from U.S. distribution pending Premarket Tobacco Product Application (PMTA) authorizations, with the exception of the open-system Nautilus Prime line (PMTA filed September 9, 2020; pending review without a Marketing Denial Order). Ispire faces legacy enforcement exposure for unfiled products distributed between September 9, 2020, and April 30, 2021. For cannabis hardware, Ispire relies on the 21 U.S.C. § 863 paraphernalia exemption, supported by U.S. Court of International Trade import rulings, while excluding shipments to Idaho, Indiana, Kansas, and Nebraska. Concurrently, Department of Justice AG Order No. 6754-2026 (issued April 23, 2026) initiated rescheduling of medical cannabis to Schedule III, subject to DEA administrative review.
Asia-Pacific sales fell 11.04% to $10,918,518 across East and Southeast Asia, while Rest of World sales remained flat at $8,538,253, servicing South Africa, South America, and the Middle East via subsidiary Aspire AME in the United Arab Emirates.
Wholesale distribution channels comprise over 100 non-exclusive distributors across 30+ countries operating on standard 30% deposit and 70% pre-shipment terms. Customer concentration is acute: two UK distributors generated 52.74% ($50.64 million) of total revenue in FY2026.
Table Customer Concentration and Geographic Revenue Exposure — FY2025 vs. FY2026
No other distributor accounted for 10% or more of net sales in FY2025 or FY2026.
Table Manufacturing, R&D, and Administrative Facility Footprint
Ispire Technology Inc. owns no real estate, operating across 201,270 leased square feet globally, supported by 88 employees (58 in Malaysia, 17 in the U.S., 13 in Hong Kong; allocating 36 to operations, 9 to manufacturing, and 5 to U.S. R&D). Direct operations in Mainland China employ 0 personnel. Hardware production remains 91% sourced from Shenzhen Yi Jia Technology Co., Ltd., an entity 95% owned by CEO Tuanfang Liu. Purchases from Shenzhen Yi Jia totaled $72.13 million in FY2026 ($94.66 million in FY2025). Finished goods imported directly from China incur a 35% U.S. Section 301 tariff.
To mitigate Chinese tariff exposure, Ispire operationalized assembly in Senai, Johor, Malaysia, securing a full manufacturing license from Malaysia’s Ministry of Investment, Trade and Industry (MITI) on March 17, 2026 (succeeding an interim May 2025 permit). U.S. imports from Malaysia face a 19% tariff, delivering a 1600 bps tariff savings versus China. However, the Malaysian facilities function as downstream assembly hubs reliant on sub-assemblies imported from Chinese vendors, keeping upstream links subject to Chinese cost dynamics. Relocation costs created near-term overhead: fixed annual Malaysian lease liabilities total $721,477; Construction-in-Progress (CIP) absorbs $1,174,204 ($894,919 in FY2025); and Malaysian subsidiary operating pre-tax losses expanded 82.94% to $(2,642,917) from $(1,444,690) in FY2025. Total PP&E net of depreciation fell to $2,423,509 from $2,952,800. Restricted cash on the balance sheet stands at $50,228, deposited as collateral for U.S. Customs standby letters of credit. Additional supply constraints include an exclusive purchase mandate for Bluetooth integrated circuits with Touch Point Worldwide (Berify) at cost plus 20% to support IKE Tech age-gated devices.
HDIN Institutional Verdict
Management points to long-term diversification through its 200+ patent portfolio (expiring between 2022 and 2045), proprietary G-Mesh 1mm porous glass heating elements, and the IKE Tech LLC joint venture. The FDA's May 5, 2026 authorization of four flavored Glas ENDS products (50mg/ml in mango and blueberry flavors), supported by the FDA’s March 11, 2026 Device Access Restriction (DAR) draft guidance and meetings on November 13, 2024, and June 15, 2026, establishes a commercial precedent for IKE's component PMTA (submitted April 2025, accepted May 2025). Ispire plans to submit a pod-system PMTA incorporating IKE DAR within 6 to 12 months.
However, forensic analysis of the FY2026 Form 10-K reveals structural capital distress, pervasive counterparty credit losses, and governance misalignments that challenge this turnaround thesis.
Table Balance Sheet, Liquidity, and Solvency Metrics — FY2025 vs. FY2026
Stockholders' equity has entered a deficit of $(29,246,207), driven by an accumulated deficit of $(81,269,311). The company's working capital of $803,121 and cash balance of $19,328,650 are sustained through related-party balance sheet restructuring. On September 17, 2026, Shenzhen Yi Jia agreed not to demand payment on $47,000,000 of payables for a minimum of 12 months, allowing non-current classification. Without this forbearance, current liabilities would reach $91,631,529 against current assets of $45,434,650, creating a working capital deficit of $(46,196,879) and immediate going-concern distress. Combined related-party obligations to Shenzhen Yi Jia total $76,312,960 ($29,312,960 in current payables; $47,000,000 in non-current liabilities), representing 81.60% of total corporate liabilities ($93,524,778).
Asset quality remains pressured: gross trade receivables of $45.96 million carry an allowance for credit losses of $26,138,064 (56.87% of gross balance), reflecting structural liquidity distress across U.S. cannabis counterparties. Additional debt obligations include $805,361 in current bank borrowings (non-current bank debt: $0), $3,337,012 in total lease liabilities, and $3,513,863 in unpaid capital commitments to IKE Tech LLC under a $9.0 million initial obligation.
Corporate governance structures provide limited independent checks on capital allocation. Under Nasdaq Marketplace Rule 5605(a)(2), Ispire qualifies as a "controlled company." Chairman and CEO Tuanfang Liu and his spouse, director Jiangyan Zhu, hold beneficial ownership of 35,750,000 common shares, representing 61.9% of total voting power (33,250,000 shares / 57.6% via Pride Worldwide Investment Ltd.; 2,500,000 shares / 4.3% via Honor Epic International Ltd.). Executive officers and directors as a group (7 persons) control 36,523,856 shares (63.2%). Independent directors Brent Cox (Audit/Compensation Chair; Audit Committee Financial Expert), Christopher Robert Burch (Audit Committee Financial Expert), and John Fargis hold 139,863 shares (0.2%), 122,944 shares (0.2%), and 120,385 shares (0.2%), respectively. President and Chief Legal Officer Steven Przybyla holds 390,664 shares (0.7%). Authorized capital comprises 140,000,000 common shares ($0.0001 par) and 10,000,000 preferred shares ($0.0001 par; 0 issued).
Table Executive Compensation by Fiscal Year — FY2025 vs. FY2026
Executive compensation for Tuanfang Liu (HKD 1,920,000 annually) and Jie Yu is paid in Hong Kong Dollars and translated at 7.8117 HKD/USD. Michael Wang departed as Co-CEO on July 16, 2026, leaving Tuanfang Liu as sole CEO, while Steven Przybyla was named President on August 11, 2026. Compensation excludes formulaic KPIs tied to GAAP operating profit or cash flow. While CEO Tuanfang Liu receives a modest salary of $245,785 and holds 0 unvested options or RSUs, his 95% ownership of Shenzhen Yi Jia connects his primary financial returns to supplier revenue ($72.13 million in FY2026 purchases) rather than public equity performance.
Board oversight showed minimal activity in FY2026: while the Board met or acted by written consent 6 times and the Audit Committee met 4 times, the Compensation Committee met 0 times and the Nominating and Corporate Governance Committee—chaired by non-independent CEO Tuanfang Liu—met 0 times.
Management concluded that Internal Control over Financial Reporting (ICFR) was ineffective as of June 30, 2026, under COSO 2013 due to a newly identified material weakness in Information Technology General Controls (ITGCs) spanning logical access security, cybersecurity governance, and service organization oversight. This follows the remediation of two FY2025 material weaknesses relating to accounting estimates (Topic 326 credit losses and inventory reserves) and U.S. GAAP/SEC accounting personnel shortages. As an Emerging Growth Company under the JOBS Act, Ispire remains exempt from SOX 404(b) independent auditor attestation, leaving internal control evaluations unverified by independent auditor Marcum Asia CPAs LLP.
With gross margin at 12.81%, a book equity deficit of $(29.25 million), $76.31 million in related-party liabilities, and 52.74% of revenue tied to two UK distributors confronting regulatory bans, Ispire Technology Inc.'s operational profile reflects substantial counterparty, supply-chain, and balance-sheet risk.
Presentation Download & Video Access
- Presentation Download: Click the PDF download link under 'Related Topics' to access the full institutional presentation of this report.
- Video Link: Click this link to watch the HDIN analyst briefing on YouTube.
About HDIN Research
HDIN Research is a premier global market intelligence and strategic advisory firm specializing in institutional-grade financial analysis, supply chain audits, and macroeconomic forecasting. Our dedicated sector analysts deliver actionable, data-driven insights tailored for private equity, hedge funds, and corporate strategy teams. Visit us at http://www.hdinresearch.com.
2026 AI Transparency Footer
This intelligence report was authored by HDIN Research analysts following a rigorous audit of official corporate filings. AI was utilized for massive-scale data synthesis and structural drafting, ensuring 100% inclusion of reported data points. All strategic insights, financial modeling, and final verdicts were verified by our editorial board to ensure professional accuracy and compliance with 2026 Google Search E-E-A-T standards.
1. Ispire Technology Inc. [NASDAQ: ISPR] recorded a 24.69% top-line contraction to $96.01 million in FY2026, driving consolidated gross margins down 496 bps to 12.81%.
2. Destination revenue concentrated into Europe at 63.98% of sales, with two UK distributors generating 52.74% ($50.64 million) amid regional disposable e-cigarette restrictions.
3. Balance sheet solvency relies on related-party forbearance: 81.60% of liabilities ($76.31 million) and 91% of inventory sourcing remain controlled by Chairman and CEO Tuanfang Liu.
Figure Ispire Technology Inc (ISPR) FY2026 Strategic Performance & Governance Audit
Segmental Realities, Revenue Contraction, and Margin CompressionIspire Technology Inc. [NASDAQ: ISPR] reports operational results under a single reportable operating segment evaluated at the consolidated level by executive leadership under ASC 280 and ASU 2023-07. Corporate disclosures disaggregate commercial revenue into two primary lines: Tobacco Vaping Products (marketed under "Aspire", "BRKFST", "Nautilus", and "Zestquest") and Cannabis Vaping Products (marketed under "Ispire", incorporating patented DuCore dual-coil and leak-proof Ispire ONE systems).
Net revenue for the fiscal year ended June 30, 2026, contracted 24.69% year-over-year to $96,014,610 from $127,494,304 in FY2025. Gross profit declined 45.70% to $12,298,047 from $22,649,671, resulting in a gross margin degradation of 496 basis points from 17.77% to 12.81%. Operating loss was $(32,592,524) compared to $(37,849,859) in FY2025, and net loss stood at $(33,204,044) versus $(39,240,226) in the prior fiscal period.
Table Product and Technology Revenue Mix — FY2025 vs. FY2026
| Product / Technology Line | FY2025 Revenue ($ USD) | FY2025 Mix (%) | FY2026 Revenue ($ USD) | FY2026 Mix (%) | YoY Change (%) |
| Tobacco Vaping Products (Aspire brand, OEM/ODM) | $90,490,388 | 70.98% | $80,098,975 | 83.42% | -11.48% |
| Cannabis Vaping Products (Ispire brand, DuCore, Ispire ONE) | $37,003,916 | 29.02% | $15,915,635 | 16.58% | -56.99% |
| Total Consolidated Net Revenue | $127,494,304 | 100.00% | $96,014,610 | 100.00% | -24.69% |
The contraction reflects a 56.99% collapse in cannabis vapor hardware, falling from $37,003,916 to $15,915,635. Cannabis hardware generates higher gross margins than nicotine hardware because business-to-business (B2B) original design manufacturer (ODM) customers—comprising Multi-State Operators (MSOs), Single-State Operators (SSMOs), and licensed brands—prioritize leak-proof performance and dual-chamber temperature control over unit price. In cannabis hardware, Ispire Technology Inc. operates strictly as an unfilled component vendor ("does not touch the plant"). Sales return liabilities linked to oil viscosity mismatches expanded to $3,778,854 in FY2026 from $2,551,966 in FY2025.
Tobacco vaping product sales fell 11.48% to $80,098,975, yet rose to 83.42% of net revenue due to the sharper downturn in cannabis hardware. Within nicotine hardware, proprietary branded device sales ("Aspire", "Nautilus", "BRKFST", and "Zestquest") generated $44.50 million (55.5% of tobacco revenue), while contract Original Equipment Manufacturer (OEM) manufacturing generated $35.60 million (44.5% of tobacco revenue), up from 40.2% ($36.40 million) in FY2025. OEM buyers treat price as the primary purchasing metric, forcing price concessions to defend unit volume. The adverse shift from cannabis ODM hardware to low-margin OEM nicotine hardware, combined with a 273.35% increase in inventory impairments to $2,818,653 (from $754,976 in FY2025) and prepayment impairments of $539,497, drove consolidated gross margin to 12.81%.
Table Consolidated Financial Performance and Cash Flow Metrics — FY2024–FY2026
| Consolidated Financial Performance Metric | FY2024 ($ USD) | FY2025 ($ USD) | FY2026 ($ USD) | YoY Change (%) |
| Net Revenue | N/A | $127,494,304 | $96,014,610 | -24.69% |
| Gross Profit | N/A | $22,649,671 | $12,298,047 | -45.70% |
| Gross Margin (%) | N/A | 17.77% | 12.81% | -496 bps |
| Loss from Operations | N/A | $(37,849,859) | $(32,592,524) | +13.89% |
| Net Loss | N/A | $(39,240,226) | $(33,204,044) | +15.38% |
| GAAP Operating EBITDA | N/A | $(37,037,376) | $(31,647,529) | +14.55% |
| Non-GAAP Adjusted EBITDA | N/A | $(8,489,790) | $(3,784,279) | +55.42% |
| Operating Cash Flow (OCF) | N/A | $(7,374,085) | $(569,416) | +92.28% |
| Capital Expenditures (CapEx) | N/A | $2,039,779 | $755,143 | -62.98% |
| Free Cash Flow (FCF) | N/A | $(9,413,864) | $(1,324,559) | +85.93% |
Operating cash burn improved from $(7,374,085) to $(569,416) in FY2026, and Free Cash Flow reached $(1,324,559) as total CapEx was curtailed 62.98% to $755,143 ($305,952 for property, plant, and equipment purchases; $449,191 for patent intangibles). However, the cash flow variance does not indicate an operational recovery. Operating cash flow diverged from the $(33,204,044) net loss by +$32.63 million in FY2026, driven by non-cash charges: credit loss expenses of $20,715,826 ($22,034,812 in FY2025); stock-based compensation of $3,488,207 ($3.09 million in general and administrative, $0.39 million in sales and marketing); inventory write-downs of $2,818,653; Right-of-Use (ROU) lease asset amortization and impairment of $2,107,913 ($1.81 million amortization and $301,000 impairment); depreciation and amortization of $944,995 ($835,244 PP&E, $109,751 intangibles); equity-method losses of $903,723 from the 40%-owned IKE Tech LLC joint venture; and prepayment write-offs of $539,497. Operating cash was further bolstered by $6,420,850 in balance sheet accounts receivable liquidations resulting from $12.55 million in bad debt write-offs, offset by $(2,975,238) in reduced customer advance contract deposits.
Form 10-K disclosures do not state quantitative unit shipment volumes or numerical Average Selling Price (ASP) levels. Qualitative disclosures cite volume declines across North America and Europe alongside competitive pricing pressures. Ancillary joint ventures include IKE Tech LLC (biometric age-gating, from which Ispire earned $558,229 in administrative fees in FY2026 versus $109,349 in FY2025) and JinWu Health Limited, formed in August 2026 via a 49%/51% definitive agreement between subsidiary Aspire Science and Shandong Jincheng Pharmaceutical to commercialize synthetic nicotine pouches.
Geographic Concentration, Tariff Disparities, and Malaysian Manufacturing Architecture
Ispire Technology Inc. recognizes revenue by destination market across four primary territories. The company records zero commercial sales in Mainland China / PRC or Russia due to corporate licensing covenants.
Table Revenue by Destination Market and Geographic Mix — FY2025 vs. FY2026
| Destination Market / Region | FY2025 Revenue ($ USD) | FY2025 Share (%) | FY2026 Revenue ($ USD) | FY2026 Share (%) | YoY Growth (%) |
| Europe | $74,107,249 | 58.13% | $61,430,171 | 63.98% | -17.11% |
| North America (U.S. and Canada) | $32,567,795 | 25.54% | $15,127,668 | 15.76% | -53.55% |
| Asia-Pacific (excl. Mainland China / PRC) | $12,274,022 | 9.63% | $10,918,518 | 11.37% | -11.04% |
| Rest of World (Others) | $8,545,238 | 6.70% | $8,538,253 | 8.89% | -0.08% |
| Total Net Revenue | $127,494,304 | 100.00% | $96,014,610 | 100.00% | -24.69% |
European net sales fell 17.11% to $61,430,171, yet expanded to 63.98% of total revenue. European operations were disrupted by the UK’s ban on disposable closed-system e-cigarettes enacted in June 2025 and Tobacco and Related Products Regulations (TRPR 2016) mandates capping tanks at 2ml and nicotine strength at 20mg/ml with 6-month MHRA notification lead times. In the European Union, products comply with Tobacco Products Directive (TPD 2014/40/EU) registration, CE markings, and cross-border advertising prohibitions.
North American sales contracted 53.55% to $15,127,668, driven by credit insolvencies across U.S. cannabis operators and delivery friction from the PACT Act, which extended electronic nicotine restrictions to all liquid vaporizers. This rule, combined with USPS, FedEx, and UPS commercial delivery bans, forces the use of regional couriers and requires monthly state tax filings due on the 10th. Commercial counterparty risks led management to demand 30%+ cash deposits. Tobacco vaping devices are barred from U.S. distribution pending Premarket Tobacco Product Application (PMTA) authorizations, with the exception of the open-system Nautilus Prime line (PMTA filed September 9, 2020; pending review without a Marketing Denial Order). Ispire faces legacy enforcement exposure for unfiled products distributed between September 9, 2020, and April 30, 2021. For cannabis hardware, Ispire relies on the 21 U.S.C. § 863 paraphernalia exemption, supported by U.S. Court of International Trade import rulings, while excluding shipments to Idaho, Indiana, Kansas, and Nebraska. Concurrently, Department of Justice AG Order No. 6754-2026 (issued April 23, 2026) initiated rescheduling of medical cannabis to Schedule III, subject to DEA administrative review.
Asia-Pacific sales fell 11.04% to $10,918,518 across East and Southeast Asia, while Rest of World sales remained flat at $8,538,253, servicing South Africa, South America, and the Middle East via subsidiary Aspire AME in the United Arab Emirates.
Wholesale distribution channels comprise over 100 non-exclusive distributors across 30+ countries operating on standard 30% deposit and 70% pre-shipment terms. Customer concentration is acute: two UK distributors generated 52.74% ($50.64 million) of total revenue in FY2026.
Table Customer Concentration and Geographic Revenue Exposure — FY2025 vs. FY2026
| Customer Designation | Geographic Territory | FY2025 Revenue ($ USD) | FY2025 Share (%) | FY2026 Revenue ($ USD) | FY2026 Share (%) |
| Customer A (Your-Buyer Int'l Ltd) | United Kingdom & France | $32,736,616 | 25.68% | $26,191,866 | 27.28% |
| Customer B (Major Distributor) | United Kingdom | $17,526,700 | 13.75% | $24,443,424 | 25.46% |
| Top 2 Combined Concentration | United Kingdom / Europe | $50,263,316 | 39.42% | $50,635,290 | 52.74% |
No other distributor accounted for 10% or more of net sales in FY2025 or FY2026.
Table Manufacturing, R&D, and Administrative Facility Footprint
| Facility Designation | Location | Lease Expiration / Ownership | Area (Sq. Ft.) | Operational Role |
| Shenzhen Yi Jia Technology Co., Ltd. | Shenzhen, Guangdong, China | Outsourced Contract Vendor (95% CEO owned) | Undisclosed | Core finished goods contract manufacturer |
| Ispire Malaysia Facility 1 (SAC 3) | Senai, Johor, Malaysia | Leased (Aug 17, 2026; $127,076/yr) | 31,000 | 6 active assembly lines; MITI licensed |
| Ispire Malaysia Facility 2 (Lot 210) | Senai, Johor, Malaysia | Leased (Mar 16, 2030; $594,401/yr) | 131,320 | Expansion site (CIP: $1.17M); up to 70 lines |
| U.S. Global HQ & R&D Hub | Los Angeles, California | Leased (Jul 31, 2027; $872,719/yr) | 37,100 | Corporate executive suite, logistics, R&D |
| Hong Kong Administrative Hub | Kwun Tong, Hong Kong | Leased (Jul 14, 2027; $81,323/yr) | 1,850 | Aspire Science trading and financial admin |
| Vietnam Operations | N/A | None | 0 | Zero operational footprint or assets |
Ispire Technology Inc. owns no real estate, operating across 201,270 leased square feet globally, supported by 88 employees (58 in Malaysia, 17 in the U.S., 13 in Hong Kong; allocating 36 to operations, 9 to manufacturing, and 5 to U.S. R&D). Direct operations in Mainland China employ 0 personnel. Hardware production remains 91% sourced from Shenzhen Yi Jia Technology Co., Ltd., an entity 95% owned by CEO Tuanfang Liu. Purchases from Shenzhen Yi Jia totaled $72.13 million in FY2026 ($94.66 million in FY2025). Finished goods imported directly from China incur a 35% U.S. Section 301 tariff.
To mitigate Chinese tariff exposure, Ispire operationalized assembly in Senai, Johor, Malaysia, securing a full manufacturing license from Malaysia’s Ministry of Investment, Trade and Industry (MITI) on March 17, 2026 (succeeding an interim May 2025 permit). U.S. imports from Malaysia face a 19% tariff, delivering a 1600 bps tariff savings versus China. However, the Malaysian facilities function as downstream assembly hubs reliant on sub-assemblies imported from Chinese vendors, keeping upstream links subject to Chinese cost dynamics. Relocation costs created near-term overhead: fixed annual Malaysian lease liabilities total $721,477; Construction-in-Progress (CIP) absorbs $1,174,204 ($894,919 in FY2025); and Malaysian subsidiary operating pre-tax losses expanded 82.94% to $(2,642,917) from $(1,444,690) in FY2025. Total PP&E net of depreciation fell to $2,423,509 from $2,952,800. Restricted cash on the balance sheet stands at $50,228, deposited as collateral for U.S. Customs standby letters of credit. Additional supply constraints include an exclusive purchase mandate for Bluetooth integrated circuits with Touch Point Worldwide (Berify) at cost plus 20% to support IKE Tech age-gated devices.
HDIN Institutional Verdict
Management points to long-term diversification through its 200+ patent portfolio (expiring between 2022 and 2045), proprietary G-Mesh 1mm porous glass heating elements, and the IKE Tech LLC joint venture. The FDA's May 5, 2026 authorization of four flavored Glas ENDS products (50mg/ml in mango and blueberry flavors), supported by the FDA’s March 11, 2026 Device Access Restriction (DAR) draft guidance and meetings on November 13, 2024, and June 15, 2026, establishes a commercial precedent for IKE's component PMTA (submitted April 2025, accepted May 2025). Ispire plans to submit a pod-system PMTA incorporating IKE DAR within 6 to 12 months.
However, forensic analysis of the FY2026 Form 10-K reveals structural capital distress, pervasive counterparty credit losses, and governance misalignments that challenge this turnaround thesis.
Table Balance Sheet, Liquidity, and Solvency Metrics — FY2025 vs. FY2026
| Balance Sheet & Solvency Component | June 30, 2025 ($ USD) | June 30, 2026 ($ USD) | YoY Variance ($ USD) |
| Cash and Cash Equivalents | $24,351,765 | $19,328,650 | -$5,023,115 |
| Restricted Cash | $0 | $50,228 | +$50,228 |
| Short-Term Investments | $0 | $0 | $0 |
| Accounts Receivable, Net | $39,588,998 | $19,819,480 | -$19,769,518 |
| Gross Accounts Receivable | Undisclosed | $45,957,544 | N/A |
| Allowance for Credit Losses (Topic 326) | Undisclosed | $(26,138,064) | N/A |
| Total Current Assets | $72,908,385 | $45,434,650 | -$27,473,735 |
| Total Current Liabilities | $72,539,554 | $44,631,529 | -$27,908,025 |
| Net Working Capital | $368,831 | $803,121 | +$434,290 |
| Bank Debt Obligations (Current) | $1,952,127 | $805,361 | -$1,146,766 |
| Operating Lease Liabilities (Current) | $1,281,424 | $1,443,763 | +$162,339 |
| Operating Lease Liabilities (Non-Current) | $1,900,750 | $1,893,249 | -$7,501 |
| Unpaid IKE Tech Capital Commitment | Undisclosed | $3,513,863 | N/A |
| Related-Party Accounts Payable (Current) | $26,204,491 | $29,312,960 | +$3,108,469 |
| Related-Party Payable Due (Non-Current) | $47,000,000 | $47,000,000 | $0 |
| Total Liabilities | $101,612,437 | $93,524,778 | -$8,087,659 |
| Common Stock ($0.0001 par; 57,754,471 shares) | $5,775 | $5,775 | $0 |
| Additional Paid-in Capital | $48,655,704 | $52,017,329 | +$3,361,625 |
| Accumulated Deficit | $(48,056,785) | $(81,269,311) | -$33,212,526 |
| Total Stockholders' Equity / (Deficit) | $604,694 | $(29,246,207) | -$29,850,901 |
Stockholders' equity has entered a deficit of $(29,246,207), driven by an accumulated deficit of $(81,269,311). The company's working capital of $803,121 and cash balance of $19,328,650 are sustained through related-party balance sheet restructuring. On September 17, 2026, Shenzhen Yi Jia agreed not to demand payment on $47,000,000 of payables for a minimum of 12 months, allowing non-current classification. Without this forbearance, current liabilities would reach $91,631,529 against current assets of $45,434,650, creating a working capital deficit of $(46,196,879) and immediate going-concern distress. Combined related-party obligations to Shenzhen Yi Jia total $76,312,960 ($29,312,960 in current payables; $47,000,000 in non-current liabilities), representing 81.60% of total corporate liabilities ($93,524,778).
Asset quality remains pressured: gross trade receivables of $45.96 million carry an allowance for credit losses of $26,138,064 (56.87% of gross balance), reflecting structural liquidity distress across U.S. cannabis counterparties. Additional debt obligations include $805,361 in current bank borrowings (non-current bank debt: $0), $3,337,012 in total lease liabilities, and $3,513,863 in unpaid capital commitments to IKE Tech LLC under a $9.0 million initial obligation.
Corporate governance structures provide limited independent checks on capital allocation. Under Nasdaq Marketplace Rule 5605(a)(2), Ispire qualifies as a "controlled company." Chairman and CEO Tuanfang Liu and his spouse, director Jiangyan Zhu, hold beneficial ownership of 35,750,000 common shares, representing 61.9% of total voting power (33,250,000 shares / 57.6% via Pride Worldwide Investment Ltd.; 2,500,000 shares / 4.3% via Honor Epic International Ltd.). Executive officers and directors as a group (7 persons) control 36,523,856 shares (63.2%). Independent directors Brent Cox (Audit/Compensation Chair; Audit Committee Financial Expert), Christopher Robert Burch (Audit Committee Financial Expert), and John Fargis hold 139,863 shares (0.2%), 122,944 shares (0.2%), and 120,385 shares (0.2%), respectively. President and Chief Legal Officer Steven Przybyla holds 390,664 shares (0.7%). Authorized capital comprises 140,000,000 common shares ($0.0001 par) and 10,000,000 preferred shares ($0.0001 par; 0 issued).
Table Executive Compensation by Fiscal Year — FY2025 vs. FY2026
| Executive Officer / Director | Fiscal Year | Base Salary ($ USD) | Discretionary Bonus ($ USD) | Stock Awards ($ USD) | Option Awards ($ USD) | Total Compensation ($ USD) |
| Tuanfang Liu (CEO & Chairman) | FY2026 | $245,785 | $0 | $0 | $0 | $245,785 |
| FY2025 | $246,476 | $0 | $0 | $0 | $246,476 | |
| Steven Przybyla (President & CLO) | FY2026 | $400,000 | $0 | $0 | $0 | $400,000 |
| FY2025 | $398,637 | $250,000 | $2,650,547 | $0 | $3,299,184 | |
| Jie (Jay) Yu (CFO) | FY2026 | $200,725 | $0 | $0 | $0 | $200,725 |
| FY2025 | $201,289 | $0 | $0 | $0 | $201,289 | |
| Michael Wang (Former Co-CEO) | FY2026 | $600,000 | $0 | $0 | $0 | $600,000 |
| FY2025 | $597,159 | $400,000 | $1,356,936 | $(5,537,903) | $(3,183,808) |
Executive compensation for Tuanfang Liu (HKD 1,920,000 annually) and Jie Yu is paid in Hong Kong Dollars and translated at 7.8117 HKD/USD. Michael Wang departed as Co-CEO on July 16, 2026, leaving Tuanfang Liu as sole CEO, while Steven Przybyla was named President on August 11, 2026. Compensation excludes formulaic KPIs tied to GAAP operating profit or cash flow. While CEO Tuanfang Liu receives a modest salary of $245,785 and holds 0 unvested options or RSUs, his 95% ownership of Shenzhen Yi Jia connects his primary financial returns to supplier revenue ($72.13 million in FY2026 purchases) rather than public equity performance.
Board oversight showed minimal activity in FY2026: while the Board met or acted by written consent 6 times and the Audit Committee met 4 times, the Compensation Committee met 0 times and the Nominating and Corporate Governance Committee—chaired by non-independent CEO Tuanfang Liu—met 0 times.
Management concluded that Internal Control over Financial Reporting (ICFR) was ineffective as of June 30, 2026, under COSO 2013 due to a newly identified material weakness in Information Technology General Controls (ITGCs) spanning logical access security, cybersecurity governance, and service organization oversight. This follows the remediation of two FY2025 material weaknesses relating to accounting estimates (Topic 326 credit losses and inventory reserves) and U.S. GAAP/SEC accounting personnel shortages. As an Emerging Growth Company under the JOBS Act, Ispire remains exempt from SOX 404(b) independent auditor attestation, leaving internal control evaluations unverified by independent auditor Marcum Asia CPAs LLP.
With gross margin at 12.81%, a book equity deficit of $(29.25 million), $76.31 million in related-party liabilities, and 52.74% of revenue tied to two UK distributors confronting regulatory bans, Ispire Technology Inc.'s operational profile reflects substantial counterparty, supply-chain, and balance-sheet risk.
Presentation Download & Video Access
- Presentation Download: Click the PDF download link under 'Related Topics' to access the full institutional presentation of this report.
- Video Link: Click this link to watch the HDIN analyst briefing on YouTube.
About HDIN Research
HDIN Research is a premier global market intelligence and strategic advisory firm specializing in institutional-grade financial analysis, supply chain audits, and macroeconomic forecasting. Our dedicated sector analysts deliver actionable, data-driven insights tailored for private equity, hedge funds, and corporate strategy teams. Visit us at http://www.hdinresearch.com.
2026 AI Transparency Footer
This intelligence report was authored by HDIN Research analysts following a rigorous audit of official corporate filings. AI was utilized for massive-scale data synthesis and structural drafting, ensuring 100% inclusion of reported data points. All strategic insights, financial modeling, and final verdicts were verified by our editorial board to ensure professional accuracy and compliance with 2026 Google Search E-E-A-T standards.