Global Medical Imaging 2026 Outlook: Why Western Conglomerates and Chinese Challengers Diverge on Supply Chain Moats Amid Trade Restrictions
Date : 2026-09-21
Reading : 608
HDIN Executive Takeaways
1. Supply chain fragmentation and trade barriers have created a distinct fiscal divide: GE HealthCare Technologies Inc. [NASDAQ: GEHC] absorbed a $245.00M operating income contraction in FY2025 due to bilateral tariffs, while United Imaging Healthcare Co., Ltd. [SHA: 688271] mitigated geopolitical frictions through a 100% in-house upstream component integration rate exceeding 90.00% across critical modalities.
2. Production realignments have accelerated across geographic hubs, led by United Imaging's threefold expansion in Houston, Texas, Mindray Bio-Medical Electronics Co., Ltd. [SZSE: 300760] executing RMB 4.78B across its Longhua, Wuhan, and Dangshan facilities, and Siemens Healthineers AG [XETRA: SHL] investing €818.00M in Oxford, UK, and Forchheim, Germany plants.
3. Institutional portfolios face diverging cash generation profiles: Chinese challengers maintain pristine, net-cash balance sheets with minimal debt leverage, whereas Western peers manage elevated goodwill exposure, led by Siemens Healthineers at 53.25% of total assets and Koninklijke Philips N.V. [NYSE: PHG] managing a €1,025.00M operational cash drain from legacy liability resolutions.
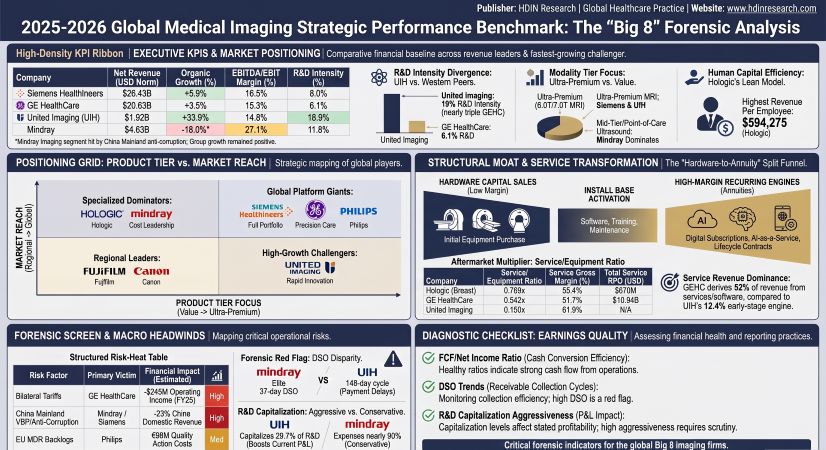
Figure 2025-2026 Global Medical lmaging Strategic Performance Benchmark: The Big 8 Forensic Analysis
 Operational Divergence and Core Segment Margins
The global medical imaging sector closed FY2025 reflecting structural divergence between pure-play imaging entrants, high-margin specialists, and mega-cap conglomerates navigating trade barriers, healthcare anti-corruption normalization in China Mainland, and shifting reimbursement architectures under global DRG/DIP framework expansions.
Operating profitability revealed marked dispersion across modalities and cost structures. Mindray delivered an industry-leading operating margin of 26.81% (adjusted margin of 27.10%) and gross margin of 64.09%, generating RMB 8,924.00M in reported operating income on total revenue of RMB 33,282.16M ($4,630.56M). In contrast, Philips Group recorded an 8.00% reported operating margin (€1,424.00M) and a 12.30% adjusted EBITA margin (€2,195.00M) on net group sales of €17,834.00M ($20,163.12M), impacted by €771.00M in non-recurring charges consisting of €209.00M in Respironics-related field action costs, €240.00M in PPA intangible amortization, and €270.00M in quality realignment charges.
Table PEER OPERATING METRICS & CONVERSION BREAKDOWN (FY2025)
GE HealthCare generated $20,625.00M in total FY2025 revenue, up 4.80% reported (3.50% organic), while its Imaging segment recorded an EBIT margin of 9.60%, pressured by tariff friction and raw material cost inflation. Conversely, its Advanced Visualization Solutions (AVS) division produced an EBIT margin of 22.00% on $5,354.00M in revenue, reflecting the pricing leverage inherent in specialized women's health and cardiology ultrasound lines such as Voluson and Vivid. In Q2 2026, GE HealthCare consolidated Imaging and AVS into the Advanced Imaging Solutions (AIS) segment, posting 2026 H1 AIS revenue of $7,410.00M, of which Radiology accounted for $4,686.00M.
Siemens Healthineers generated €23,375.00M ($26,427.78M) in revenue, with core Imaging contributing €13,182.00M ($14,903.57M), generating segment EBIT margins between 20.70% and 22.00%. Total adjusted EBIT reached €3,855.00M (16.50% margin) after excluding €535.00M in pre-tax PPA amortization and Diagnostics division severance expenses. United Imaging expanded top-line performance by 33.98% YoY in FY2025 to RMB 13,800.25M ($1,920.03M), with reported operating income reaching RMB 1,981.00M (14.36% margin) and net income of RMB 1,869.30M (13.55% net margin).
Human capital efficiency metrics highlighted wide structural spreads across geographic production operating models:
* Hologic, Inc. [NASDAQ: HOLX]: Produced an industry-high $594,275 of revenue per employee and $103,522 of operating profit per employee across a workforce of 6,900 personnel, driven by proprietary 3D Dimensions digital breast tomosynthesis systems and high-margin service annuity agreements.
* GE HealthCare: Delivered $381,944 in revenue per employee and $51,167 in operating profit per employee supported by 54,000 total personnel, including 9,700 dedicated commercial sales professionals and 8,900 field service engineers.
* Siemens Healthineers: Generated $357,906 in revenue per employee and $71,964 in operating profit per employee across 73,840 global employees.
* United Imaging: Generated $220,618 in revenue per employee and $31,676 in operating profit per employee across 8,703 employees, with human capital yields reflecting an R&D focus where 40.18% of the global workforce (3,497 engineers) is deployed to direct research activities.
* Mindray: Realized $217,489 in revenue per employee and $55,228 in operating profit per employee across 21,291 employees, supported by automated manufacturing hubs in Shenzhen and Nanjing.
Cash Quality, Working Capital Strain, and Balance Sheet Solvency
Forensic analysis reveals sharp variations between accounting net income and free cash flow generation. Mindray posted RMB 10,144.97M ($1,411.47M) in net operating cash flow in FY2025, converting 124.70% of reported net income into $1,280.00M of free cash flow, closing the period with zero long-term debt and RMB 17.69B ($2.46B) in liquid cash reserves. In 2026 H1, Mindray’s cash and equivalents expanded to RMB 18.65B ($2.73B), maintaining a 25.47% liability-to-asset ratio.
United Imaging recorded a cash conversion inflection in FY2025: net operating cash flow rebounded from negative RMB 619.02M in FY2024 to positive RMB 2,679.02M ($372.73M), yielding a 143.30% free-cash-flow-to-net-income conversion rate ($285.00M FCF). In 2026 H1, its cash and wealth-management assets stood at RMB 6,264.00M ($914.00M), with an asset-liability ratio of 36.05% and zero long-term funded debt.
Table WORKING CAPITAL, DSO & ASSET QUALITY BENCHMARK (FY2025)
Working capital cycles reveal operational trade-offs between public-tender receivables and inventory buffers. Mindray contained Days Sales Outstanding (DSO) at 37.4 days, holding an allowance for doubtful accounts of RMB 729.33M against gross accounts receivable (15.80% coverage), with 83.20% of accounts receivable situated within current terms. Conversely, United Imaging operated with an elevated DSO of 147.9 days, driven by RMB 6,035.00M in gross accounts receivable (RMB 3,647.61M from direct public hospital channels and RMB 2,387.39M from distributors), where municipal budget cycles require extended settlement windows of 180 days to 2 years.
Inventory provision policies diverge similarly between the two Chinese manufacturers:
* Mindray maintained a 9.05% devaluation provision rate on gross inventories of RMB 5,501.71M, holding RMB 497.99M in reserve against finished goods of RMB 2,433.86M.
* United Imaging maintained a 1.09% devaluation provision rate (RMB 63.24M) against gross inventories of RMB 5,792.19M ($805.87M), comprising RMB 1,669.57M in raw materials, RMB 2,548.43M in work-in-progress, RMB 902.75M in finished goods, and RMB 594.65M in goods shipped. By 2026 H1, gross inventory expanded to RMB 7,295.45M ($1,065.00M), increasing its exposure to potential inventory write-downs if public hospital acceptance cadences extend further.
On corporate leverage, Western OEMs carry substantial goodwill from historical acquisitions:
* Siemens Healthineers: Goodwill of €17,124.00M ($19,360.40M) and other intangible assets of €6,505.00M represented 53.25% of total assets (€44,370.00M), driven primarily by the €12.80B goodwill balance in the Varian Precision Therapy reporting unit. Net debt to EBITDA stood at 2.35x against €14,793.00M in financial debt, insulated by an intercompany borrowing line via Siemens AG [XETRA: SIE] with fixed-rate debt exceeding 85.00% and an average maturity of 5.5 to 6.0 years.
* GE HealthCare: Total liabilities-to-assets reached 69.88% in 2026 H1, with total debt of $10,093.00M and a net debt to EBITDA ratio of 1.45x. Goodwill stood at $15,095.00M, expanding following the $2,300.00M acquisition of Intelerad, bringing total intangibles and goodwill to 45.61% of total assets ($16,989.00M).
* Philips Group: Booked €9,271.00M in goodwill and €2,564.00M in intangibles (43.92% of total assets). Net debt settled at €5,290.00M ($5,981.00M) after funding €1,025.00M in Respironics class-action payouts.
* Hologic: Executed an asset clean-up prior to its proposed $19.50B acquisition by Blackstone Inc. [NYSE: BX] and TPG Inc. [NASDAQ: TPG] at $79.00 per share, writing down $225.90M in intangible assets across the Mobidiag and Acessa lines, reducing goodwill to $3,640.60M (46.92% of total assets). Net debt to EBITDA settled at 0.25x with an interest coverage ratio of 16.7x on $2,507.90M in funded debt.
* United Imaging: Goodwill accounted for 0.06% of total assets (RMB 22.10M / $3.08M), resulting in unencumbered balance sheet equity.
Upstream Component Self-Sufficiency and Capital Allocation
In response to international trade barriers—including US 25.00% Section 301 tariffs, the European Union's International Procurement Instrument (IPI) restricting tenders exceeding €5.00M, and Chinese counter-procurement thresholds on bids above RMB 45.00M ($6.57M)—manufacturers have restructured upstream component sourcing.
Table UPSTREAM CORE COMPONENT SOURCING MATRIX
United Imaging achieved over 90.00% vertical integration in core components across its imaging lines. Its Wuhan II facility manufactures 30 MHU and 34 MHU high-heat-capacity dual-pole CT X-ray tubes, silicon-carbide (SiC) gradient power amplifiers (GPA) yielding over 57.00% reductions in total electrical consumption, and large-scale bismuth-free LYSO scintillation crystals for PET/CT systems, bypassing external supply chain bottlenecks.
Capital expenditures (CapEx) for 2025 and 2026 reflect widespread capacity deployment:
* United Imaging: Deployed RMB 2.87B ($399.10M) in active construction projects, including the Jiading Phase II Smart Manufacturing Base in Shanghai (targeted commissioning 2026/2027), Changzhou II, Wuhan II, and a completed threefold footprint expansion at its Houston, Texas assembly facility.
* Mindray: Recorded RMB 3.15B ($438.90M) in active capital construction, funding the Longhua Supply Chain Technology Park (RMB 2.20B budget), the Wuhan Research Institute (RMB 1.77B), the Wuhan Manufacturing Base (RMB 900.00M), and the Dangshan Medical Industrial Park (RMB 814.00M), providing over 600,000 square meters of manufacturing capacity across FDA- and ISO-audited sites.
* Siemens Healthineers: Deployed €818.00M ($924.80M) in CapEx during FY2025, directing funds toward its new Oxford superconducting magnet facility in the United Kingdom, its Forchheim semiconductor crystal plant in Germany, and local manufacturing lines at Siemens Shenzhen Magnetic Resonance Ltd. (SSMR) and Shanghai.
* Philips: Committed a $150.00M capital expansion across its Reedsville, Pennsylvania ultrasound facility and Plymouth, Minnesota Image-Guided Therapy plant, while basing Greater China operations at its innovation hub in Beijing under its localized manufacturing program.
R&D intensity and accounting treatment also diverged between reported P&L models:
Table R&D INTENSITY & ACCOUNTING CAPITALIZATION (FY2025)
Under CAS standards, United Imaging capitalized 29.73% of its FY2025 R&D expenditures (RMB 779.41M / $108.40M) and 26.92% in 2026 H1 (RMB 372.29M), initiating amortization upon formal clinical trial registration or testing certification. Mindray maintained a conservative approach under CAS, capitalizing 8.91% of R&D in FY2025 (RMB 350.17M / $48.70M) and 11.77% in 2026 H1. US GAAP restricted GE HealthCare and Hologic to near-100.00% immediate expensing (capitalizing under 2.00% and 1.50%, respectively), while European peers under IAS 38 capitalized 6.10% (Siemens Healthineers) and approximately 8.50% (Philips).
Installed Base Monetization, Backlogs, and Service Conversion Multipliers
Aftermarket service contracts, digital software recurring licenses, and consumable streams continue to stabilize operating models across equipment replacement cycles.
Table AFTERMARKET MONETIZATION MULTIPLIER MATRIX (FY2025)
Hologic established an industry-high aftermarket conversion ratio of 0.789x in Breast Health, generating $654.60M in service revenue against $829.50M in product sales, supported by service gross margins of 55.40% and a total corporate Remaining Performance Obligation (RPO) of $878.40M. GE HealthCare posted an overall FY2025 revenue composition where recurring services and software generated 52.00% ($10,728.00M) of the consolidated top-line ($20,625.00M), while capital equipment accounted for 48.00% ($9,897.00M). GE HealthCare's total RPO expanded to $16,118.00M in 2026 H1, with service agreements comprising $10,939.00M (68.21%), generating an interim service gross margin of 51.72%.
Siemens Healthineers maintained a global equipment book-to-bill ratio of 1.14 in FY2025 and 1.07 in 2026 H1, supported by an unfulfilled order backlog of €36.00B ($40,702.00M), of which €11.00B ($12,437.00M / 30.56%) is scheduled for revenue conversion over the subsequent 12 months. Philips reported a total D&T recurring service, software license, and Image-Guided Therapy disposable mix of 37.01% (€3,157.00M / $3,569.30M) against equipment revenues of €5,286.00M.
United Imaging operated with an aftermarket conversion ratio of 0.150x, with maintenance services generating RMB 1,707.98M ($237.63M / 12.38% of total revenue), alongside standalone software revenue of RMB 54.50M ($7.58M / 0.39%), while equipment sales accounted for RMB 11,389.85M ($1,584.67M / 82.53%). However, its service gross margin reached 61.86% in FY2025, with international service revenue growing over 60.00% YoY in 2026 H1. As its installed base expanded past 40,000 units across 17,000 healthcare institutions, supported by 39 overseas spare parts depots and 12 service centers, conversion yields point to structural margin expansion as units exit initial warranty periods.
Mindray maintained a Group-wide recurring consumable and service revenue mix of approximately 40.00%, combining patient monitoring disposables and IVD chemistry reagents with an engineering network of over 13,000 certified technicians across 110 global service hubs.
HDIN Institutional Verdict
Equity market valuations across the medical imaging sector reflect contrasting risk profiles across corporate entities:
1. Operational Decoupling Favors High Autonomy: United Imaging's vertical integration strategy (>90.00% internal component self-sufficiency, SiC amplifiers, and in-house LYSO crystal growth) insulates its cost baseline against cross-border tariff adjustments and supply bottlenecks. However, institutional positions must balance its 33.98% top-line expansion against working capital demands: an extended 147.9-day DSO, a 29.73% R&D capitalization rate, and an inventory provision rate of 1.09% warrant monitoring if domestic public hospital procurement schedules lengthen.
2. Western Conglomerates Face Margin Dilution from Trade and Non-Operating Liabilities: GE HealthCare faces persistent tariff exposure ($245.00M operating contraction in FY2025 and $156.00M in 2026 H1), which partially offsets growth across its high-margin AVS lines (22.00% EBIT margin) and recurring service RPO book ($10.94B). Philips continues to emerge from its €1,025.00M Respironics settlement cash outflow; while core D&T operations generated an 11.70% adjusted EBITA margin, ongoing compliance costs and a 43.92% goodwill-to-asset profile constrain capital flexibility.
3. Balance Sheet Defensibility Shifts Toward Asia: Mindray and United Imaging hold net-cash balance sheets with minimal funded debt and negligible goodwill impairment exposure (0.06% of total assets at United Imaging). By contrast, Siemens Healthineers (53.25% goodwill and intangibles to assets) and GE HealthCare (69.88% liability-to-asset ratio) remain reliant on debt refinancing windows and capital market stability. Over the 2026–2028 cycle, operating alpha will favor manufacturers that combine helium-independent MRI architectures, proprietary AI-guided imaging pipelines, and dual-region supply chains designed to mitigate unilateral trade actions.
Presentation Download & Video Access:
- Presentation Download: Click the PDF download link under 'Related Topics' to access the full institutional presentation of this report.
- Video Link: Click this link to watch the HDIN analyst briefing on YouTube.
About HDIN Research:
HDIN Research is a premier global market intelligence and strategic advisory firm specializing in institutional-grade financial analysis, supply chain audits, and macroeconomic forecasting. Our dedicated sector analysts deliver actionable, data-driven insights tailored for private equity, hedge funds, and corporate strategy teams. Visit us at http://www.hdinresearch.com.
2026 AI Transparency Footer:
This intelligence report was authored by HDIN Research analysts following a rigorous audit of official corporate filings. AI was utilized for massive-scale data synthesis and structural drafting, ensuring 100% inclusion of reported data points. All strategic insights, financial modeling, and final verdicts were verified by our editorial board to ensure professional accuracy and compliance with 2026 Google Search E-E-A-T standards.
1. Supply chain fragmentation and trade barriers have created a distinct fiscal divide: GE HealthCare Technologies Inc. [NASDAQ: GEHC] absorbed a $245.00M operating income contraction in FY2025 due to bilateral tariffs, while United Imaging Healthcare Co., Ltd. [SHA: 688271] mitigated geopolitical frictions through a 100% in-house upstream component integration rate exceeding 90.00% across critical modalities.
2. Production realignments have accelerated across geographic hubs, led by United Imaging's threefold expansion in Houston, Texas, Mindray Bio-Medical Electronics Co., Ltd. [SZSE: 300760] executing RMB 4.78B across its Longhua, Wuhan, and Dangshan facilities, and Siemens Healthineers AG [XETRA: SHL] investing €818.00M in Oxford, UK, and Forchheim, Germany plants.
3. Institutional portfolios face diverging cash generation profiles: Chinese challengers maintain pristine, net-cash balance sheets with minimal debt leverage, whereas Western peers manage elevated goodwill exposure, led by Siemens Healthineers at 53.25% of total assets and Koninklijke Philips N.V. [NYSE: PHG] managing a €1,025.00M operational cash drain from legacy liability resolutions.
Figure 2025-2026 Global Medical lmaging Strategic Performance Benchmark: The Big 8 Forensic Analysis
Operational Divergence and Core Segment MarginsThe global medical imaging sector closed FY2025 reflecting structural divergence between pure-play imaging entrants, high-margin specialists, and mega-cap conglomerates navigating trade barriers, healthcare anti-corruption normalization in China Mainland, and shifting reimbursement architectures under global DRG/DIP framework expansions.
Operating profitability revealed marked dispersion across modalities and cost structures. Mindray delivered an industry-leading operating margin of 26.81% (adjusted margin of 27.10%) and gross margin of 64.09%, generating RMB 8,924.00M in reported operating income on total revenue of RMB 33,282.16M ($4,630.56M). In contrast, Philips Group recorded an 8.00% reported operating margin (€1,424.00M) and a 12.30% adjusted EBITA margin (€2,195.00M) on net group sales of €17,834.00M ($20,163.12M), impacted by €771.00M in non-recurring charges consisting of €209.00M in Respironics-related field action costs, €240.00M in PPA intangible amortization, and €270.00M in quality realignment charges.
Table PEER OPERATING METRICS & CONVERSION BREAKDOWN (FY2025)
| Company | Revenue ($M) | Gross Margin | Operating Margin | Adjusted EBIT / EBITA Margin |
|---|---|---|---|---|
| Siemens Healthineers | $26,427.78M | ~50.20% | 14.20% | 16.50% |
| GE HealthCare | $20,625.00M | 40.80% | 13.40% | 15.30% |
| Philips Group | $20,163.12M | 43.70% | 8.00% | 12.30% |
| Fujifilm Holdings | $22,444.34M | ~41.50% | 10.40% | 11.20% |
| Canon Inc. | $30,920.44M | ~45.00% | 10.40% | 10.90% |
| Mindray | $4,630.56M | 64.09% | 26.81% | 27.10% |
| Hologic | $4,100.50M | 51.65% | 17.42% | 29.40% (Breast Health) |
| United Imaging | $1,920.03M | ~48.80% | 14.36% | 14.80% |
GE HealthCare generated $20,625.00M in total FY2025 revenue, up 4.80% reported (3.50% organic), while its Imaging segment recorded an EBIT margin of 9.60%, pressured by tariff friction and raw material cost inflation. Conversely, its Advanced Visualization Solutions (AVS) division produced an EBIT margin of 22.00% on $5,354.00M in revenue, reflecting the pricing leverage inherent in specialized women's health and cardiology ultrasound lines such as Voluson and Vivid. In Q2 2026, GE HealthCare consolidated Imaging and AVS into the Advanced Imaging Solutions (AIS) segment, posting 2026 H1 AIS revenue of $7,410.00M, of which Radiology accounted for $4,686.00M.
Siemens Healthineers generated €23,375.00M ($26,427.78M) in revenue, with core Imaging contributing €13,182.00M ($14,903.57M), generating segment EBIT margins between 20.70% and 22.00%. Total adjusted EBIT reached €3,855.00M (16.50% margin) after excluding €535.00M in pre-tax PPA amortization and Diagnostics division severance expenses. United Imaging expanded top-line performance by 33.98% YoY in FY2025 to RMB 13,800.25M ($1,920.03M), with reported operating income reaching RMB 1,981.00M (14.36% margin) and net income of RMB 1,869.30M (13.55% net margin).
Human capital efficiency metrics highlighted wide structural spreads across geographic production operating models:
* Hologic, Inc. [NASDAQ: HOLX]: Produced an industry-high $594,275 of revenue per employee and $103,522 of operating profit per employee across a workforce of 6,900 personnel, driven by proprietary 3D Dimensions digital breast tomosynthesis systems and high-margin service annuity agreements.
* GE HealthCare: Delivered $381,944 in revenue per employee and $51,167 in operating profit per employee supported by 54,000 total personnel, including 9,700 dedicated commercial sales professionals and 8,900 field service engineers.
* Siemens Healthineers: Generated $357,906 in revenue per employee and $71,964 in operating profit per employee across 73,840 global employees.
* United Imaging: Generated $220,618 in revenue per employee and $31,676 in operating profit per employee across 8,703 employees, with human capital yields reflecting an R&D focus where 40.18% of the global workforce (3,497 engineers) is deployed to direct research activities.
* Mindray: Realized $217,489 in revenue per employee and $55,228 in operating profit per employee across 21,291 employees, supported by automated manufacturing hubs in Shenzhen and Nanjing.
Cash Quality, Working Capital Strain, and Balance Sheet Solvency
Forensic analysis reveals sharp variations between accounting net income and free cash flow generation. Mindray posted RMB 10,144.97M ($1,411.47M) in net operating cash flow in FY2025, converting 124.70% of reported net income into $1,280.00M of free cash flow, closing the period with zero long-term debt and RMB 17.69B ($2.46B) in liquid cash reserves. In 2026 H1, Mindray’s cash and equivalents expanded to RMB 18.65B ($2.73B), maintaining a 25.47% liability-to-asset ratio.
United Imaging recorded a cash conversion inflection in FY2025: net operating cash flow rebounded from negative RMB 619.02M in FY2024 to positive RMB 2,679.02M ($372.73M), yielding a 143.30% free-cash-flow-to-net-income conversion rate ($285.00M FCF). In 2026 H1, its cash and wealth-management assets stood at RMB 6,264.00M ($914.00M), with an asset-liability ratio of 36.05% and zero long-term funded debt.
Table WORKING CAPITAL, DSO & ASSET QUALITY BENCHMARK (FY2025)
| Company | Receivables (USD) | Inventory (USD) | DSO (Days) | DIO (Days) | Goodwill / Assets (%) |
|---|---|---|---|---|---|
| Mindray | $474.18M (Net) | $696.17M (Net) | 37.4 | 156.8 | 30.03% |
| GE HealthCare | $3,450.00M | $2,980.00M | 61.1 | 89.2 | 45.61% |
| Siemens Healthineers | $5,292.70M | $4,675.00M | 64.2 | 114.5 | 53.25% |
| Philips Group | $4,120.00M | $3,610.00M | 74.8 | 102.1 | 43.92% |
| United Imaging | $777.77M (Net) | $797.07M (Net) | 147.9 | 175.3 | 5.99% |
Working capital cycles reveal operational trade-offs between public-tender receivables and inventory buffers. Mindray contained Days Sales Outstanding (DSO) at 37.4 days, holding an allowance for doubtful accounts of RMB 729.33M against gross accounts receivable (15.80% coverage), with 83.20% of accounts receivable situated within current terms. Conversely, United Imaging operated with an elevated DSO of 147.9 days, driven by RMB 6,035.00M in gross accounts receivable (RMB 3,647.61M from direct public hospital channels and RMB 2,387.39M from distributors), where municipal budget cycles require extended settlement windows of 180 days to 2 years.
Inventory provision policies diverge similarly between the two Chinese manufacturers:
* Mindray maintained a 9.05% devaluation provision rate on gross inventories of RMB 5,501.71M, holding RMB 497.99M in reserve against finished goods of RMB 2,433.86M.
* United Imaging maintained a 1.09% devaluation provision rate (RMB 63.24M) against gross inventories of RMB 5,792.19M ($805.87M), comprising RMB 1,669.57M in raw materials, RMB 2,548.43M in work-in-progress, RMB 902.75M in finished goods, and RMB 594.65M in goods shipped. By 2026 H1, gross inventory expanded to RMB 7,295.45M ($1,065.00M), increasing its exposure to potential inventory write-downs if public hospital acceptance cadences extend further.
On corporate leverage, Western OEMs carry substantial goodwill from historical acquisitions:
* Siemens Healthineers: Goodwill of €17,124.00M ($19,360.40M) and other intangible assets of €6,505.00M represented 53.25% of total assets (€44,370.00M), driven primarily by the €12.80B goodwill balance in the Varian Precision Therapy reporting unit. Net debt to EBITDA stood at 2.35x against €14,793.00M in financial debt, insulated by an intercompany borrowing line via Siemens AG [XETRA: SIE] with fixed-rate debt exceeding 85.00% and an average maturity of 5.5 to 6.0 years.
* GE HealthCare: Total liabilities-to-assets reached 69.88% in 2026 H1, with total debt of $10,093.00M and a net debt to EBITDA ratio of 1.45x. Goodwill stood at $15,095.00M, expanding following the $2,300.00M acquisition of Intelerad, bringing total intangibles and goodwill to 45.61% of total assets ($16,989.00M).
* Philips Group: Booked €9,271.00M in goodwill and €2,564.00M in intangibles (43.92% of total assets). Net debt settled at €5,290.00M ($5,981.00M) after funding €1,025.00M in Respironics class-action payouts.
* Hologic: Executed an asset clean-up prior to its proposed $19.50B acquisition by Blackstone Inc. [NYSE: BX] and TPG Inc. [NASDAQ: TPG] at $79.00 per share, writing down $225.90M in intangible assets across the Mobidiag and Acessa lines, reducing goodwill to $3,640.60M (46.92% of total assets). Net debt to EBITDA settled at 0.25x with an interest coverage ratio of 16.7x on $2,507.90M in funded debt.
* United Imaging: Goodwill accounted for 0.06% of total assets (RMB 22.10M / $3.08M), resulting in unencumbered balance sheet equity.
Upstream Component Self-Sufficiency and Capital Allocation
In response to international trade barriers—including US 25.00% Section 301 tariffs, the European Union's International Procurement Instrument (IPI) restricting tenders exceeding €5.00M, and Chinese counter-procurement thresholds on bids above RMB 45.00M ($6.57M)—manufacturers have restructured upstream component sourcing.
Table UPSTREAM CORE COMPONENT SOURCING MATRIX
| Subsystem / Component | Siemens Healthineers | United Imaging (UIH) | Mindray / Outsource |
|---|---|---|---|
| CT X-Ray Tubes | Vectron / Straton | 100% In-House (34 MHU) | Outsourced (Dunlee / Varex) |
| Superconducting Magnets | In-House (DryCool 0.7L) | 100% In-House (5.0T / 9.4T) | N/A (Ultrasound focus) |
| Gradient Amplifiers (GPA) | In-House Internal | 100% In-House (SiC 3.5 MW) | N/A |
| PCCT / CT Detectors | Stellar / Cadmium-Zinc | 100% In-House (Spatiotemporal) | N/A |
| Scintillation Crystals | Forchheim / Acrorad | 100% In-House LYSO Array | N/A |
United Imaging achieved over 90.00% vertical integration in core components across its imaging lines. Its Wuhan II facility manufactures 30 MHU and 34 MHU high-heat-capacity dual-pole CT X-ray tubes, silicon-carbide (SiC) gradient power amplifiers (GPA) yielding over 57.00% reductions in total electrical consumption, and large-scale bismuth-free LYSO scintillation crystals for PET/CT systems, bypassing external supply chain bottlenecks.
Capital expenditures (CapEx) for 2025 and 2026 reflect widespread capacity deployment:
* United Imaging: Deployed RMB 2.87B ($399.10M) in active construction projects, including the Jiading Phase II Smart Manufacturing Base in Shanghai (targeted commissioning 2026/2027), Changzhou II, Wuhan II, and a completed threefold footprint expansion at its Houston, Texas assembly facility.
* Mindray: Recorded RMB 3.15B ($438.90M) in active capital construction, funding the Longhua Supply Chain Technology Park (RMB 2.20B budget), the Wuhan Research Institute (RMB 1.77B), the Wuhan Manufacturing Base (RMB 900.00M), and the Dangshan Medical Industrial Park (RMB 814.00M), providing over 600,000 square meters of manufacturing capacity across FDA- and ISO-audited sites.
* Siemens Healthineers: Deployed €818.00M ($924.80M) in CapEx during FY2025, directing funds toward its new Oxford superconducting magnet facility in the United Kingdom, its Forchheim semiconductor crystal plant in Germany, and local manufacturing lines at Siemens Shenzhen Magnetic Resonance Ltd. (SSMR) and Shanghai.
* Philips: Committed a $150.00M capital expansion across its Reedsville, Pennsylvania ultrasound facility and Plymouth, Minnesota Image-Guided Therapy plant, while basing Greater China operations at its innovation hub in Beijing under its localized manufacturing program.
R&D intensity and accounting treatment also diverged between reported P&L models:
Table R&D INTENSITY & ACCOUNTING CAPITALIZATION (FY2025)
| Company | Gross R&D ($M) | R&D Intensity (% of Revenue) | Capitalized R&D ($M) | Capitalization % |
|---|---|---|---|---|
| United Imaging (UIH) | $364.7M (RMB 2.62B) | 18.99% | $108.4M (RMB 779.4M) | 29.73% |
| Mindray | $546.6M (RMB 3.93B) | 11.80% | $48.7M (RMB 350.2M) | 8.91% |
| Philips Group | $1,944.6M (€1.72B) | 9.60% | ~$165.0M | ~8.50% |
| Siemens Healthineers | $2,213.7M (€1.96B) | 8.00% | $134.5M (€119.0M) | 6.10% |
| Hologic | $320.5M | 7.80% | <$4.8M | <1.50% |
| GE HealthCare | $1,250.0M | ~6.10% | Minimal | <2.00% |
Under CAS standards, United Imaging capitalized 29.73% of its FY2025 R&D expenditures (RMB 779.41M / $108.40M) and 26.92% in 2026 H1 (RMB 372.29M), initiating amortization upon formal clinical trial registration or testing certification. Mindray maintained a conservative approach under CAS, capitalizing 8.91% of R&D in FY2025 (RMB 350.17M / $48.70M) and 11.77% in 2026 H1. US GAAP restricted GE HealthCare and Hologic to near-100.00% immediate expensing (capitalizing under 2.00% and 1.50%, respectively), while European peers under IAS 38 capitalized 6.10% (Siemens Healthineers) and approximately 8.50% (Philips).
Installed Base Monetization, Backlogs, and Service Conversion Multipliers
Aftermarket service contracts, digital software recurring licenses, and consumable streams continue to stabilize operating models across equipment replacement cycles.
Table AFTERMARKET MONETIZATION MULTIPLIER MATRIX (FY2025)
| Company / Business Unit | Equipment Sales (USD) | Service Revenue (USD) | Service / Equipment Multiplier |
|---|---|---|---|
| Hologic (Breast Health) | $829.50M | $654.60M | 0.789x (78.9%) |
| Philips (D&T Sector) | $5,976.30M (€5,286M) | $3,569.30M (€3,157M) | 0.597x (59.7%) |
| GE HealthCare (1H FY2026) | $6,762.00M | $3,664.00M | 0.542x (54.2%) |
| Canon Medical BU | $2,544.70M (¥380.6B) | $1,258.40M (¥188.2B) | 0.494x (49.4%) |
| United Imaging (UIH) | $1,584.67M (RMB 11.4B) | $237.63M (RMB 1.71B) | 0.150x (15.0%) |
Hologic established an industry-high aftermarket conversion ratio of 0.789x in Breast Health, generating $654.60M in service revenue against $829.50M in product sales, supported by service gross margins of 55.40% and a total corporate Remaining Performance Obligation (RPO) of $878.40M. GE HealthCare posted an overall FY2025 revenue composition where recurring services and software generated 52.00% ($10,728.00M) of the consolidated top-line ($20,625.00M), while capital equipment accounted for 48.00% ($9,897.00M). GE HealthCare's total RPO expanded to $16,118.00M in 2026 H1, with service agreements comprising $10,939.00M (68.21%), generating an interim service gross margin of 51.72%.
Siemens Healthineers maintained a global equipment book-to-bill ratio of 1.14 in FY2025 and 1.07 in 2026 H1, supported by an unfulfilled order backlog of €36.00B ($40,702.00M), of which €11.00B ($12,437.00M / 30.56%) is scheduled for revenue conversion over the subsequent 12 months. Philips reported a total D&T recurring service, software license, and Image-Guided Therapy disposable mix of 37.01% (€3,157.00M / $3,569.30M) against equipment revenues of €5,286.00M.
United Imaging operated with an aftermarket conversion ratio of 0.150x, with maintenance services generating RMB 1,707.98M ($237.63M / 12.38% of total revenue), alongside standalone software revenue of RMB 54.50M ($7.58M / 0.39%), while equipment sales accounted for RMB 11,389.85M ($1,584.67M / 82.53%). However, its service gross margin reached 61.86% in FY2025, with international service revenue growing over 60.00% YoY in 2026 H1. As its installed base expanded past 40,000 units across 17,000 healthcare institutions, supported by 39 overseas spare parts depots and 12 service centers, conversion yields point to structural margin expansion as units exit initial warranty periods.
Mindray maintained a Group-wide recurring consumable and service revenue mix of approximately 40.00%, combining patient monitoring disposables and IVD chemistry reagents with an engineering network of over 13,000 certified technicians across 110 global service hubs.
HDIN Institutional Verdict
Equity market valuations across the medical imaging sector reflect contrasting risk profiles across corporate entities:
1. Operational Decoupling Favors High Autonomy: United Imaging's vertical integration strategy (>90.00% internal component self-sufficiency, SiC amplifiers, and in-house LYSO crystal growth) insulates its cost baseline against cross-border tariff adjustments and supply bottlenecks. However, institutional positions must balance its 33.98% top-line expansion against working capital demands: an extended 147.9-day DSO, a 29.73% R&D capitalization rate, and an inventory provision rate of 1.09% warrant monitoring if domestic public hospital procurement schedules lengthen.
2. Western Conglomerates Face Margin Dilution from Trade and Non-Operating Liabilities: GE HealthCare faces persistent tariff exposure ($245.00M operating contraction in FY2025 and $156.00M in 2026 H1), which partially offsets growth across its high-margin AVS lines (22.00% EBIT margin) and recurring service RPO book ($10.94B). Philips continues to emerge from its €1,025.00M Respironics settlement cash outflow; while core D&T operations generated an 11.70% adjusted EBITA margin, ongoing compliance costs and a 43.92% goodwill-to-asset profile constrain capital flexibility.
3. Balance Sheet Defensibility Shifts Toward Asia: Mindray and United Imaging hold net-cash balance sheets with minimal funded debt and negligible goodwill impairment exposure (0.06% of total assets at United Imaging). By contrast, Siemens Healthineers (53.25% goodwill and intangibles to assets) and GE HealthCare (69.88% liability-to-asset ratio) remain reliant on debt refinancing windows and capital market stability. Over the 2026–2028 cycle, operating alpha will favor manufacturers that combine helium-independent MRI architectures, proprietary AI-guided imaging pipelines, and dual-region supply chains designed to mitigate unilateral trade actions.
Presentation Download & Video Access:
- Presentation Download: Click the PDF download link under 'Related Topics' to access the full institutional presentation of this report.
- Video Link: Click this link to watch the HDIN analyst briefing on YouTube.
About HDIN Research:
HDIN Research is a premier global market intelligence and strategic advisory firm specializing in institutional-grade financial analysis, supply chain audits, and macroeconomic forecasting. Our dedicated sector analysts deliver actionable, data-driven insights tailored for private equity, hedge funds, and corporate strategy teams. Visit us at http://www.hdinresearch.com.
2026 AI Transparency Footer:
This intelligence report was authored by HDIN Research analysts following a rigorous audit of official corporate filings. AI was utilized for massive-scale data synthesis and structural drafting, ensuring 100% inclusion of reported data points. All strategic insights, financial modeling, and final verdicts were verified by our editorial board to ensure professional accuracy and compliance with 2026 Google Search E-E-A-T standards.