Verde Resources, Inc.: Commercial Scaling Near St. Louis as Margin Compression Signals Counterparty Vulnerability
Date : 2026-09-25
Reading : 209
HDIN Executive Takeaways
1. Verde Resources, Inc. reported FY2026 net revenue of $467,788 (+251.19% YoY), yet gross margin compressed by 2,507 basis points to 36.05% due to product mix transitions and elevated fulfillment outlays.
2. The operational footprint exhibits severe counterparty concentration, relying on Biochar Solutions LLC in Oregon for 98.99% of direct costs and Ergon Asphalt & Emulsions, Inc. for 98.33% of top-line revenue under non-binding volume terms.
3. Liquidity remains constrained with cash equivalents of $1,786,407 supporting an operating runway of approximately 7.3 months against an unhedged $3.0 million contractual payment default to C-Twelve Pty Ltd.
Figure Verde Resources FY2026 Executive Strategy & Net Zero Diagnostic
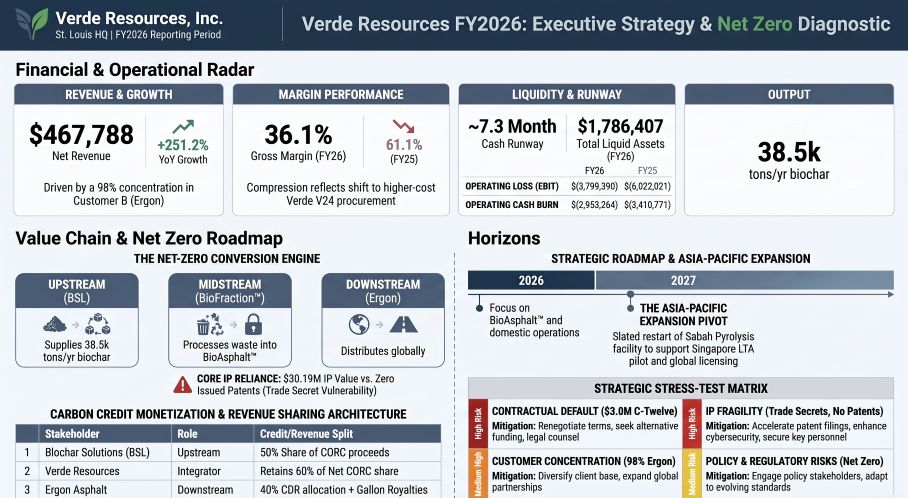 Operational Deconstruction and Structural Margin Compression
Verde Resources, Inc. [OTC: VRDR] operates as a single reportable operating segment under ASC 280, evaluated on a consolidated basis by the Chief Executive Officer. During the fiscal year ended June 30, 2026, the corporate model transitioned toward an asset-light commercialization and IP-licensing platform.
Top-line revenue expanded 251.19% YoY to $467,788 in FY2026 compared to $133,202 in FY2025. This expansion was driven by $460,000 in initial commercial purchase orders from Ergon Asphalt & Emulsions, Inc. for the emulsifying agent Verde V24. Cost of revenue grew 477.58% YoY from $51,789 to $299,128, resulting in a gross profit of $168,660 (+107.17% YoY). Consequently, gross margin contracted 2,507 basis points from 61.12% to 36.05%, reflecting higher procurement and delivery costs associated with Verde V24 compared to historical pre-mixed BioAsphalt™ solutions.
Selling, general, and administrative (SG&A) expenses fell 37.55% YoY from $5,889,024 to $3,677,660, primarily reflecting reduced payroll ($1,270,000 versus $2,620,000) and professional consulting fees ($840,000 versus $1,430,000). Total operating expenses decreased 34.98% YoY to $3,968,050. Operating loss (EBIT) narrowed by 36.91% to $(3,799,390). Adding back total depreciation and amortization of $331,833 (comprising $228,976 in PP&E depreciation and $102,857 in factory lease amortization), EBITDA loss closed at $(3,467,557) versus $(5,670,224) in FY2025. Net loss improved 29.29% to $(3,382,027) after accounting for net other income of $417,363.
Table Consolidated Financial Performance and Profitability Metrics — FY2025 vs. FY2026
Operating cash flow used was $(2,953,264) in FY2026, an improvement from $(3,410,771) in FY2025. With capital expenditures curtailed to $0 (down from $378), Free Cash Flow matched operating cash flow at $(2,953,264). Cash and cash equivalents totaled $1,786,407 as of June 30, 2026, supported by $2,000,000 in gross proceeds from an equity private placement with Ergon Asphalt & Emulsions, Inc. in October 2025 and a $1,000,000 certificate of deposit reclassification under ASC 230. Short-term investments decreased from $1,276,484 to $0. Total liquid assets contracted 22.25% YoY from $2,297,596 to $1,786,407.
The company maintains a Current Ratio of 2.60x ($2,319,768 current assets versus $892,008 current liabilities) and a Quick Ratio of 2.01x ($1,786,407 cash plus $5,019 receivables divided by $892,008 current liabilities). Total liabilities stand at $892,008 in current liabilities and $52,505 in non-current operating lease liabilities, with zero interest-bearing bank debt. Based on an average monthly cash burn of $246,105, the operational cash runway stands at 7.26 months (~7.3 months).
Geographic Footprint, Supply Architecture, and Structural Exposure
Verde Resources, Inc.'s operational architecture is distributed between North American commercial deployment corridors and an upstream production footprint in Southeast Asia.
* St. Louis, Missouri: Current corporate operations are based at 8112 Maryland Ave (lease expiring October 31, 2026), shifting to a 7,033-square-foot facility at 7800 Forsyth Ave under a 62-month lease effective October 1, 2026, totaling $1,043,100 in future commitments.
* Auburn / Opelika, Alabama: The National Center for Asphalt Technology (NCAT) test track serves as the central R&D validation node under a research agreement requiring $62,500 quarterly commitments through late 2026. The 3-year study covers ASTM D6927, ASTM D6931, and AASHTO T283 testing, with final reports due September 30, 2027.
* Oregon Production Network: Upstream feedstock is secured via Biochar Solutions LLC (BSL) and its subsidiary Oregon Biochar Solutions (OBS), which supply white-label engineered biochar up to 38,500 U.S. tons annually under an agreement signed in March 2026 and amended in June 2026.
* Sabah, Malaysia: Verde Resources (Malaysia) Sdn Bhd holds a 1,350-ton-per-year design capacity slow-pyrolysis BioFraction™ plant at Jalan Silam. The Segama factory lease was prepaid upfront through March 2, 2029 ($720,000 total; amortized at $102,857 annually). The facility produced 0 tons in FY2026, remaining dormant since 2021 pending a planned 2027 restart.
* Republic of Singapore: Verde Resources Asia Pacific Pte. Ltd. (VRAPPL), established March 30, 2026, oversees regional digital Measurement, Reporting, and Verification (dMRV) frameworks and executes a 12-month non-binding Memorandum of Understanding signed August 26, 2026, with Highway International Pte. Ltd. for Land Transport Authority (LTA) road testing.
* British Virgin Islands: Intangible intellectual property assets with a carrying value of $30,192,771 are held via Verde Resources Asia Pacific Limited (VRAP), transferred on October 15, 2025, from dissolved Labuan entity Biofraction Resources Limited.
Table Product, Technology, Production Capacity, and Commercialization Status — FY2026
Commercial counterparty exposure is acute. Customer B (Ergon Asphalt & Emulsions, Inc.) accounted for 98.33% ($460,000) of FY2026 revenue, compared to Customer A accounting for 93.93% ($125,120) in FY2025. On the procurement side, Vendor B (Biochar Solutions LLC) accounted for 98.99% ($296,000) of direct costs in FY2026. Under the 10-year Master Commercialization and Collaboration Agreement (MCCA) signed July 1, 2026, Ergon maintains zero minimum purchase obligations during the initial 15-month go-to-market window, with binding volume talks deferred to 2027. Under this structure, Ergon receives 40% of generated carbon credits from bulk or packaged mixes, while BSL receives a 50% split of carbon removal credits and credit sales proceeds under its separate supply agreement.
HDIN Institutional Verdict
Verde Resources, Inc.'s transition to an asset-light framework removes capital intensity ($0 capex in FY2026) but introduces severe operational asymmetries. Management has pivoted away from the Verde V24 emulsifying agent—which generated 98.33% of FY2026 top-line revenue—after August 2026 NCAT tests showed the formulation was not market-ready. As a direct result, the company defaulted on its contractual commitment to C-Twelve Pty Ltd to fund a $2.0 million loan and a $1.0 million license fee by July 31, 2026. C-Twelve retains the right to declare a formal breach upon 10 business days' written notice.
Balance sheet capitalization remains exposed to valuation shocks. Total intangible assets stand at $33,631,731, representing 88.36% of corporate assets ($38.06 million total), consisting of $30,192,771 in Catalytic BioFraction Process trade secrets and $3,438,960 for the Sabah exclusive license. Designated as indefinite-lived assets, these intangibles were audited by J&S Associate PLT under a qualitative test (ASC 350-30-35) as a Critical Audit Matter (CAM). With the Sabah plant idle since 2021 and its reactivation dependent on non-binding APAC MOUs, unamortized asset carrying values remain exposed to potential non-cash impairment if regulatory sign-offs in Singapore or commercial deployments with Ergon stall.
Corporate governance vulnerabilities further complicate institutional underwriting. The Board of Directors lacks independent audit, compensation, or nominating committees, operating with only one independent director (25% independence). Inherent conflicts exist: Director Karl Strahl simultaneously serves as COO of primary supplier Oregon Biochar Solutions (accounting for 98.99% of procurement costs), while a $1,250,000 special executive bonus awarded to CEO Jack Wong in FY2025 was deployed to acquire company residential real estate in Chesterfield, Missouri, via an $857,500 offset with zero cash transfer. With 1,304,292,407 common shares outstanding and an "evergreen" equity incentive plan auto-expanding by up to 5% annually through 2036, resolving the $3.0 million C-Twelve default and funding operations beyond the 7.3-month cash runway hinges on a planned Nasdaq uplisting, carrying material dilution risk for existing equity holders.
Presentation Download & Video Access:
- Presentation Download: Click the PDF download link under 'Related Topics' to access the full institutional presentation of this report.
- Video Link: Click this link to watch the HDIN analyst briefing on YouTube.
About HDIN Research:
HDIN Research is a premier global market intelligence and strategic advisory firm specializing in institutional-grade financial analysis, supply chain audits, and macroeconomic forecasting. Our dedicated sector analysts deliver actionable, data-driven insights tailored for private equity, hedge funds, and corporate strategy teams. Visit us at http://www.hdinresearch.com.
2026 AI Transparency Footer:
This intelligence report was authored by HDIN Research analysts following a rigorous audit of official corporate filings. AI was utilized for massive-scale data synthesis and structural drafting, ensuring 100% inclusion of reported data points. All strategic insights, financial modeling, and final verdicts were verified by our editorial board to ensure professional accuracy and compliance with 2026 Google Search E-E-A-T standards.
1. Verde Resources, Inc. reported FY2026 net revenue of $467,788 (+251.19% YoY), yet gross margin compressed by 2,507 basis points to 36.05% due to product mix transitions and elevated fulfillment outlays.
2. The operational footprint exhibits severe counterparty concentration, relying on Biochar Solutions LLC in Oregon for 98.99% of direct costs and Ergon Asphalt & Emulsions, Inc. for 98.33% of top-line revenue under non-binding volume terms.
3. Liquidity remains constrained with cash equivalents of $1,786,407 supporting an operating runway of approximately 7.3 months against an unhedged $3.0 million contractual payment default to C-Twelve Pty Ltd.
Figure Verde Resources FY2026 Executive Strategy & Net Zero Diagnostic
Operational Deconstruction and Structural Margin CompressionVerde Resources, Inc. [OTC: VRDR] operates as a single reportable operating segment under ASC 280, evaluated on a consolidated basis by the Chief Executive Officer. During the fiscal year ended June 30, 2026, the corporate model transitioned toward an asset-light commercialization and IP-licensing platform.
Top-line revenue expanded 251.19% YoY to $467,788 in FY2026 compared to $133,202 in FY2025. This expansion was driven by $460,000 in initial commercial purchase orders from Ergon Asphalt & Emulsions, Inc. for the emulsifying agent Verde V24. Cost of revenue grew 477.58% YoY from $51,789 to $299,128, resulting in a gross profit of $168,660 (+107.17% YoY). Consequently, gross margin contracted 2,507 basis points from 61.12% to 36.05%, reflecting higher procurement and delivery costs associated with Verde V24 compared to historical pre-mixed BioAsphalt™ solutions.
Selling, general, and administrative (SG&A) expenses fell 37.55% YoY from $5,889,024 to $3,677,660, primarily reflecting reduced payroll ($1,270,000 versus $2,620,000) and professional consulting fees ($840,000 versus $1,430,000). Total operating expenses decreased 34.98% YoY to $3,968,050. Operating loss (EBIT) narrowed by 36.91% to $(3,799,390). Adding back total depreciation and amortization of $331,833 (comprising $228,976 in PP&E depreciation and $102,857 in factory lease amortization), EBITDA loss closed at $(3,467,557) versus $(5,670,224) in FY2025. Net loss improved 29.29% to $(3,382,027) after accounting for net other income of $417,363.
Table Consolidated Financial Performance and Profitability Metrics — FY2025 vs. FY2026
| Financial Performance Metric (USD) | FY2025 | FY2026 | Variance ($ / bps) | Variance (%) | Accounting Citation |
| Net Revenue | $133,202 | $467,788 | +$334,586 | +251.19% | Form 10-K, Item 7 / Note 4 |
| Cost of Revenue | $51,789 | $299,128 | +$247,339 | +477.58% | Form 10-K, Item 7 / Note 4 |
| Gross Profit | $81,413 | $168,660 | +$87,247 | +107.17% | Form 10-K, Item 7 / Note 4 |
| Gross Margin (%) | 61.12% | 36.05% | -2,507 bps | -41.02% | Form 10-K, Item 7 |
| SG&A Expense | $5,889,024 | $3,677,660 | -$2,211,364 | -37.55% | Form 10-K, Item 7 / Note 4 |
| Other Operating Expense | $214,410 | $290,390 | +$75,980 | +35.44% | Form 10-K, Item 7 / Note 4 |
| Operating Loss (EBIT) | $(6,022,021) | $(3,799,390) | +$2,222,631 | -36.91% | Form 10-K, Item 7 / Note 4 |
| Depreciation & Amortization | $351,797 | $331,833 | -$19,964 | -5.67% | Statement of Cash Flows / Note 4 |
| EBITDA | $(5,670,224) | $(3,467,557) | +$2,202,667 | -38.85% | Derived Operational Metric |
| Net Other Income | $1,239,008 | $417,363 | -$821,645 | -66.31% | Statements of Operations |
| Net Loss | $(4,783,013) | $(3,382,027) | +$1,400,986 | -29.29% | Form 10-K, Item 7 / Note 4 |
Operating cash flow used was $(2,953,264) in FY2026, an improvement from $(3,410,771) in FY2025. With capital expenditures curtailed to $0 (down from $378), Free Cash Flow matched operating cash flow at $(2,953,264). Cash and cash equivalents totaled $1,786,407 as of June 30, 2026, supported by $2,000,000 in gross proceeds from an equity private placement with Ergon Asphalt & Emulsions, Inc. in October 2025 and a $1,000,000 certificate of deposit reclassification under ASC 230. Short-term investments decreased from $1,276,484 to $0. Total liquid assets contracted 22.25% YoY from $2,297,596 to $1,786,407.
The company maintains a Current Ratio of 2.60x ($2,319,768 current assets versus $892,008 current liabilities) and a Quick Ratio of 2.01x ($1,786,407 cash plus $5,019 receivables divided by $892,008 current liabilities). Total liabilities stand at $892,008 in current liabilities and $52,505 in non-current operating lease liabilities, with zero interest-bearing bank debt. Based on an average monthly cash burn of $246,105, the operational cash runway stands at 7.26 months (~7.3 months).
Geographic Footprint, Supply Architecture, and Structural Exposure
Verde Resources, Inc.'s operational architecture is distributed between North American commercial deployment corridors and an upstream production footprint in Southeast Asia.
* St. Louis, Missouri: Current corporate operations are based at 8112 Maryland Ave (lease expiring October 31, 2026), shifting to a 7,033-square-foot facility at 7800 Forsyth Ave under a 62-month lease effective October 1, 2026, totaling $1,043,100 in future commitments.
* Auburn / Opelika, Alabama: The National Center for Asphalt Technology (NCAT) test track serves as the central R&D validation node under a research agreement requiring $62,500 quarterly commitments through late 2026. The 3-year study covers ASTM D6927, ASTM D6931, and AASHTO T283 testing, with final reports due September 30, 2027.
* Oregon Production Network: Upstream feedstock is secured via Biochar Solutions LLC (BSL) and its subsidiary Oregon Biochar Solutions (OBS), which supply white-label engineered biochar up to 38,500 U.S. tons annually under an agreement signed in March 2026 and amended in June 2026.
* Sabah, Malaysia: Verde Resources (Malaysia) Sdn Bhd holds a 1,350-ton-per-year design capacity slow-pyrolysis BioFraction™ plant at Jalan Silam. The Segama factory lease was prepaid upfront through March 2, 2029 ($720,000 total; amortized at $102,857 annually). The facility produced 0 tons in FY2026, remaining dormant since 2021 pending a planned 2027 restart.
* Republic of Singapore: Verde Resources Asia Pacific Pte. Ltd. (VRAPPL), established March 30, 2026, oversees regional digital Measurement, Reporting, and Verification (dMRV) frameworks and executes a 12-month non-binding Memorandum of Understanding signed August 26, 2026, with Highway International Pte. Ltd. for Land Transport Authority (LTA) road testing.
* British Virgin Islands: Intangible intellectual property assets with a carrying value of $30,192,771 are held via Verde Resources Asia Pacific Limited (VRAP), transferred on October 15, 2025, from dissolved Labuan entity Biofraction Resources Limited.
Table Product, Technology, Production Capacity, and Commercialization Status — FY2026
| Product / Technology Line | Operational Facility / Supplier | FY2026 Capacity Allocation | FY2026 Output & Revenue | Commercial Status |
| Engineered Biochar Blend | Biochar Solutions LLC (Oregon, USA) | 38,500 U.S. tons/year supply contract | Scaled to order; proprietary char pellets | Active; core input for Ergon MCCA; 50%+ carbon credit qualified |
| 100% RAP Cold Recycling | Ergon Asphalt mixing plant network | Unlimited partner blending infrastructure | Field trial quantities; $0 direct sales | Replaced Verde V24 as core commercial road technology in July 2026 |
| Verde V24 Emulsifier | Third-party chemical contractor | ~80,000 liters pilot batch | ~80,000 L; $460,000 revenue (98.33%) | Commercialization halted following August 2026 NCAT technical report |
| BioFraction™ Pyrolysis | Sabah, Malaysia (Owned plant) | 1,350 U.S. tons/year nameplate capacity | 0 U.S. tons; $0 revenue | Dormant; targeted for 2027 reactivation for Singapore LTA supply |
| TerraZyme™ Soil Stabilizer | Nature Plus Inc. (NPI MOU) | Pilot distribution quantities | $0 revenue; pre-commercial trials | Non-binding MOU expiring December 31, 2026; cement replacement |
Commercial counterparty exposure is acute. Customer B (Ergon Asphalt & Emulsions, Inc.) accounted for 98.33% ($460,000) of FY2026 revenue, compared to Customer A accounting for 93.93% ($125,120) in FY2025. On the procurement side, Vendor B (Biochar Solutions LLC) accounted for 98.99% ($296,000) of direct costs in FY2026. Under the 10-year Master Commercialization and Collaboration Agreement (MCCA) signed July 1, 2026, Ergon maintains zero minimum purchase obligations during the initial 15-month go-to-market window, with binding volume talks deferred to 2027. Under this structure, Ergon receives 40% of generated carbon credits from bulk or packaged mixes, while BSL receives a 50% split of carbon removal credits and credit sales proceeds under its separate supply agreement.
HDIN Institutional Verdict
Verde Resources, Inc.'s transition to an asset-light framework removes capital intensity ($0 capex in FY2026) but introduces severe operational asymmetries. Management has pivoted away from the Verde V24 emulsifying agent—which generated 98.33% of FY2026 top-line revenue—after August 2026 NCAT tests showed the formulation was not market-ready. As a direct result, the company defaulted on its contractual commitment to C-Twelve Pty Ltd to fund a $2.0 million loan and a $1.0 million license fee by July 31, 2026. C-Twelve retains the right to declare a formal breach upon 10 business days' written notice.
Balance sheet capitalization remains exposed to valuation shocks. Total intangible assets stand at $33,631,731, representing 88.36% of corporate assets ($38.06 million total), consisting of $30,192,771 in Catalytic BioFraction Process trade secrets and $3,438,960 for the Sabah exclusive license. Designated as indefinite-lived assets, these intangibles were audited by J&S Associate PLT under a qualitative test (ASC 350-30-35) as a Critical Audit Matter (CAM). With the Sabah plant idle since 2021 and its reactivation dependent on non-binding APAC MOUs, unamortized asset carrying values remain exposed to potential non-cash impairment if regulatory sign-offs in Singapore or commercial deployments with Ergon stall.
Corporate governance vulnerabilities further complicate institutional underwriting. The Board of Directors lacks independent audit, compensation, or nominating committees, operating with only one independent director (25% independence). Inherent conflicts exist: Director Karl Strahl simultaneously serves as COO of primary supplier Oregon Biochar Solutions (accounting for 98.99% of procurement costs), while a $1,250,000 special executive bonus awarded to CEO Jack Wong in FY2025 was deployed to acquire company residential real estate in Chesterfield, Missouri, via an $857,500 offset with zero cash transfer. With 1,304,292,407 common shares outstanding and an "evergreen" equity incentive plan auto-expanding by up to 5% annually through 2036, resolving the $3.0 million C-Twelve default and funding operations beyond the 7.3-month cash runway hinges on a planned Nasdaq uplisting, carrying material dilution risk for existing equity holders.
Presentation Download & Video Access:
- Presentation Download: Click the PDF download link under 'Related Topics' to access the full institutional presentation of this report.
- Video Link: Click this link to watch the HDIN analyst briefing on YouTube.
About HDIN Research:
HDIN Research is a premier global market intelligence and strategic advisory firm specializing in institutional-grade financial analysis, supply chain audits, and macroeconomic forecasting. Our dedicated sector analysts deliver actionable, data-driven insights tailored for private equity, hedge funds, and corporate strategy teams. Visit us at http://www.hdinresearch.com.
2026 AI Transparency Footer:
This intelligence report was authored by HDIN Research analysts following a rigorous audit of official corporate filings. AI was utilized for massive-scale data synthesis and structural drafting, ensuring 100% inclusion of reported data points. All strategic insights, financial modeling, and final verdicts were verified by our editorial board to ensure professional accuracy and compliance with 2026 Google Search E-E-A-T standards.