Hai Robotics Innovation Group Co., Ltd.: Global Channel Pivot and 34.4% Gross Margin Expansion Signal Turnaround Ahead of Hong Kong IPO
Date : 2026-09-25
Reading : 84
HDIN Executive Takeaways
1. Hai Robotics Innovation Group Co., Ltd. crossed an overseas revenue inflection point in 1H2026 at 50.2% ($78.16 million / RMB 561.75 million), expanding consolidated gross margin to 34.4% via a 1,000 bps international pricing spread over domestic sales.
2. Channel partner sales surged to 58.6% of total revenue in 1H2026, driven by top-tier systems integrators, while capital expenditures prioritize local assembly footprints in the United States and Europe to bypass Section 301 tariffs.
3. Optical balance sheet insolvency of $608.14 million (RMB 4,371.0 million) resolves upon listing as $730.95 million (RMB 5,253.7 million) in redemption liabilities reclassify into equity, though working capital cash burn reached $50.06 million in 1H2026.
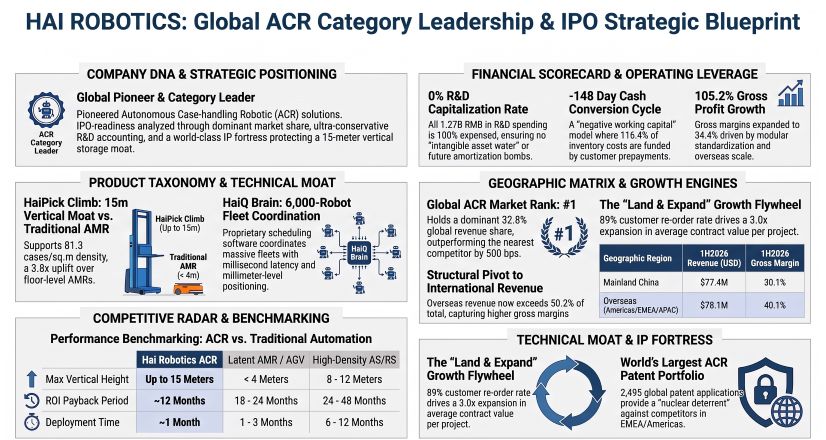
Figure HAI ROBOTICS Global ACR Category Leadership & IPO Strategic Blueprint
 Financial Analysis and Solution-Centric Unit Economics
Hai Robotics Innovation Group Co., Ltd. generated $155.56 million (RMB 1,118.08 million) in revenue during 1H2026, representing a 70.2% expansion year-over-year compared to $91.40 million (RMB 656.95 million) in 1H2025. Group revenue expanded from $112.28 million (RMB 807.01 million) in FY2023 to $280.62 million (RMB 2,016.94 million) in FY2025, charting a compound annual growth rate (CAGR) of 58.1%. Gross margin expanded by 1,840 basis points from 16.0% in FY2023 to 31.2% in FY2025, reaching 34.4% in 1H2026.
The entity's cost architecture indicates structural manufacturing efficiency. Raw materials and consumables constituted 73.3% of Cost of Sales ($74.84 million) in 1H2026, down from 58.1% of total revenue in FY2023 to 48.1% of revenue in 1H2026. Direct implementation costs reached 16.1% of Cost of Sales ($16.46 million) in 1H2026, reflecting overseas deployment logistics. Freight expenses normalized to 9.5% of Cost of Sales ($9.64 million / 6.2% of revenue) in 1H2026 following packaging redesigns, compared to 12.5% ($24.20 million / 8.6% of revenue) in FY2025. Inventory write-downs receded from 10.9% of Cost of Sales ($10.26 million) in FY2023 to 1.0% ($1.04 million) in 1H2026.
Table Revenue Mix and Gross Margin Attribution by Product, Business Vertical, and Geography
Revenue scale is driven by contract value expansion rather than unit volume increases. Signed project volume (Q) recorded 420 projects in FY2023, 365 in FY2024, 340 in FY2025, and 204 in 1H2026. Concurrently, Average Contract Value per Project (Project ASP - P) increased 3.0x from $459k (RMB 3.3 million) in FY2023 to $709k (RMB 5.1 million) in FY2024, $1,100k (RMB 7.9 million) in FY2025, and $1,419k (RMB 10.2 million) in 1H2026. Key customers contributing over $2.78 million (RMB 20.0 million) in cumulative bookings provided 87.1% of orders in 1H2026, up from 60.0% in FY2023. Customer repeat order rates advanced from 68% in FY2023 to 85% in FY2025 and 89% in 1H2026. Order backlog stood at $577.95 million (RMB 4,154.0 million) as of June 30, 2026, up 34.6% from year-end FY2025 ($429.50 million / RMB 3,087.0 million).
Operational leverage compressed core operating expenses excluding share-based compensation (SBC) from 105.9% of revenue ($118.89 million) in FY2023 to 55.0% ($154.36 million) in FY2025, and 53.5% ($83.30 million) in 1H2026. Selling and distribution expenses ex-SBC receded from 49.3% of revenue in FY2023 to 27.4% ($42.70 million) in 1H2026. Administrative expenses ex-SBC normalized to 8.9% ($13.87 million) in 1H2026 from 21.0% in FY2023. Research and development expenses ex-SBC stood at 17.2% ($26.74 million) in 1H2026. Total SBC totaled $10.07 million in FY2023, $16.83 million in FY2025, and $13.74 million in 1H2026. Consequently, Non-IFRS Adjusted EBITDA Margin contracted its deficit by 6,130 basis points, from -78.7% (-$88.35 million) in FY2023 to -17.4% (-$27.12 million) in 1H2026. Operating loss (EBIT) stood at -$31.85 million in 1H2026 versus -$40.39 million in 1H2025.
The Group maintains an operating working capital framework characterized by a cash conversion cycle (CCC) of -148 days in 1H2026, widening from -40 days in FY2023, -85 days in FY2024, and -135 days in FY2025. Days Sales Outstanding (DSO) settled at 45 days in 1H2026 (42 days in FY2025), with 90.6% of trade receivables aged within one year and carrying a 4.50% collective Expected Credit Loss (ECL) allowance. Days Sales of Inventory (DSI) optimized to 241 days in 1H2026 from 311 days in FY2023. Dispatched goods and contract fulfillment costs represented 89.5% ($120.67 million / RMB 867.3 million) of gross inventories ($134.73 million) awaiting final acceptance certificates (FAC). Contract liabilities (customer upfront advance deposits) totaled $156.80 million (RMB 1,127.0 million), establishing a 116.4% cash pre-funding ratio over pending inventory balances. Warranty provisions totaled $15.93 million (RMB 115.0 million) in 1H2026 based on a historical accrual rate of 5.1% to 6.3% of revenue.
Supply Chain Architecture and Geographic Footprint
Hai Robotics Innovation Group Co., Ltd. directs global operations through its administrative headquarters at Room 101, Building B, Hai Robotics Tech Park, Nanchang Community, Xixiang Street, Bao'an District, Shenzhen, Guangdong, China. Internal technical development is sustained by an R&D headcount of 566 personnel (35.8% of 1,582 total global staff). Cumulative R&D spending of $177.70 million (RMB 1,277.21 million) between FY2023 and 1H2026 was expensed at a 0.0% capitalization rate. The Group’s intellectual property portfolio comprises 2,495 global patent filings, encompassing 928 granted patents in China, 939 granted patents internationally, and 151 Patent Cooperation Treaty (PCT) applications.
Production operates across two facilities exceeding 46,000 square meters over 8 specialized assembly lines:
* Dongguan Plant (Dongguan, Guangdong): Leased Automated Case-handling Mobile Robot (ACR) manufacturing, integration, and quality testing center. Designed 1H2026 capacity totaled 2,000 units, delivering an actual output of 1,669 units (83.5% utilization rate), compared to 5,036 units produced in FY2025 (87.0% utilization rate).
* Yancheng Plant (Yancheng, Jiangsu): Commissioned in June 2025 with capitalized property assets of $6.78 million (RMB 48.7 million). The plant manufactures ACRs, Autonomous Mobile Robots (AMRs), and mechanical sub-assemblies. Capacity reached 7,000 units in 1H2026, delivering 5,878 units (84.0% utilization rate), scaling from 3,732 units produced in FY2025.
* Wuxi Plant Consolidation: A 9,700-square-meter facility with 3 AMR lines producing 2,875 units in FY2025 was shuttered and fully absorbed into the Yancheng facility in May 2025.
External manufacturing integration includes 8 to 9 OEM/ODM partners (including assembly facilities in Malaysia), representing 4.2% of total procurement in 1H2026. The Bill of Materials (BOM) cost base consists of the Motion System (15.0%), Control System (10.0%), Perception System (7.0%), Power System (7.0%), and Chassis/Structural Parts (61.0%). Procurement concentration remains dispersed; the Top 5 suppliers accounted for 14.1% ($17.02 million) of procurement in 1H2026, with the largest single supplier (Supplier I - Racking Systems) capturing 4.6% ($5.55 million). Days Payable Outstanding (DPO) settled at 136 days in 1H2026.
International operations are administered through 8 wholly-owned operating subsidiaries: Hai Robotics U.S.A. Inc., Hai Robotics Europe B.V. (Netherlands), Hai Robotics U.K. Limited, Hai Robotics Singapore Pte. Ltd., Hai Robotics Japan, Hai Robotics Korea Co., Ltd., Hai Robotics Australia Pty Ltd, and Hai Robotics Tech (Hong Kong) Limited. Localized spare parts distribution warehouses operate across the United States, the Netherlands, Japan, South Korea, and Singapore. The commercial delivery model executes via direct sales (41.4% of 1H2026 revenue) and global systems integrators (58.6% of 1H2026 revenue across 410 active channel partners), with key partner integration spanning Vanderlande and Toyota Industries Corporation.
HDIN Institutional Verdict
Hai Robotics Innovation Group Co., Ltd. commands a 32.8% global market share in the Automated Case-handling Mobile Robot domain, surpassing Exotec SAS (27.8%) and Beijing Geekplus Technology Co., Ltd. [Geek+] (10.3%). However, institutional underwriting reveals operational and regulatory exposures:
* Governance Concentration via Weighted Voting Rights: Founders Chen Yuhao (CEO), Xu Shengdong (CTO), and Fang Bing (COO) maintain a 10-year concert party agreement through 2035. While holding 22.63% of economic equity prior to listing, the founders control over 70% of voting rights via Class A shares carrying 10 votes per share post-offering.
* Customer Concentration in Cyclical E-Commerce: Revenue exposure to the Top 5 clients expanded to 50.3% ($78.32 million) in 1H2026 from 32.1% in FY2023. The largest client, fast-fashion platform Customer F, generated 16.2% ($25.12 million) of 1H2026 revenue (21.3% / $59.80 million in FY2025).
* Operating Cash Burn vs. Balance Sheet Deficit: Reported Net Current Liabilities of $609.16 million (RMB 4,378.4 million) are distorted by $730.95 million in preferred share redemption liabilities, which automatically extinguish upon listing. However, operational cash burn accelerated to -$50.06 million in 1H2026 due to working capital commitments in overseas installations. Based on unrestricted cash of $197.14 million (RMB 1,416.9 million), strict operational runway stands at 22.5 months, demanding capital injection from the Hong Kong initial public offering.
* Trade Tariff Headwinds: Exports to the United States face cumulative Section 301 tariffs reaching up to 37.5% following an additional 12.5% duty effective July 24, 2026, while the FCC’s Covered List rule (effective July 28, 2026) imposes constraints on non-domestic robotics. Management's capital allocation allocating 20% to 25% of proceeds toward US and European assembly infrastructure represents an operational necessity rather than elective expansion.
Presentation Download & Video Access:
- Presentation Download: Click the PDF download link under 'Related Topics' to access the full institutional presentation of this report.
- Video Link: Click this link to watch the HDIN analyst briefing on YouTube.
About HDIN Research:
HDIN Research is a premier global market intelligence and strategic advisory firm specializing in institutional-grade financial analysis, supply chain audits, and macroeconomic forecasting. Our dedicated sector analysts deliver actionable, data-driven insights tailored for private equity, hedge funds, and corporate strategy teams. Visit us at http://www.hdinresearch.com.
2026 AI Transparency Footer:
"This intelligence report was authored by HDIN Research analysts following a rigorous audit of official corporate filings. AI was utilized for massive-scale data synthesis and structural drafting, ensuring 100% inclusion of reported data points. All strategic insights, financial modeling, and final verdicts were verified by our editorial board to ensure professional accuracy and compliance with 2026 Google Search E-E-A-T standards."
1. Hai Robotics Innovation Group Co., Ltd. crossed an overseas revenue inflection point in 1H2026 at 50.2% ($78.16 million / RMB 561.75 million), expanding consolidated gross margin to 34.4% via a 1,000 bps international pricing spread over domestic sales.
2. Channel partner sales surged to 58.6% of total revenue in 1H2026, driven by top-tier systems integrators, while capital expenditures prioritize local assembly footprints in the United States and Europe to bypass Section 301 tariffs.
3. Optical balance sheet insolvency of $608.14 million (RMB 4,371.0 million) resolves upon listing as $730.95 million (RMB 5,253.7 million) in redemption liabilities reclassify into equity, though working capital cash burn reached $50.06 million in 1H2026.
Figure HAI ROBOTICS Global ACR Category Leadership & IPO Strategic Blueprint
Financial Analysis and Solution-Centric Unit EconomicsHai Robotics Innovation Group Co., Ltd. generated $155.56 million (RMB 1,118.08 million) in revenue during 1H2026, representing a 70.2% expansion year-over-year compared to $91.40 million (RMB 656.95 million) in 1H2025. Group revenue expanded from $112.28 million (RMB 807.01 million) in FY2023 to $280.62 million (RMB 2,016.94 million) in FY2025, charting a compound annual growth rate (CAGR) of 58.1%. Gross margin expanded by 1,840 basis points from 16.0% in FY2023 to 31.2% in FY2025, reaching 34.4% in 1H2026.
The entity's cost architecture indicates structural manufacturing efficiency. Raw materials and consumables constituted 73.3% of Cost of Sales ($74.84 million) in 1H2026, down from 58.1% of total revenue in FY2023 to 48.1% of revenue in 1H2026. Direct implementation costs reached 16.1% of Cost of Sales ($16.46 million) in 1H2026, reflecting overseas deployment logistics. Freight expenses normalized to 9.5% of Cost of Sales ($9.64 million / 6.2% of revenue) in 1H2026 following packaging redesigns, compared to 12.5% ($24.20 million / 8.6% of revenue) in FY2025. Inventory write-downs receded from 10.9% of Cost of Sales ($10.26 million) in FY2023 to 1.0% ($1.04 million) in 1H2026.
Table Revenue Mix and Gross Margin Attribution by Product, Business Vertical, and Geography
| Revenue & Margin Attribution by Category | FY2023 Revenue (Share %) | FY2023 Gross Margin | FY2025 Revenue (Share %) | FY2025 Gross Margin | 1H2026 Revenue (Share %) | 1H2026 Gross Margin |
| HaiPick System 1 | $104.13M (92.8%) | Baseline | $99.59M (35.5%) | Core Tier | $46.17M (29.7%) | Standard |
| HaiPick System 2 | $7.80M (6.9%) | Baseline | $2.59M (0.9%) | Niche | $3.33M (2.1%) | Niche |
| HaiPick System 3 | $0.36M (0.3%) | Premium | $157.90M (56.3%) | High | $84.43M (54.3%) | Premium |
| HaiPick Climb | $0.00M (0.0%) | N/A | $18.93M (6.7%) | Ultra-High | $20.69M (13.3%) | Ultra-High |
| After-Sales Services | $0.91M (0.8%) | High | $6.52M (2.3%) | Expand | $8.03M (5.2%) | High |
| Distribution Vertical | $64.51M (57.5%) | 23.1% | $235.29M (83.8%) | 31.4% | $131.97M (84.8%) | 34.9% |
| Manufacturing Vertical | $47.77M (42.5%) | 28.2% | $45.33M (16.2%) | 41.4% | $23.59M (15.2%) | 36.4% |
| Mainland China | $85.16M (75.8%) | 18.7% | $148.74M (53.0%) | 20.8% | $77.40M (49.8%) | 30.1% |
| Overseas (Outside Mainland) | $27.12M (24.2%) | 45.7% | $131.88M (47.0%) | 46.9% | $78.16M (50.2%) | 40.1% |
| Consolidated Total | $112.28M (100.0%) | 16.0% | $280.62M (100.0%) | 31.2% | $155.56M (100.0%) | 34.4% |
Revenue scale is driven by contract value expansion rather than unit volume increases. Signed project volume (Q) recorded 420 projects in FY2023, 365 in FY2024, 340 in FY2025, and 204 in 1H2026. Concurrently, Average Contract Value per Project (Project ASP - P) increased 3.0x from $459k (RMB 3.3 million) in FY2023 to $709k (RMB 5.1 million) in FY2024, $1,100k (RMB 7.9 million) in FY2025, and $1,419k (RMB 10.2 million) in 1H2026. Key customers contributing over $2.78 million (RMB 20.0 million) in cumulative bookings provided 87.1% of orders in 1H2026, up from 60.0% in FY2023. Customer repeat order rates advanced from 68% in FY2023 to 85% in FY2025 and 89% in 1H2026. Order backlog stood at $577.95 million (RMB 4,154.0 million) as of June 30, 2026, up 34.6% from year-end FY2025 ($429.50 million / RMB 3,087.0 million).
Operational leverage compressed core operating expenses excluding share-based compensation (SBC) from 105.9% of revenue ($118.89 million) in FY2023 to 55.0% ($154.36 million) in FY2025, and 53.5% ($83.30 million) in 1H2026. Selling and distribution expenses ex-SBC receded from 49.3% of revenue in FY2023 to 27.4% ($42.70 million) in 1H2026. Administrative expenses ex-SBC normalized to 8.9% ($13.87 million) in 1H2026 from 21.0% in FY2023. Research and development expenses ex-SBC stood at 17.2% ($26.74 million) in 1H2026. Total SBC totaled $10.07 million in FY2023, $16.83 million in FY2025, and $13.74 million in 1H2026. Consequently, Non-IFRS Adjusted EBITDA Margin contracted its deficit by 6,130 basis points, from -78.7% (-$88.35 million) in FY2023 to -17.4% (-$27.12 million) in 1H2026. Operating loss (EBIT) stood at -$31.85 million in 1H2026 versus -$40.39 million in 1H2025.
The Group maintains an operating working capital framework characterized by a cash conversion cycle (CCC) of -148 days in 1H2026, widening from -40 days in FY2023, -85 days in FY2024, and -135 days in FY2025. Days Sales Outstanding (DSO) settled at 45 days in 1H2026 (42 days in FY2025), with 90.6% of trade receivables aged within one year and carrying a 4.50% collective Expected Credit Loss (ECL) allowance. Days Sales of Inventory (DSI) optimized to 241 days in 1H2026 from 311 days in FY2023. Dispatched goods and contract fulfillment costs represented 89.5% ($120.67 million / RMB 867.3 million) of gross inventories ($134.73 million) awaiting final acceptance certificates (FAC). Contract liabilities (customer upfront advance deposits) totaled $156.80 million (RMB 1,127.0 million), establishing a 116.4% cash pre-funding ratio over pending inventory balances. Warranty provisions totaled $15.93 million (RMB 115.0 million) in 1H2026 based on a historical accrual rate of 5.1% to 6.3% of revenue.
Supply Chain Architecture and Geographic Footprint
Hai Robotics Innovation Group Co., Ltd. directs global operations through its administrative headquarters at Room 101, Building B, Hai Robotics Tech Park, Nanchang Community, Xixiang Street, Bao'an District, Shenzhen, Guangdong, China. Internal technical development is sustained by an R&D headcount of 566 personnel (35.8% of 1,582 total global staff). Cumulative R&D spending of $177.70 million (RMB 1,277.21 million) between FY2023 and 1H2026 was expensed at a 0.0% capitalization rate. The Group’s intellectual property portfolio comprises 2,495 global patent filings, encompassing 928 granted patents in China, 939 granted patents internationally, and 151 Patent Cooperation Treaty (PCT) applications.
Production operates across two facilities exceeding 46,000 square meters over 8 specialized assembly lines:
* Dongguan Plant (Dongguan, Guangdong): Leased Automated Case-handling Mobile Robot (ACR) manufacturing, integration, and quality testing center. Designed 1H2026 capacity totaled 2,000 units, delivering an actual output of 1,669 units (83.5% utilization rate), compared to 5,036 units produced in FY2025 (87.0% utilization rate).
* Yancheng Plant (Yancheng, Jiangsu): Commissioned in June 2025 with capitalized property assets of $6.78 million (RMB 48.7 million). The plant manufactures ACRs, Autonomous Mobile Robots (AMRs), and mechanical sub-assemblies. Capacity reached 7,000 units in 1H2026, delivering 5,878 units (84.0% utilization rate), scaling from 3,732 units produced in FY2025.
* Wuxi Plant Consolidation: A 9,700-square-meter facility with 3 AMR lines producing 2,875 units in FY2025 was shuttered and fully absorbed into the Yancheng facility in May 2025.
External manufacturing integration includes 8 to 9 OEM/ODM partners (including assembly facilities in Malaysia), representing 4.2% of total procurement in 1H2026. The Bill of Materials (BOM) cost base consists of the Motion System (15.0%), Control System (10.0%), Perception System (7.0%), Power System (7.0%), and Chassis/Structural Parts (61.0%). Procurement concentration remains dispersed; the Top 5 suppliers accounted for 14.1% ($17.02 million) of procurement in 1H2026, with the largest single supplier (Supplier I - Racking Systems) capturing 4.6% ($5.55 million). Days Payable Outstanding (DPO) settled at 136 days in 1H2026.
International operations are administered through 8 wholly-owned operating subsidiaries: Hai Robotics U.S.A. Inc., Hai Robotics Europe B.V. (Netherlands), Hai Robotics U.K. Limited, Hai Robotics Singapore Pte. Ltd., Hai Robotics Japan, Hai Robotics Korea Co., Ltd., Hai Robotics Australia Pty Ltd, and Hai Robotics Tech (Hong Kong) Limited. Localized spare parts distribution warehouses operate across the United States, the Netherlands, Japan, South Korea, and Singapore. The commercial delivery model executes via direct sales (41.4% of 1H2026 revenue) and global systems integrators (58.6% of 1H2026 revenue across 410 active channel partners), with key partner integration spanning Vanderlande and Toyota Industries Corporation.
HDIN Institutional Verdict
Hai Robotics Innovation Group Co., Ltd. commands a 32.8% global market share in the Automated Case-handling Mobile Robot domain, surpassing Exotec SAS (27.8%) and Beijing Geekplus Technology Co., Ltd. [Geek+] (10.3%). However, institutional underwriting reveals operational and regulatory exposures:
* Governance Concentration via Weighted Voting Rights: Founders Chen Yuhao (CEO), Xu Shengdong (CTO), and Fang Bing (COO) maintain a 10-year concert party agreement through 2035. While holding 22.63% of economic equity prior to listing, the founders control over 70% of voting rights via Class A shares carrying 10 votes per share post-offering.
* Customer Concentration in Cyclical E-Commerce: Revenue exposure to the Top 5 clients expanded to 50.3% ($78.32 million) in 1H2026 from 32.1% in FY2023. The largest client, fast-fashion platform Customer F, generated 16.2% ($25.12 million) of 1H2026 revenue (21.3% / $59.80 million in FY2025).
* Operating Cash Burn vs. Balance Sheet Deficit: Reported Net Current Liabilities of $609.16 million (RMB 4,378.4 million) are distorted by $730.95 million in preferred share redemption liabilities, which automatically extinguish upon listing. However, operational cash burn accelerated to -$50.06 million in 1H2026 due to working capital commitments in overseas installations. Based on unrestricted cash of $197.14 million (RMB 1,416.9 million), strict operational runway stands at 22.5 months, demanding capital injection from the Hong Kong initial public offering.
* Trade Tariff Headwinds: Exports to the United States face cumulative Section 301 tariffs reaching up to 37.5% following an additional 12.5% duty effective July 24, 2026, while the FCC’s Covered List rule (effective July 28, 2026) imposes constraints on non-domestic robotics. Management's capital allocation allocating 20% to 25% of proceeds toward US and European assembly infrastructure represents an operational necessity rather than elective expansion.
Presentation Download & Video Access:
- Presentation Download: Click the PDF download link under 'Related Topics' to access the full institutional presentation of this report.
- Video Link: Click this link to watch the HDIN analyst briefing on YouTube.
About HDIN Research:
HDIN Research is a premier global market intelligence and strategic advisory firm specializing in institutional-grade financial analysis, supply chain audits, and macroeconomic forecasting. Our dedicated sector analysts deliver actionable, data-driven insights tailored for private equity, hedge funds, and corporate strategy teams. Visit us at http://www.hdinresearch.com.
2026 AI Transparency Footer:
"This intelligence report was authored by HDIN Research analysts following a rigorous audit of official corporate filings. AI was utilized for massive-scale data synthesis and structural drafting, ensuring 100% inclusion of reported data points. All strategic insights, financial modeling, and final verdicts were verified by our editorial board to ensure professional accuracy and compliance with 2026 Google Search E-E-A-T standards."