Lasertec Corporation: High-NA EUV Transition and Fablight Execution Secure Fortress Balance Sheet Across Five-Year Cycle
Date : 2026-09-28
Reading : 220
HDIN Executive Takeaways
1. Lasertec Corporation [TYO: 6920] demonstrated high revenue resilience in FY2026, delivering JPY 230,485 million in net sales with a 45.67% operating margin, bolstered by a 125.7% rebound in order intake (JPY 237,504 million).
2. Physical footprint centralization at Yokohama HQ and the InnoPa facility (JPY 28,457 million total book value) anchors global customer support centers across South Korea, the United States, and Taiwan, mitigating complex FAT lead-time bottlenecks.
3. Balance sheet risk is contained via zero financial debt, JPY 91,503 million in liquid cash, and an order backlog of JPY 322,964 million covered by JPY 44,284 million in non-refundable advances.
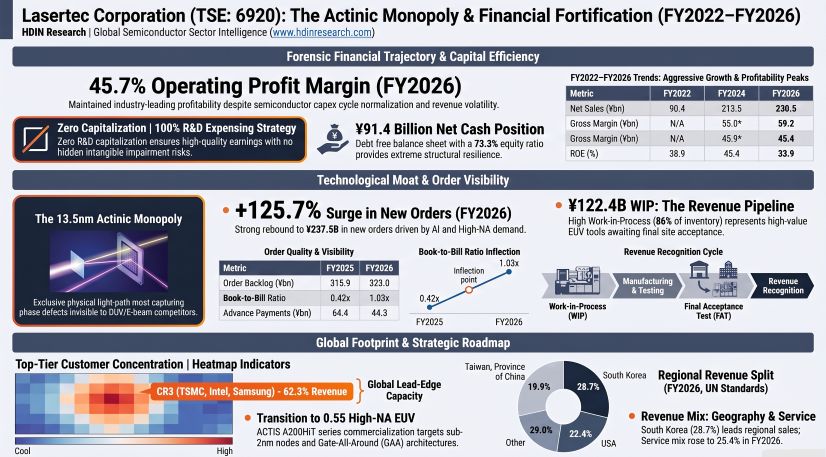
Figure Lasertec Corporation (TSE 6920): The Actinic Monopoly & Financial Fortification (FY2022-FY2026)
 Financial Architecture and Segmental Trajectory
Lasertec Corporation’s five-year financial disclosures (FY2022–FY2026) illustrate a structurally entrenched global monopoly in 13.5nm actinic extreme ultraviolet (EUV) photomask inspection. Group top-line revenue closed FY2026 at JPY 230,485 million, marking an 8.3% cyclical contraction from the historic high of JPY 251,477 million achieved in FY2025. Despite revenue consolidation driven by semiconductor fab expansion rescheduling, gross margin widened by 26 basis points year-over-year to 59.21%, underpinned by higher product realizations for the ACTIS A200HiT generation. Operating income reached JPY 105,259 million, sustaining an operating profit margin (OPM) of 45.67%.
Table LASERTEC FIVE-YEAR CONSOLIDATED EXECUTION METRICS (FY2022–FY2026)
A DuPont breakdown indicates that Lasertec Corporation’s return on equity contracted from a peak of 50.8% in FY2023 to 33.9% in FY2026. This dynamic reflects rapid de-leveraging rather than margin deterioration: net profit margin remained above 33.62% in FY2026, while financial leverage dropped from 2.48x to 1.46x as cumulative net income expanded retained earnings from JPY 146,500 million to JPY 252,900 million.
Table DUPONT PROFITABILITY TRANSMISSION ENGINE
Segment disclosures demonstrate an ongoing mix transformation. Semiconductor-related equipment revenue fell 17.2% year-over-year to JPY 168,090 million (72.93% of group net sales). Conversely, the services division advanced 36.5% to JPY 58,646 million, lifting its top-line contribution to 25.44% and validating post-warranty maintenance capture across an installed base of 13.5nm actinic systems.
Table PRODUCT LINE REVENUE BREAKDOWN
New orders expanded by 125.7% from JPY 105,226 million in FY2025 to JPY 237,504 million in FY2026, lifting the book-to-bill ratio from 0.42x to 1.03x. The total order backlog closed at JPY 322,964 million, with 68.96% (JPY 222,731 million) scheduled for conversion within 12 months.
Table ORDER INTAKE, CONVERSION, AND BACKLOG COMPOSITION
Working capital mechanics reveal that work-in-process (WIP) totaled JPY 122,449 million at FY2026 year-end, accounting for 85.99% of total inventories (JPY 142,404 million). Days Sales of Inventory (DSI) measured against cost of goods sold stood at 550.5 days. This metric stems from accounting rules governing Lasertec Corporation’s revenue recognition: systems delivered on-site remain in WIP until completion of customer Final Acceptance Testing (FAT). Downside inventory cancellation exposure is insulated by customer contract advances of JPY 44,284 million.
Table INVENTORY THREE-TIER DECOMPOSITION AND AUDIT METRICS
Manufacturing Footprint, Supply Architecture, and Geopolitics
Lasertec Corporation operates under a fablight operating architecture, concentrating capital on optical calculation, core inspection algorithms, and system integration while outsourcing component fabrication and structural machining.
Table CAPITAL CONCENTRATION ACROSS PRIMARY DOMESTIC FACILITIES
Cost of sales analysis indicates direct materials and outsourcing fees accounted for 84.8% of manufacturing costs in FY2026. Internal manufacturing personnel expenses represented 5.8% (JPY 4,914 million).
Table MANUFACTURING EXPENSE BREAKDOWN (FY2025 VS FY2026)
Field deployment and acceptance testing are coordinated via five wholly-owned regional operating subsidiaries:
* United States: Lasertec U.S.A., Inc. (Santa Clara, California)
* Republic of Korea: Lasertec Korea Corp. (Hwaseong, Gyeonggi-do)
* Taiwan, Province of China: Lasertec Taiwan, Inc. (Hsinchu City)
* China: Lasertec China Co., Ltd. (Shanghai)
* Singapore: Lasertec Singapore Pte. Ltd. (Singapore)
Table GEOGRAPHIC REVENUE ALLOCATION AND CONCENTRATION SHIFTS
Regional performance reflects capex patterns across semiconductor manufacturing nodes. Republic of Korea became the largest market in FY2026 with net sales of JPY 66,075 million (28.67% share), driven by 1b/1c nm DRAM and High-Bandwidth Memory (HBM3e/HBM4) mask screening by Samsung Electronics Co., Ltd. and SK Hynix. Revenue in the United States and Taiwan, Province of China declined 24.0% and 29.7%, respectively, influenced by the timing of cleanroom readiness and FAT execution at Intel Corporation and Taiwan Semiconductor Manufacturing Company Limited [NYSE: TSM].
Top-three customer concentration (CR3) moderated from 79.5% in FY2025 to 62.3% in FY2026:
* Taiwan Semiconductor Manufacturing Company Limited: JPY 49,244 million (21.4%)
* Intel Corporation: JPY 47,692 million (20.7%)
* Samsung Electronics Co., Ltd.: JPY 46,528 million (20.2%)
Table MAJOR CUSTOMER CONCENTRATION TRAJECTORY
Shipments of 13.5nm EUV actinic systems remain subject to export controls under Japan’s Foreign Exchange and Foreign Trade Act (外為法), coordinated with United States BIS guidelines. Revenue from China (included in Other Asia at JPY 31,056 million) is derived from non-restricted legacy deep ultraviolet (DUV) mask inspection equipment (MATRICS series), mask blank inspection systems (MAGICS series), and scanning laser microscopes.
Table COMPREHENSIVE CORPORATE RISK HEATMAP MATRIX
Governance Structure and Forensic Accounting
Lasertec Corporation maintains an Audit and Supervisory Committee governance structure with a 50.0% independent board ratio (4 of 8 directors). The Nomination and Compensation Committee is chaired by independent external director Koji Mihara. Female representation across board directors and statutory auditors stands at 27.3% (3 of 11 members).
Table BOARD COMPOSITION AND COMMITTEE ARCHITECTURE
Executive remuneration heavily weights variable components. Internal executive directors received JPY 1,145 million in FY2026, with performance-linked cash and Restricted Stock Units (RSUs) accounting for 81.84% of compensation.
Table DIRECTOR REMUNERATION AND INCENTIVE SPLIT (FY2026)
Individual disclosures indicate Representative Director and President Tetsuya Sendoda received JPY 188 million (70.74% variable), Chairman Osamu Okabayashi JPY 403 million (87.59% variable), and Vice Chairman Haruhiko Kusunose JPY 403 million (87.59% variable).
Independent auditor Ernst & Young ShinNihon LLC issued an unqualified clean audit opinion. Two Key Audit Matters (KAM) were highlighted:
1. Appropriateness of revenue timing based on factory acceptance tests (FAT/検収) for high-unit equipment (JPY 5,000 million to JPY 8,000+ million per system).
2. Valuation and cost absorption of WIP inventories (JPY 122,449 million).
Forensic analysis highlights conservative R&D accounting practices. Cumulative R&D spending totaled JPY 61,557 million between FY2022 and FY2026, reaching JPY 16,292 million in FY2026 (7.07% of sales). Lasertec Corporation expenses 100% of R&D investments as incurred, carrying zero capitalized development costs on its balance sheet.
Table FIVE-YEAR R&D CAPITALIZATION AUDIT (FY2022–FY2026)
The provision for product warranties remained stable at JPY 2,800 million (1.21% of net sales), showing alignment between warranty reserves and field service outlays. The company reports zero external debt guarantees, zero off-balance-sheet Special Purpose Entities (SPEs), and zero material litigation.
HDIN Institutional Verdict
Lasertec Corporation enters the 2nm and High-NA EUV (0.55 NA) foundry transitions with a high-margin operating profile, characterized by zero financial debt, an expanding services base (25.44% of revenue), and an R&D framework that avoids capitalization.
Table BALANCE SHEET LIQUIDITY AND FORTRESS CAPITAL METRICS
Extended revenue realization cycles—demonstrated by JPY 122,449 million in WIP and a 550.5-day cost-basis DSI—remain an inherent accounting effect of on-site customer final acceptance testing. However, with advance payments covering JPY 44,284 million, a net cash balance of JPY 91,356 million, and ACTIS A200HiT qualification models deployed at leading fab operators, execution risk remains centered on customer cleanroom schedules rather than technological substitution or financial strain.
Presentation Download & Video Access:
- Presentation Download: Click the PDF download link under 'Related Topics' to access the full institutional presentation of this report.
- Video Link: Click this link to watch the HDIN analyst briefing on YouTube.
About HDIN Research:
HDIN Research is a global market intelligence and strategic advisory firm specializing in institutional-grade financial analysis, supply chain audits, and macroeconomic forecasting. Our dedicated sector analysts deliver actionable, data-driven insights tailored for private equity, hedge funds, and corporate strategy teams. Visit us at http://www.hdinresearch.com.
2026 AI Transparency Footer:
This intelligence report was authored by HDIN Research analysts following a rigorous audit of official corporate filings. AI was utilized for massive-scale data synthesis and structural drafting, ensuring 100% inclusion of reported data points. All strategic insights, financial modeling, and final verdicts were verified by our editorial board to ensure professional accuracy and compliance with 2026 Google Search E-E-A-T standards.
1. Lasertec Corporation [TYO: 6920] demonstrated high revenue resilience in FY2026, delivering JPY 230,485 million in net sales with a 45.67% operating margin, bolstered by a 125.7% rebound in order intake (JPY 237,504 million).
2. Physical footprint centralization at Yokohama HQ and the InnoPa facility (JPY 28,457 million total book value) anchors global customer support centers across South Korea, the United States, and Taiwan, mitigating complex FAT lead-time bottlenecks.
3. Balance sheet risk is contained via zero financial debt, JPY 91,503 million in liquid cash, and an order backlog of JPY 322,964 million covered by JPY 44,284 million in non-refundable advances.
Figure Lasertec Corporation (TSE 6920): The Actinic Monopoly & Financial Fortification (FY2022-FY2026)
Financial Architecture and Segmental TrajectoryLasertec Corporation’s five-year financial disclosures (FY2022–FY2026) illustrate a structurally entrenched global monopoly in 13.5nm actinic extreme ultraviolet (EUV) photomask inspection. Group top-line revenue closed FY2026 at JPY 230,485 million, marking an 8.3% cyclical contraction from the historic high of JPY 251,477 million achieved in FY2025. Despite revenue consolidation driven by semiconductor fab expansion rescheduling, gross margin widened by 26 basis points year-over-year to 59.21%, underpinned by higher product realizations for the ACTIS A200HiT generation. Operating income reached JPY 105,259 million, sustaining an operating profit margin (OPM) of 45.67%.
Table LASERTEC FIVE-YEAR CONSOLIDATED EXECUTION METRICS (FY2022–FY2026)
| Metric (JPY Million) | FY2022 | FY2023 | FY2024 | FY2025 | FY2026 | 5-Year CAGR |
|---|---|---|---|---|---|---|
| Net Sales | ¥90,378M | ¥152,832M | ¥213,506M | ¥251,477M | ¥230,485M | +26.37% |
| Gross Profit Margin (%) | N/A | N/A | N/A | 58.95% | 59.21% | — |
| Operating Income | N/A | N/A | N/A | ¥122,843M | ¥105,259M | — |
| Operating Profit Margin (%) | N/A | N/A | N/A | 48.85% | 45.67% | — |
| Ordinary Income | ¥33,582M | ¥63,668M | ¥82,021M | ¥119,444M | ¥107,895M | +33.88% |
| Net Income | ¥24,850M | ¥46,164M | ¥59,076M | ¥84,652M | ¥77,485M | +32.88% |
| Reported Return on Equity (ROE) (%) | 38.9% | 50.8% | 45.4% | 46.9% | 33.9% | — |
| Return on Invested Capital (ROIC) (%) | ~34.2% | ~42.3% | ~39.0% | 41.99% | 30.60% | — |
| Free Cash Flow (FCF) | -¥8,851M | ¥19,978M | ¥29,746M | ¥75,454M | ¥46,657M | — |
| Cash & Cash Equivalents | ¥23,420M | ¥29,773M | ¥38,152M | ¥86,087M | ¥91,503M | +40.64% |
A DuPont breakdown indicates that Lasertec Corporation’s return on equity contracted from a peak of 50.8% in FY2023 to 33.9% in FY2026. This dynamic reflects rapid de-leveraging rather than margin deterioration: net profit margin remained above 33.62% in FY2026, while financial leverage dropped from 2.48x to 1.46x as cumulative net income expanded retained earnings from JPY 146,500 million to JPY 252,900 million.
Table DUPONT PROFITABILITY TRANSMISSION ENGINE
| DuPont Element | FY2022 | FY2023 | FY2024 | FY2025 | FY2026 | Trend / Driver |
|---|---|---|---|---|---|---|
| Net Profit Margin (%) | 27.50% | 30.21% | 27.67% | 33.66% | 33.62% | +612 bps expansion |
| Asset Turnover (x) | 0.506x | 0.679x | 0.787x | 0.837x | 0.692x | Working capital absorption |
| Financial Leverage (x) | 2.46x | 2.48x | 2.08x | 1.66x | 1.46x | De-leveraging (-1.02x) |
| Reported ROE (%) | 38.9% | 50.8% | 45.4% | 46.9% | 33.9% | Retained equity accumulation |
Segment disclosures demonstrate an ongoing mix transformation. Semiconductor-related equipment revenue fell 17.2% year-over-year to JPY 168,090 million (72.93% of group net sales). Conversely, the services division advanced 36.5% to JPY 58,646 million, lifting its top-line contribution to 25.44% and validating post-warranty maintenance capture across an installed base of 13.5nm actinic systems.
Table PRODUCT LINE REVENUE BREAKDOWN
| Segment Classification | FY2025 Revenue (JPY M) | FY2025 Share (%) | FY2026 Revenue (JPY M) | FY2026 Share (%) | YoY Change (%) |
|---|---|---|---|---|---|
| Semiconductor Equipment | ¥202,965M | 80.71% | ¥168,090M | 72.93% | -17.2% |
| Other Products (FPD / Microscopes) | ¥5,552M | 2.21% | ¥3,747M | 1.63% | -32.5% |
| Services & Support | ¥42,959M | 17.08% | ¥58,646M | 25.44% | +36.5% |
| Total Consolidated Net Sales | ¥251,477M | 100.00% | ¥230,485M | 100.00% | -8.3% |
New orders expanded by 125.7% from JPY 105,226 million in FY2025 to JPY 237,504 million in FY2026, lifting the book-to-bill ratio from 0.42x to 1.03x. The total order backlog closed at JPY 322,964 million, with 68.96% (JPY 222,731 million) scheduled for conversion within 12 months.
Table ORDER INTAKE, CONVERSION, AND BACKLOG COMPOSITION
| Fiscal Year | New Orders (JPY M) | Net Sales (JPY M) | Book-to-Bill Ratio | Order Backlog (JPY M) |
|---|---|---|---|---|
| FY2022 | >¥135,000M | ¥90,378M | >1.50x | Rapid growth |
| FY2023 | >¥183,000M | ¥152,832M | >1.20x | Expanding |
| FY2024 | ~¥167,000M | ¥213,506M | ~0.78x | ~¥462,196M |
| FY2025 | ¥105,226M | ¥251,477M | 0.42x | ¥315,945M |
| FY2026 | ¥237,504M | ¥230,485M | 1.03x | ¥322,964M |
Working capital mechanics reveal that work-in-process (WIP) totaled JPY 122,449 million at FY2026 year-end, accounting for 85.99% of total inventories (JPY 142,404 million). Days Sales of Inventory (DSI) measured against cost of goods sold stood at 550.5 days. This metric stems from accounting rules governing Lasertec Corporation’s revenue recognition: systems delivered on-site remain in WIP until completion of customer Final Acceptance Testing (FAT). Downside inventory cancellation exposure is insulated by customer contract advances of JPY 44,284 million.
Table INVENTORY THREE-TIER DECOMPOSITION AND AUDIT METRICS
| Inventory Sub-Category | FY2022 (JPY M) | FY2023 (JPY M) | FY2024 (JPY M) | FY2025 (JPY M) | FY2026 (JPY M) |
|---|---|---|---|---|---|
| Raw Materials & Supplies | ~¥9,200M | ~¥12,400M | ~¥14,800M | ¥15,953M | ¥18,348M |
| Work in Process (WIP) | ~¥51,500M | ~¥78,200M | ~¥112,600M | ¥123,672M | ¥122,449M |
| Finished Goods | ~¥800M | ~¥1,100M | ~¥1,300M | ¥1,489M | ¥1,607M |
| Total Inventories | ~¥61,500M | ~¥91,700M | ~¥128,700M | ¥141,114M | ¥142,404M |
| Days Sales of Inventory (DSI) on Cost of Goods Sold | — | — | — | 499.1 Days | 550.5 Days |
Manufacturing Footprint, Supply Architecture, and Geopolitics
Lasertec Corporation operates under a fablight operating architecture, concentrating capital on optical calculation, core inspection algorithms, and system integration while outsourcing component fabrication and structural machining.
Table CAPITAL CONCENTRATION ACROSS PRIMARY DOMESTIC FACILITIES
| Facility Base | Location | Land / Footprint | Book Value (JPY M) | Key Functional Charter |
|---|---|---|---|---|
| Headquarters (HQ) | Yokohama, Kanagawa | 4,872 m² (Land) | ¥9,283M | Corporate executive headquarters; system R&D |
| Lasertec Innovation Park | Yokohama, Kanagawa | 15,829 m² (Land) | ¥19,174M | Advanced cleanroom assembly; testing |
| Total Domestic PP&E Assets | Kanagawa Prefecture | — | ¥28,457M | >90% of total tangible group assets |
Cost of sales analysis indicates direct materials and outsourcing fees accounted for 84.8% of manufacturing costs in FY2026. Internal manufacturing personnel expenses represented 5.8% (JPY 4,914 million).
Table MANUFACTURING EXPENSE BREAKDOWN (FY2025 VS FY2026)
| Manufacturing Cost Element | FY2025 (JPY M) | FY2025 Share (%) | FY2026 (JPY M) | FY2026 Share (%) | YoY Change (%) |
|---|---|---|---|---|---|
| Direct Materials Cost | ¥69,157M | 71.4% | ¥55,829M | 66.1% | -19.3% |
| Direct Labor Cost | ¥4,818M | 5.0% | ¥4,914M | 5.8% | +2.0% |
| Outsourcing Processing Fees | ¥15,035M | 15.5% | ¥15,848M | 18.7% | +5.4% |
| Depreciation & Other Overheads | ¥7,813M | 8.1% | ¥7,922M | 9.4% | +1.4% |
| Total Manufacturing Costs | ¥96,823M | 100.0% | ¥84,513M | 100.0% | -12.7% |
Field deployment and acceptance testing are coordinated via five wholly-owned regional operating subsidiaries:
* United States: Lasertec U.S.A., Inc. (Santa Clara, California)
* Republic of Korea: Lasertec Korea Corp. (Hwaseong, Gyeonggi-do)
* Taiwan, Province of China: Lasertec Taiwan, Inc. (Hsinchu City)
* China: Lasertec China Co., Ltd. (Shanghai)
* Singapore: Lasertec Singapore Pte. Ltd. (Singapore)
Table GEOGRAPHIC REVENUE ALLOCATION AND CONCENTRATION SHIFTS
| Geographic Market (UN Standard) | FY2025 Revenue (JPY M) | FY2025 Share (%) | FY2026 Revenue (JPY M) | FY2026 Share (%) | YoY Change (%) |
|---|---|---|---|---|---|
| Republic of Korea | ¥53,645M | 21.33% | ¥66,075M | 28.67% | +23.2% |
| United States | ¥67,938M | 27.02% | ¥51,610M | 22.39% | -24.0% |
| Taiwan, Province of China | ¥65,268M | 25.95% | ¥45,854M | 19.89% | -29.7% |
| Other Asia (including China) | ¥23,615M | 9.39% | ¥31,056M | 13.47% | +31.5% |
| Japan | ¥20,687M | 8.23% | ¥28,127M | 12.20% | +36.0% |
| Europe | ¥20,320M | 8.08% | ¥7,759M | 3.37% | -61.8% |
| Total Group Revenue | ¥251,477M | 100.00% | ¥230,485M | 100.00% | -8.3% |
Regional performance reflects capex patterns across semiconductor manufacturing nodes. Republic of Korea became the largest market in FY2026 with net sales of JPY 66,075 million (28.67% share), driven by 1b/1c nm DRAM and High-Bandwidth Memory (HBM3e/HBM4) mask screening by Samsung Electronics Co., Ltd. and SK Hynix. Revenue in the United States and Taiwan, Province of China declined 24.0% and 29.7%, respectively, influenced by the timing of cleanroom readiness and FAT execution at Intel Corporation and Taiwan Semiconductor Manufacturing Company Limited [NYSE: TSM].
Top-three customer concentration (CR3) moderated from 79.5% in FY2025 to 62.3% in FY2026:
* Taiwan Semiconductor Manufacturing Company Limited: JPY 49,244 million (21.4%)
* Intel Corporation: JPY 47,692 million (20.7%)
* Samsung Electronics Co., Ltd.: JPY 46,528 million (20.2%)
Table MAJOR CUSTOMER CONCENTRATION TRAJECTORY
| Customer Identity | FY2025 Sales (JPY M) | FY2025 Share (%) | FY2026 Sales (JPY M) | FY2026 Share (%) |
|---|---|---|---|---|
| Taiwan Semiconductor Mfg. Co. | ¥66,050M | 26.3% | ¥49,244M | 21.4% |
| Intel Corporation | ¥83,718M | 33.3% | ¥47,692M | 20.7% |
| Samsung Electronics Co., Ltd. | ¥49,982M | 19.9% | ¥46,528M | 20.2% |
| Combined Top-3 Customers (CR3) | ¥199,750M | 79.5% | ¥143,464M | 62.3% |
Shipments of 13.5nm EUV actinic systems remain subject to export controls under Japan’s Foreign Exchange and Foreign Trade Act (外為法), coordinated with United States BIS guidelines. Revenue from China (included in Other Asia at JPY 31,056 million) is derived from non-restricted legacy deep ultraviolet (DUV) mask inspection equipment (MATRICS series), mask blank inspection systems (MAGICS series), and scanning laser microscopes.
Table COMPREHENSIVE CORPORATE RISK HEATMAP MATRIX
| Risk Classification Element | Likelihood | Impact Severity | Disclosed Mechanism & Operational Impact |
|---|---|---|---|
| Export Controls & Sanctions | High | Critical | Restrictions on advanced semiconductor equipment exports may limit access to certain markets, including potential constraints on advanced EUV-related equipment deliveries to China. |
| Customer Concentration (CR3) | High | High | The top three customers account for 62.3% of total group sales, creating exposure to changes in customer investment cycles and procurement decisions. |
| Site FAT Acceptance Timings | High | High | Revenue recognition depends on customer site acceptance (FAT/SAT processes), which may affect shipment timing and sales recognition periods. |
| FX Currency Volatility | High | Medium | Exposure arises from foreign-currency-denominated sales versus JPY-based costs, with FY2026 including a reported positive FX impact of approximately ¥2.06B. |
| Optical Single-Source Supply | Medium | High | Proprietary EUV illumination components rely on specialized suppliers and limited alternative sources, creating potential supply-chain constraints. |
| Disruptive Defect Modalities | Medium | Critical | Development of next-generation inspection technologies, including multi-beam e-beam inspection, requires sustained R&D investment and carries technology execution risks. |
Governance Structure and Forensic Accounting
Lasertec Corporation maintains an Audit and Supervisory Committee governance structure with a 50.0% independent board ratio (4 of 8 directors). The Nomination and Compensation Committee is chaired by independent external director Koji Mihara. Female representation across board directors and statutory auditors stands at 27.3% (3 of 11 members).
Table BOARD COMPOSITION AND COMMITTEE ARCHITECTURE
| Governance Parameter | Total Count | Internal Members | External Independent | Governance Percentage |
|---|---|---|---|---|
| Board of Directors | 8 | 4 | 4 | 50.0% Independent |
| Statutory Auditors (Kansayaku) | 3 | 1 | 2 | 66.7% Independent |
| Nomination & Compensation Committee | 7 | 3 | 4 | Independent Chairman |
| Female Executive Officers | 11 | 8 | 3 | 27.3% Diversity |
Executive remuneration heavily weights variable components. Internal executive directors received JPY 1,145 million in FY2026, with performance-linked cash and Restricted Stock Units (RSUs) accounting for 81.84% of compensation.
Table DIRECTOR REMUNERATION AND INCENTIVE SPLIT (FY2026)
| Director Classification | Count | Base Pay (JPY M) | Performance Cash | RSU Stock Awards | Variable Ratio |
|---|---|---|---|---|---|
| Internal Executive Directors | 4 | ¥207M (18.08%) | ¥818M (71.44%) | ¥120M (10.48%) | 81.84% |
| Internal Statutory Auditors | 2 | ¥30M (100.0%) | ¥0 | ¥0 | 0.0% |
| Independent External Directors | 4 | ¥67M (100.0%) | ¥0 | ¥0 | 0.0% |
| External Statutory Auditors | 2 | ¥26M (100.0%) | ¥0 | ¥0 | 0.0% |
Individual disclosures indicate Representative Director and President Tetsuya Sendoda received JPY 188 million (70.74% variable), Chairman Osamu Okabayashi JPY 403 million (87.59% variable), and Vice Chairman Haruhiko Kusunose JPY 403 million (87.59% variable).
Independent auditor Ernst & Young ShinNihon LLC issued an unqualified clean audit opinion. Two Key Audit Matters (KAM) were highlighted:
1. Appropriateness of revenue timing based on factory acceptance tests (FAT/検収) for high-unit equipment (JPY 5,000 million to JPY 8,000+ million per system).
2. Valuation and cost absorption of WIP inventories (JPY 122,449 million).
Forensic analysis highlights conservative R&D accounting practices. Cumulative R&D spending totaled JPY 61,557 million between FY2022 and FY2026, reaching JPY 16,292 million in FY2026 (7.07% of sales). Lasertec Corporation expenses 100% of R&D investments as incurred, carrying zero capitalized development costs on its balance sheet.
Table FIVE-YEAR R&D CAPITALIZATION AUDIT (FY2022–FY2026)
| Fiscal Year | R&D Spend (JPY M) | Net Sales (JPY M) | R&D / Sales Ratio (%) | Capitalized Development |
|---|---|---|---|---|
| FY2022 | ¥7,120M | ¥90,378M | 7.88% | ¥0 |
| FY2023 | ¥10,180M | ¥152,832M | 6.66% | ¥0 |
| FY2024 | ¥13,120M | ¥213,506M | 6.15% | ¥0 |
| FY2025 | ¥14,845M | ¥251,477M | 5.90% | ¥0 |
| FY2026 | ¥16,292M | ¥230,485M | 7.07% | ¥0 |
| Five-Year Cumulative | ¥61,557M | ¥938,678M | 6.56% | ¥0 (100% Expensed) |
The provision for product warranties remained stable at JPY 2,800 million (1.21% of net sales), showing alignment between warranty reserves and field service outlays. The company reports zero external debt guarantees, zero off-balance-sheet Special Purpose Entities (SPEs), and zero material litigation.
HDIN Institutional Verdict
Lasertec Corporation enters the 2nm and High-NA EUV (0.55 NA) foundry transitions with a high-margin operating profile, characterized by zero financial debt, an expanding services base (25.44% of revenue), and an R&D framework that avoids capitalization.
Table BALANCE SHEET LIQUIDITY AND FORTRESS CAPITAL METRICS
| Liquidity & Safety Metric | FY2025/6 Period-End | FY2026/6 Period-End | Delta / Financial Posture |
|---|---|---|---|
| Current Ratio (%) | 243.27% | 341.66% | +9,839 bps liquidity improvement |
| Quick Ratio (%) | 94.03% | 137.16% | +4,313 bps coverage improvement |
| Total Cash & Equivalents | ¥86,087M | ¥91,503M | +6.29% expansion |
| Interest-Bearing Debt (Leases) | ¥178M | ¥147M | Reduced to 0.044% of net assets |
| Net Cash Position | ¥85,909M | ¥91,356M | Strengthened liquidity position |
| Undrawn Bank Commitment Lines | ¥40,000M | ¥40,000M | No drawdown utilization |
| Shareholders' Equity Ratio | 63.70% | 73.30% | +960 bps structural improvement |
Extended revenue realization cycles—demonstrated by JPY 122,449 million in WIP and a 550.5-day cost-basis DSI—remain an inherent accounting effect of on-site customer final acceptance testing. However, with advance payments covering JPY 44,284 million, a net cash balance of JPY 91,356 million, and ACTIS A200HiT qualification models deployed at leading fab operators, execution risk remains centered on customer cleanroom schedules rather than technological substitution or financial strain.
Presentation Download & Video Access:
- Presentation Download: Click the PDF download link under 'Related Topics' to access the full institutional presentation of this report.
- Video Link: Click this link to watch the HDIN analyst briefing on YouTube.
About HDIN Research:
HDIN Research is a global market intelligence and strategic advisory firm specializing in institutional-grade financial analysis, supply chain audits, and macroeconomic forecasting. Our dedicated sector analysts deliver actionable, data-driven insights tailored for private equity, hedge funds, and corporate strategy teams. Visit us at http://www.hdinresearch.com.
2026 AI Transparency Footer:
This intelligence report was authored by HDIN Research analysts following a rigorous audit of official corporate filings. AI was utilized for massive-scale data synthesis and structural drafting, ensuring 100% inclusion of reported data points. All strategic insights, financial modeling, and final verdicts were verified by our editorial board to ensure professional accuracy and compliance with 2026 Google Search E-E-A-T standards.