Hays PLC: Portfolio Retrenchment to 16 Markets Accelerates as Statutory Losses Reach £54.5 Million Amid Contracting Shift
Date : 2026-09-28
Reading : 539
HDIN Executive Takeaways
1. Hays PLC [LON: HAS] absorbed £89.6 million in exceptional charges in FY26, triggering a statutory pre-tax loss of £54.5 million, while pre-exceptional operating profit rose 3% like-for-like to £48.6 million.
2. Under its "Momentum" restructuring, the group is retrenching physical operations from 31 countries to 16 core hubs, shuttering 74 branch offices, and divesting six European operations to Meraki Capital for £4.0 million.
3. Executive cash bonuses paid out at 100% on cash conversion despite a basic EPS collapse to (3.64)p, exploiting counter-cyclical working capital inflows of £24.9 million during fee contractions.
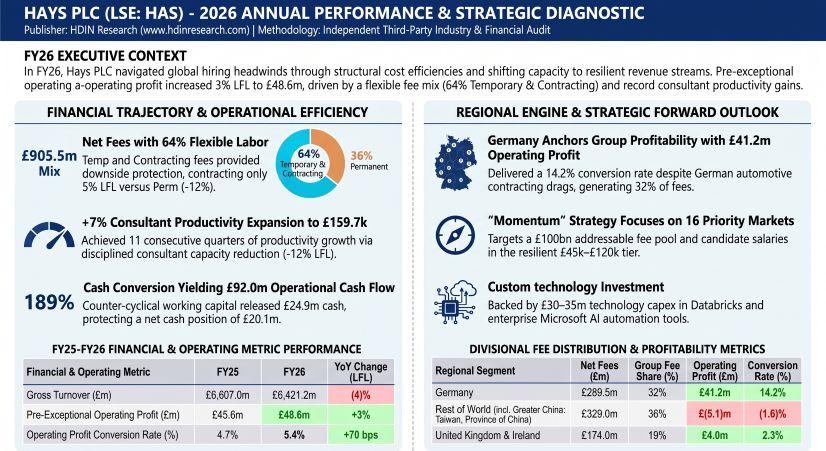
Figure HAYS PLC - 2026 ANNUAL PERFORMANCE & STRATEGIC DIAGNOSTIC
 Segmental Realities and Operating Margin Dislocation
Hays PLC recorded a 3% reported (4% like-for-like) decline in gross turnover to £6,421.2 million for the fiscal year ended 30 June 2026, down from £6,607.0 million in FY25. Net fee income (gross profit) contracted 7% reported (8% like-for-like) to £905.5 million compared to £972.4 million in the prior period. The steeper decline in net fees relative to turnover reflects resilience in high-pass-through flexible staffing alongside a sharp contraction in pure-margin permanent recruitment. Temporary worker remuneration absorbed £4,524.4 million (FY25: £4,619.6 million, down 2%), while pass-through payments to third-party agencies under Managed Service Programmes (MSP) stood at £991.3 million (FY25: £1,015.0 million, down 2%).
The revenue mix shifted toward flexible workforce solutions, with Temporary & Contracting representing 64% of group net fees (£579.5 million), up from 62% in FY25, 59% in FY24, 57% in FY23, 55% in FY22, 58% in FY15, and 49% at the FY08 peak. Temporary & Contracting net fees fell 5% like-for-like, impacted by a 4% volume contraction and a 1% drag (c.£6.0 million) from reduced contractor working hours in the German industrial and automotive segments. Underlying temporary recruitment gross margins compressed by 20 basis points to 15.1% (FY25: 15.3%). Permanent recruitment fees contracted 12% like-for-like to £326.0 million (36% of net fees) due to a 16% placement volume decline, cushioned by a 2% increase in average placement fees.
By service line, Recruitment (Spot and Preferred Supplier List panels) generated c.55% of group net fees (Spot c.40%, PSL c.15%). Enterprise Solutions accounted for c.25% (MSP c.20%, Recruitment Process Outsourcing / RPO c.5%). Services, providing Statement of Work (SoW) deliverables billed on time-and-materials, delivered c.20% of net fees.
Table Regional Financial Performance and Operating Metrics by Segment (FY2026)
The group pre-exceptional operating profit rose 3% like-for-like (+7% reported) to £48.6 million (FY25: £45.6 million), expanding the operating conversion rate by 70 basis points to 5.4% (FY25: 4.7%). Margin resilience stemmed from an 8% like-for-like reduction in operating costs (£75.1 million saved), achieving £45.0 million in annualized structural savings in FY26 ahead of schedule, bringing cumulative structural overhead reductions since FY24 to c.£115.0 million. Consultant net fee productivity rose 7% to £159.7k per consultant (FY25: £149.0k; FY24: £140.9k; FY23: £144.3k; FY22: £139.9k), marking 11 consecutive quarters of seasonally adjusted productivity gains.
Total placements completed reached 243,700 (-5.5% YoY), split between c.203,000 temporary and contracting starts (-6.5%) and c.40,000 permanent placements (-2.4%). Across key functional disciplines, Technology represented 26% of net fees (£235.4m, -1% LFL); Finance & Accounting 18% (£163.0m, -12% LFL); Construction & Property 14% (£126.8m, +3% LFL); Engineering 10% (£90.6m, pressured by German auto weakness); Life Sciences 4% (£36.2m); Human Resources 4% (£36.2m); Office Support 5% (£45.3m); and Other disciplines 19% (£172.0m).
The statutory operating loss landed at £(41.0) million after recognizing £89.6 million in pre-tax exceptional charges (FY25: £30.7 million):
* Operational restructuring charges of £45.1 million, including £35.2 million in staff severance and £9.9 million in advisory fees.
* Property portfolio rationalization of £26.6 million, covering £14.0 million in accelerated right-of-use (RoU) asset depreciation, £9.7 million in surrender costs, £2.0 million in fixture write-offs, and £0.9 million in lease impairments.
* European disposal losses of £8.0 million from the sale of subsidiaries across six countries.
* Impairment charges of £9.9 million, encompassing £6.9 million in IAS 36 goodwill impairments (£4.7 million in Belgium, £2.2 million in the Netherlands) and £3.0 million in software intangibles.
Net finance costs stood at £(13.5) million (FY25: £(13.4) million), driving statutory loss before tax to £(54.5) million (underlying pre-exceptional PBT: £35.1 million, +9%). Statutory taxation expense of £(3.7) million included a £12.1 million exceptional tax adjustment, yielding underlying tax of £(15.8) million (FY25: £(11.3) million). Underlying profit after tax was £19.3 million (-8%), contrasting with a statutory loss after tax of £(58.2) million. Statutory basic EPS fell to (3.64)p, compared to normalized pre-exceptional EPS of 1.21p (FY25: 1.31p).
Operating cash conversion reached 189% (FY25: 281%), with operational cash flow post-IFRS 16 lease liability payments (£43.8 million) generating £92.0 million (FY25: £128.3 million). Counter-cyclical working capital released £24.9 million (FY25: £58.1 million inflow), driven by a £56.0 million trade receivable contraction offset by a £(31.1) million drop in trade payables. Days Sales Outstanding improved by 1 day to 36 days, with an expected credit loss credit of £0.4 million. After cash taxes of £(19.8) million and net interest of £(8.2) million, normalized free cash flow stood at £64.0 million (or £39.9 million after deducting £24.1 million in technology capital expenditures). Cash outlays for exceptional restructurings totaled £42.0 million, own share purchases absorbed £11.7 million, and total dividends paid totaled £7.0 million. Net cash (pre-IFRS 16) closed at £20.1 million (FY25: £37.0 million), composed of £111.8 million in cash, £(26.7) million in overdrafts, and £(65.0) million in drawn credit lines. Including IFRS 16 lease liabilities of £(153.2) million, net debt settled at £(133.1) million (FY25: £(143.7) million). Undrawn revolving credit facility capacity stood at £175.0 million on an unsecured £240.0 million facility expiring October 2029. Total core dividends were reset to 0.44p per share (£7.0 million; final proposed 0.29p, interim paid 0.15p), down from 1.24p in FY25, providing 2.8x cover against pre-exceptional EPS.
Infrastructure Footprint and Shared Service Consolidation
To lower operational unit economics, Hays PLC restructured its global real estate and delivery infrastructure during FY26, consolidating its physical network from 229 offices down to 155 branches. This reduction of 74 offices generated c.£10.0 million in annualized property savings. Network consolidation centered on the UK & Ireland, where 30 offices were closed alongside regional management delayering, and Australia & New Zealand, which shuttered 11 offices. Branch footprints across France, Germany, Belgium, and North America were consolidated into metropolitan hubs.
Under its Momentum operating framework, the corporate footprint is being curtailed from 31 operating countries to 16 core focus markets across 9 regional clusters: DACH, UK&I, ANZ, Southern Europe, France, Poland, North America, Japan, and India. These 16 priority territories represent an addressable net fee pool of c.£100 billion, projected to grow at a 3.4% compound annual growth rate through 2030, and account for c. two-thirds of global recruitment net fees.
The group completed exits across 10 countries in FY26. It shuttered recruitment operations in Chile, Colombia, Mexico, and Thailand, and finalized the divestment of subsidiaries across six European countries (Czech Republic, Denmark, Hungary, Luxembourg, Romania, Sweden) to Meraki Capital on 16 June 2026 for net cash proceeds of c.£4.0 million. Strategic review procedures remain active across seven additional markets: Belgium, Brazil, Greater China (strictly adhering to United Nations standards, including Taiwan, Province of China), Malaysia, the Netherlands, Singapore, and the United Arab Emirates.
Operational delivery has been separated from localized branch administration:
* Shared Service Infrastructure: Back-office finance and administrative transactions have been centralized into regional shared service centers, anchored by operations in Lisbon, Portugal.
* Sourcing Hub Architecture: Enterprise candidate delivery for large MSP frameworks and Statements of Work is routed through centralized low-cost Centres of Excellence located in Lisbon and Warsaw, Poland.
* Digital Architecture: The core candidate pool of 10+ million profiles, processing c.40,000 weekly interactions, was unified onto a central Databricks data lake. In July 2026, the group completed the deployment of enterprise Microsoft AI tools (Microsoft E7) to automate candidate search and matching under a mandatory human-in-the-loop governance structure. Proprietary vendor management is deployed via the 3SS platform within the Hays Digital Platform.
Total group workforce contracted 12% like-for-like (-14.7% reported) to 8,125 employees (FY25: 9,523). Sales capacity adjusted through a 12% like-for-like reduction in fee-earning consultants to 5,194 (FY25: 6,070). Non-consultant support headcount fell 13% like-for-like to 2,931 (FY25: 3,453), preserving a consultant-to-support staff operating leverage ratio of 1.77:1 (FY25: 1.76:1). Approximately 75% of operating costs remain people-related, with variable performance commissions representing 10% to 15% of total remuneration, alongside employee attrition rates of 23% voluntary and 11% involuntary (34% combined).
HDIN Institutional Verdict
Hays PLC's underlying operational resilience masks structural governance and accounting contradictions that institutional investors must price into valuation multiples:
Management's capital allocation strategy reveals defensive concessions. The board abandoned its static £100 million cash buffer, slashed distributions to shareholders by 65% to £7.0 million, and spent £42.0 million in cash restructuring expenses to generate £45.0 million in annualized savings. While leadership points to an operating cash conversion rate of 189%, this performance is mechanically driven by the unwind of trade receivables during structural revenue contractions. In staffing models, cash generation surges as billings fall.
This dynamic created an incentive distortion inside the executive remuneration framework. Chief Executive Mark Dearnley (appointed 18 May 2026 following Dirk Hahn's resignation on 27 February 2026, which followed an interim executive chair structure under Michael Findlay from 10 November 2025 to 5 January 2026 that temporarily departed from UK Corporate Governance Code Provision 9) received an annual bonus out-turn of 65.2% of maximum (£204k bonus on £226k fixed pay; £430k total). Chief Financial Officer James Hilton received a 66.4% bonus out-turn (£482k bonus on £526k fixed pay; £136k PSP; £1,144k total), and former CEO Dirk Hahn received £1,159k total (£535k fixed, £425k bonus, £199k PSP).
Crucially, the Operating Cash Conversion KPI hit 189%, surpassing the 105% maximum threshold and delivering a 100% maximum payout under both the Annual Bonus and the 2023 PSP (which vested at 50% overall). This maximum cash payout counterbalanced the total failure of Long-Term Incentive metrics tied to cumulative EPS (6.55p achieved vs. 24.0p minimum target; 0% vesting) and relative Total Shareholder Return (-54.2% return vs. -23.9% minimum quartile; 0% vesting). Executives were rewarded for managing balance sheet shrinkage caused by contracting fees.
Looking to FY27, management guidance calls for c.£50.0 million in additional structural cost savings, technology capital expenditures of £30.0 to £35.0 million, net finance charges of c.£12.0 million (down from £13.5 million due to reduced RoU interest on surrendered leases), and an effective tax rate slightly below 45.0%. Currency exposures remain an operational sensitivity, where each 1-cent movement in the Euro/Sterling cross (€1.1506 FY26 average) shifts net fees by c.£3.9 million and operating profit by c.£0.6 million; each 1-cent move in the Australian Dollar (AUD 1.9805 FY26 average) impacts fees by c.£0.6 million and operating profit by c.£0.1 million. While the shift away from low-margin entry staffing toward £45k–£120k technical roles insulates the firm against immediate AI disintermediation, conversion margin targets of 25%+ remain dependent on a recovery in permanent hiring job churn, which collapsed 16% across major markets in FY26.
Presentation Download & Video Access:
Presentation Download: Click the PDF download link under 'Related Topics' to access the full institutional presentation of this report.
Video Link: Click this link to watch the HDIN analyst briefing on YouTube.
About HDIN Research:
HDIN Research is a global market intelligence and strategic advisory firm specializing in institutional-grade financial analysis, supply chain audits, and macroeconomic forecasting. Our dedicated sector analysts deliver actionable, data-driven insights tailored for private equity, hedge funds, and corporate strategy teams. Visit us at [http://www.hdinresearch.com](http://www.hdinresearch.com).
2026 AI Transparency Footer:
"This intelligence report was authored by HDIN Research analysts following a rigorous audit of official corporate filings. AI was utilized for massive-scale data synthesis and structural drafting, ensuring 100% inclusion of reported data points. All strategic insights, financial modeling, and final verdicts were verified by our editorial board to ensure professional accuracy and compliance with 2026 Google Search E-E-A-T standards."
1. Hays PLC [LON: HAS] absorbed £89.6 million in exceptional charges in FY26, triggering a statutory pre-tax loss of £54.5 million, while pre-exceptional operating profit rose 3% like-for-like to £48.6 million.
2. Under its "Momentum" restructuring, the group is retrenching physical operations from 31 countries to 16 core hubs, shuttering 74 branch offices, and divesting six European operations to Meraki Capital for £4.0 million.
3. Executive cash bonuses paid out at 100% on cash conversion despite a basic EPS collapse to (3.64)p, exploiting counter-cyclical working capital inflows of £24.9 million during fee contractions.
Figure HAYS PLC - 2026 ANNUAL PERFORMANCE & STRATEGIC DIAGNOSTIC
Segmental Realities and Operating Margin DislocationHays PLC recorded a 3% reported (4% like-for-like) decline in gross turnover to £6,421.2 million for the fiscal year ended 30 June 2026, down from £6,607.0 million in FY25. Net fee income (gross profit) contracted 7% reported (8% like-for-like) to £905.5 million compared to £972.4 million in the prior period. The steeper decline in net fees relative to turnover reflects resilience in high-pass-through flexible staffing alongside a sharp contraction in pure-margin permanent recruitment. Temporary worker remuneration absorbed £4,524.4 million (FY25: £4,619.6 million, down 2%), while pass-through payments to third-party agencies under Managed Service Programmes (MSP) stood at £991.3 million (FY25: £1,015.0 million, down 2%).
The revenue mix shifted toward flexible workforce solutions, with Temporary & Contracting representing 64% of group net fees (£579.5 million), up from 62% in FY25, 59% in FY24, 57% in FY23, 55% in FY22, 58% in FY15, and 49% at the FY08 peak. Temporary & Contracting net fees fell 5% like-for-like, impacted by a 4% volume contraction and a 1% drag (c.£6.0 million) from reduced contractor working hours in the German industrial and automotive segments. Underlying temporary recruitment gross margins compressed by 20 basis points to 15.1% (FY25: 15.3%). Permanent recruitment fees contracted 12% like-for-like to £326.0 million (36% of net fees) due to a 16% placement volume decline, cushioned by a 2% increase in average placement fees.
By service line, Recruitment (Spot and Preferred Supplier List panels) generated c.55% of group net fees (Spot c.40%, PSL c.15%). Enterprise Solutions accounted for c.25% (MSP c.20%, Recruitment Process Outsourcing / RPO c.5%). Services, providing Statement of Work (SoW) deliverables billed on time-and-materials, delivered c.20% of net fees.
Table Regional Financial Performance and Operating Metrics by Segment (FY2026)
| Financial Dimension / Segment | Germany | United Kingdom & Ireland (UK&I) | Australia & New Zealand (ANZ) | Rest of World (RoW) | Group Total (FY2026) |
|---|---|---|---|---|---|
| Gross Turnover (£m) | £1,668.7 | £1,442.3 | £1,053.5 | £2,256.7 | £6,421.2 |
| Net Fees (£m) | £289.5 | £174.0 | £113.0 | £329.0 | £905.5 |
| Reported / LFL YoY Growth (%) | (6)% / (9)% | (9)% / (10)% | (3)% / (3)% | (7)% / (6)% | (7)% / (8)% |
| Pre-Exceptional Operating Profit (£m) | £41.2 | £4.0 | £8.5 | £(5.1) | £48.6 |
| LFL Operating Profit Growth (%) | (24)% | +169% | +130% | (11)% | +3% |
| Pre-Exceptional Conversion Rate (%) | 14.2% | 2.3% | 7.5% | (1.6)% | 5.4% |
| Conversion Rate YoY Change (bps) | (270) bps | +530 bps | +440 bps | (40) bps | +70 bps |
| Exceptional Charges (£m) | £(44.2) | £(13.9) | £(5.9) | £(25.6) | £(89.6) |
| Post-Exceptional Operating Profit (£m) | £(3.0) | £(9.9) | £2.6 | £(30.7) | £(41.0) |
| Year-End Consultants | 1,368 | 1,080 | 618 | 2,128 | 5,194 |
| LFL Consultant Change (%) | (16)% | (16)% | (8)% | (8)% | (12)% |
| Total Closing Staff | 2,030 | 2,095 | 918 | 3,082 | 8,125 |
| Active Office Network | 25 | 29 | 23 | 78 | 155 |
The group pre-exceptional operating profit rose 3% like-for-like (+7% reported) to £48.6 million (FY25: £45.6 million), expanding the operating conversion rate by 70 basis points to 5.4% (FY25: 4.7%). Margin resilience stemmed from an 8% like-for-like reduction in operating costs (£75.1 million saved), achieving £45.0 million in annualized structural savings in FY26 ahead of schedule, bringing cumulative structural overhead reductions since FY24 to c.£115.0 million. Consultant net fee productivity rose 7% to £159.7k per consultant (FY25: £149.0k; FY24: £140.9k; FY23: £144.3k; FY22: £139.9k), marking 11 consecutive quarters of seasonally adjusted productivity gains.
Total placements completed reached 243,700 (-5.5% YoY), split between c.203,000 temporary and contracting starts (-6.5%) and c.40,000 permanent placements (-2.4%). Across key functional disciplines, Technology represented 26% of net fees (£235.4m, -1% LFL); Finance & Accounting 18% (£163.0m, -12% LFL); Construction & Property 14% (£126.8m, +3% LFL); Engineering 10% (£90.6m, pressured by German auto weakness); Life Sciences 4% (£36.2m); Human Resources 4% (£36.2m); Office Support 5% (£45.3m); and Other disciplines 19% (£172.0m).
The statutory operating loss landed at £(41.0) million after recognizing £89.6 million in pre-tax exceptional charges (FY25: £30.7 million):
* Operational restructuring charges of £45.1 million, including £35.2 million in staff severance and £9.9 million in advisory fees.
* Property portfolio rationalization of £26.6 million, covering £14.0 million in accelerated right-of-use (RoU) asset depreciation, £9.7 million in surrender costs, £2.0 million in fixture write-offs, and £0.9 million in lease impairments.
* European disposal losses of £8.0 million from the sale of subsidiaries across six countries.
* Impairment charges of £9.9 million, encompassing £6.9 million in IAS 36 goodwill impairments (£4.7 million in Belgium, £2.2 million in the Netherlands) and £3.0 million in software intangibles.
Net finance costs stood at £(13.5) million (FY25: £(13.4) million), driving statutory loss before tax to £(54.5) million (underlying pre-exceptional PBT: £35.1 million, +9%). Statutory taxation expense of £(3.7) million included a £12.1 million exceptional tax adjustment, yielding underlying tax of £(15.8) million (FY25: £(11.3) million). Underlying profit after tax was £19.3 million (-8%), contrasting with a statutory loss after tax of £(58.2) million. Statutory basic EPS fell to (3.64)p, compared to normalized pre-exceptional EPS of 1.21p (FY25: 1.31p).
Operating cash conversion reached 189% (FY25: 281%), with operational cash flow post-IFRS 16 lease liability payments (£43.8 million) generating £92.0 million (FY25: £128.3 million). Counter-cyclical working capital released £24.9 million (FY25: £58.1 million inflow), driven by a £56.0 million trade receivable contraction offset by a £(31.1) million drop in trade payables. Days Sales Outstanding improved by 1 day to 36 days, with an expected credit loss credit of £0.4 million. After cash taxes of £(19.8) million and net interest of £(8.2) million, normalized free cash flow stood at £64.0 million (or £39.9 million after deducting £24.1 million in technology capital expenditures). Cash outlays for exceptional restructurings totaled £42.0 million, own share purchases absorbed £11.7 million, and total dividends paid totaled £7.0 million. Net cash (pre-IFRS 16) closed at £20.1 million (FY25: £37.0 million), composed of £111.8 million in cash, £(26.7) million in overdrafts, and £(65.0) million in drawn credit lines. Including IFRS 16 lease liabilities of £(153.2) million, net debt settled at £(133.1) million (FY25: £(143.7) million). Undrawn revolving credit facility capacity stood at £175.0 million on an unsecured £240.0 million facility expiring October 2029. Total core dividends were reset to 0.44p per share (£7.0 million; final proposed 0.29p, interim paid 0.15p), down from 1.24p in FY25, providing 2.8x cover against pre-exceptional EPS.
Infrastructure Footprint and Shared Service Consolidation
To lower operational unit economics, Hays PLC restructured its global real estate and delivery infrastructure during FY26, consolidating its physical network from 229 offices down to 155 branches. This reduction of 74 offices generated c.£10.0 million in annualized property savings. Network consolidation centered on the UK & Ireland, where 30 offices were closed alongside regional management delayering, and Australia & New Zealand, which shuttered 11 offices. Branch footprints across France, Germany, Belgium, and North America were consolidated into metropolitan hubs.
Under its Momentum operating framework, the corporate footprint is being curtailed from 31 operating countries to 16 core focus markets across 9 regional clusters: DACH, UK&I, ANZ, Southern Europe, France, Poland, North America, Japan, and India. These 16 priority territories represent an addressable net fee pool of c.£100 billion, projected to grow at a 3.4% compound annual growth rate through 2030, and account for c. two-thirds of global recruitment net fees.
The group completed exits across 10 countries in FY26. It shuttered recruitment operations in Chile, Colombia, Mexico, and Thailand, and finalized the divestment of subsidiaries across six European countries (Czech Republic, Denmark, Hungary, Luxembourg, Romania, Sweden) to Meraki Capital on 16 June 2026 for net cash proceeds of c.£4.0 million. Strategic review procedures remain active across seven additional markets: Belgium, Brazil, Greater China (strictly adhering to United Nations standards, including Taiwan, Province of China), Malaysia, the Netherlands, Singapore, and the United Arab Emirates.
Operational delivery has been separated from localized branch administration:
* Shared Service Infrastructure: Back-office finance and administrative transactions have been centralized into regional shared service centers, anchored by operations in Lisbon, Portugal.
* Sourcing Hub Architecture: Enterprise candidate delivery for large MSP frameworks and Statements of Work is routed through centralized low-cost Centres of Excellence located in Lisbon and Warsaw, Poland.
* Digital Architecture: The core candidate pool of 10+ million profiles, processing c.40,000 weekly interactions, was unified onto a central Databricks data lake. In July 2026, the group completed the deployment of enterprise Microsoft AI tools (Microsoft E7) to automate candidate search and matching under a mandatory human-in-the-loop governance structure. Proprietary vendor management is deployed via the 3SS platform within the Hays Digital Platform.
Total group workforce contracted 12% like-for-like (-14.7% reported) to 8,125 employees (FY25: 9,523). Sales capacity adjusted through a 12% like-for-like reduction in fee-earning consultants to 5,194 (FY25: 6,070). Non-consultant support headcount fell 13% like-for-like to 2,931 (FY25: 3,453), preserving a consultant-to-support staff operating leverage ratio of 1.77:1 (FY25: 1.76:1). Approximately 75% of operating costs remain people-related, with variable performance commissions representing 10% to 15% of total remuneration, alongside employee attrition rates of 23% voluntary and 11% involuntary (34% combined).
HDIN Institutional Verdict
Hays PLC's underlying operational resilience masks structural governance and accounting contradictions that institutional investors must price into valuation multiples:
Management's capital allocation strategy reveals defensive concessions. The board abandoned its static £100 million cash buffer, slashed distributions to shareholders by 65% to £7.0 million, and spent £42.0 million in cash restructuring expenses to generate £45.0 million in annualized savings. While leadership points to an operating cash conversion rate of 189%, this performance is mechanically driven by the unwind of trade receivables during structural revenue contractions. In staffing models, cash generation surges as billings fall.
This dynamic created an incentive distortion inside the executive remuneration framework. Chief Executive Mark Dearnley (appointed 18 May 2026 following Dirk Hahn's resignation on 27 February 2026, which followed an interim executive chair structure under Michael Findlay from 10 November 2025 to 5 January 2026 that temporarily departed from UK Corporate Governance Code Provision 9) received an annual bonus out-turn of 65.2% of maximum (£204k bonus on £226k fixed pay; £430k total). Chief Financial Officer James Hilton received a 66.4% bonus out-turn (£482k bonus on £526k fixed pay; £136k PSP; £1,144k total), and former CEO Dirk Hahn received £1,159k total (£535k fixed, £425k bonus, £199k PSP).
Crucially, the Operating Cash Conversion KPI hit 189%, surpassing the 105% maximum threshold and delivering a 100% maximum payout under both the Annual Bonus and the 2023 PSP (which vested at 50% overall). This maximum cash payout counterbalanced the total failure of Long-Term Incentive metrics tied to cumulative EPS (6.55p achieved vs. 24.0p minimum target; 0% vesting) and relative Total Shareholder Return (-54.2% return vs. -23.9% minimum quartile; 0% vesting). Executives were rewarded for managing balance sheet shrinkage caused by contracting fees.
Looking to FY27, management guidance calls for c.£50.0 million in additional structural cost savings, technology capital expenditures of £30.0 to £35.0 million, net finance charges of c.£12.0 million (down from £13.5 million due to reduced RoU interest on surrendered leases), and an effective tax rate slightly below 45.0%. Currency exposures remain an operational sensitivity, where each 1-cent movement in the Euro/Sterling cross (€1.1506 FY26 average) shifts net fees by c.£3.9 million and operating profit by c.£0.6 million; each 1-cent move in the Australian Dollar (AUD 1.9805 FY26 average) impacts fees by c.£0.6 million and operating profit by c.£0.1 million. While the shift away from low-margin entry staffing toward £45k–£120k technical roles insulates the firm against immediate AI disintermediation, conversion margin targets of 25%+ remain dependent on a recovery in permanent hiring job churn, which collapsed 16% across major markets in FY26.
Presentation Download & Video Access:
Presentation Download: Click the PDF download link under 'Related Topics' to access the full institutional presentation of this report.
Video Link: Click this link to watch the HDIN analyst briefing on YouTube.
About HDIN Research:
HDIN Research is a global market intelligence and strategic advisory firm specializing in institutional-grade financial analysis, supply chain audits, and macroeconomic forecasting. Our dedicated sector analysts deliver actionable, data-driven insights tailored for private equity, hedge funds, and corporate strategy teams. Visit us at [http://www.hdinresearch.com](http://www.hdinresearch.com).
2026 AI Transparency Footer:
"This intelligence report was authored by HDIN Research analysts following a rigorous audit of official corporate filings. AI was utilized for massive-scale data synthesis and structural drafting, ensuring 100% inclusion of reported data points. All strategic insights, financial modeling, and final verdicts were verified by our editorial board to ensure professional accuracy and compliance with 2026 Google Search E-E-A-T standards."