ULVAC, Inc.: Advanced Deposition Realignment Across Pyeongtaek and Susono Facilities as Work-in-Process Absorption Constrains Operating Margins at 7.28%
Date : 2026-09-28
Reading : 409
HDIN Executive Takeaways
1. High-Bandwidth Memory (HBM) and IT OLED tool demand drove FY2026 order intake to ¥324,228 million (+43.7% YoY) and expanded backlogs to ¥176,062 million (+52.1% YoY), though delivery bottlenecks compressed operating margins by 328 bps to 7.28%.
2. Customer revenue remains concentrated in East Asia (65.30% of sales across China, Korea, and Taiwan, Province of China), prompting structural de-risking via the ¥2,833 million divestment of ULVAC Materials Suzhou.
3. Balance sheet safety is anchored by a ¥60,775 million net cash surplus and an undrawn ¥80,000 million credit line, yet low financial leverage (1.66x equity multiplier) caps return on equity at 7.4%, trailing management's 10.0% FY2028 Value Up Plan target.
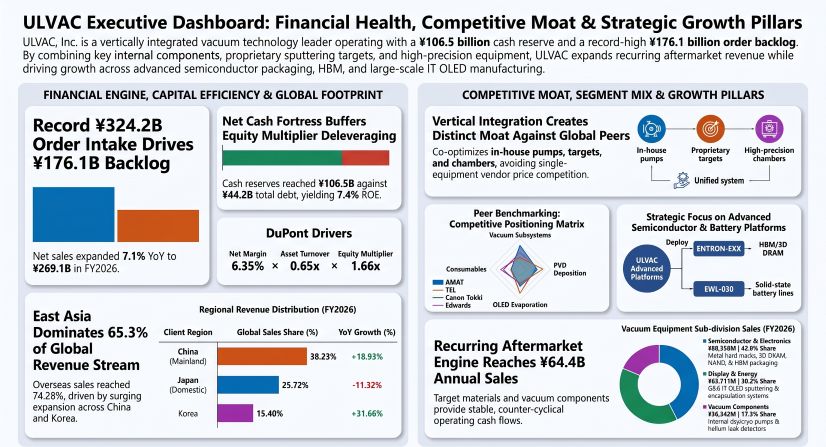
Figure ULVAC Executive Dashboard: Financial Health, Competitive Moat & Strategic Growth Pillars
 Segmental Realities, Delivery Bottlenecks, and Operating Margin Compression
ULVAC, Inc. [TYO: 6728] closed FY2026 with net sales expanding 7.14% YoY to ¥269,130 million, establishing a five-year compound annual growth rate (CAGR) of 2.77% from FY2022 levels (¥241,260 million). However, profitability deteriorated across key operational metrics. Consolidated gross profit settled at ¥77,725 million, yielding a gross margin of 28.88% (down 291 bps YoY from 31.79% in FY2025). Consolidated operating income contracted 26.11% YoY to ¥19,598 million, yielding an operating margin of 7.28% against 10.56% in FY2025. Ordinary income declined to ¥19,908 million (-30.40% YoY; five-year CAGR of -11.35% from ¥32,200 million in FY2022), while net profit attributable to owners of the parent adjusted to ¥17,092 million (+2.43% YoY; five-year CAGR of -4.10% from ¥20,211 million in FY2022).
Table ULVAC, INC.: FIVE-YEAR CONSOLIDATED OPERATIONAL SUMMARY (FY2022–FY2026)
Segment disaggregation highlights that earnings dilution originated within the primary equipment divisions, which absorbed temporary restructuring expenses associated with electric vehicle (EV) applications, shifting product mixes, and higher research allocations:
* Vacuum Equipment Business: Revenue rose to ¥210,759 million (78.31% of total sales) from ¥199,050 million in FY2025. Segment profit contracted 30.53% YoY to ¥15,197 million, reducing segment margin from 11.0% to 7.2%. Net orders received expanded 51.41% YoY to ¥262,644 million, generating a 1.25x Book-to-Bill ratio and lifting segment order backlog by 59.20% YoY to ¥156,594 million. Sub-divisional revenue broke down into Semiconductor & Electronics at ¥88,328 million (42.0% share; Book-to-Bill >1.0x); Display & Energy at ¥63,711 million (30.2% share; Book-to-Bill >1.0x); Components at ¥36,542 million (17.3% share; Book-to-Bill ~1.0x); and Industrial Equipment at ¥22,179 million (10.5% share; Book-to-Bill >1.0x).
* Vacuum Application Business : Revenue increased to ¥58,370 million (21.69% of total sales) from ¥52,134 million in FY2025. Segment profit contracted 5.51% YoY to ¥4,283 million, bringing segment margin to 7.3% (versus 8.7% in FY2025). Orders reached ¥61,584 million, creating a 1.05x Book-to-Bill ratio and leaving an ending backlog of ¥19,468 million. Materials (sputtering targets) generated ¥27,892 million (47.8% share; Book-to-Bill ~1.0x), while Others (surface analysis tools and mask blanks) produced ¥30,478 million (52.2% share; Book-to-Bill ~1.0x).
Table DIVISIONAL PERFORMANCE MATRIX (FY2026 VS. FY2025)
Total order intake surged 43.7% YoY to ¥324,228 million, creating a group Book-to-Bill ratio of 1.20x and pushing ending backlog up 52.1% YoY to ¥176,062 million. Total manufacturing production output reached ¥272,891 million (+7.6% YoY). However, order conversion encountered physical throughput limitations.
Under revenue recognition criteria, Point-in-Time recognition expanded 16.63% YoY to ¥140,062 million (52.04% of total sales), driven by fab utilization and consumable reorders, while Over-Time contract milestones fell to ¥129,068 million (47.96% of sales, versus 52.19% in FY2025). The installed-base cash buffer generated ¥64,434 million (23.94% of total net sales) through Vacuum Components (¥36,542 million) and Sputtering Target Materials (¥27,892 million). When combined with Field CS, Maintenance, and Surface Analysis (~¥75,628 million, or 28.10% of revenue), recurring lifecycle operations accounted for more than 35% of commercial operations.
Cost of Goods Sold (COGS) expanded to ¥191,404 million (from ¥171,322 million in FY2025). Total inventory was held flat at ¥71,072 million (versus ¥71,118 million in FY2025), but structural disaggregation indicates conversion bottlenecks:
* Finished Goods declined to ¥4,735 million (6.66% of total inventory, versus ¥5,186 million / 7.29% in FY2025).
* Work in Process expanded to ¥47,820 million, comprising 67.28% of total inventories (versus ¥45,650 million / 64.19% in FY2025), reflecting long tool assembly, vacuum chamber piping, and Factory Acceptance Testing (FAT) cycles.
* Raw Materials & Supplies contracted to ¥18,517 million (26.05% of inventory, versus ¥20,282 million / 28.52% in FY2025), representing a ¥1,765 million inventory drawdown.
* Inventory turnover days shortened by 16.0 days YoY from 151.5 days to 135.5 days due to internal module standardization.
Table REVENUE RECOGNITION TIMING & AFTERMARKET CASH ENGINE (FY2025–FY2026)
Under DuPont disaggregation, calculated Return on Equity (ROE) moderated to 6.86% (reported ROE settled at 7.4% in FY2026, down from 10.27% calculated in FY2022):
* Net Profit Margin settled at 6.35% (FY22: 8.38%; FY23: 6.23%; FY24: 7.75%; FY25: 6.64%).
* Asset Turnover remained constrained at 0.65x (FY22: 0.68x; FY23: 0.64x; FY24: 0.67x; FY25: 0.67x) by trade receivables and contract assets (¥89.5 billion) and inventory (¥71.1 billion) over total assets of ¥414.0 billion.
* The Equity Multiplier dropped from 1.80x in FY2022 to 1.66x in FY2026 (FY23: 1.72x; FY24: 1.71x; FY25: 1.62x), as retained earnings raised consolidated net assets to ¥249,216 million (from ¥196.7 billion in FY2022), moving the equity ratio from 53.4% to 58.2%.
Table DUPONT CAPITAL EFFICIENCY BREAKDOWN (FY2022–FY2026)
Industrial Footprint, Asset Quality, and Regional Supply Chains
Commercial exposure is weighted toward East Asian semiconductor and flat-panel display fabs. Overseas customer revenue reached 74.28% (¥199,909 million) in FY2026. Mainland China, Korea, and Taiwan, Province of China accounted for 65.30% of global net sales and 87.90% of total overseas turnover.
Table GEOGRAPHIC REVENUE DISTRIBUTION (FY2025 VS. FY2026)
Notes to the consolidated financial statements under Segment Information confirm that no individual external customer accounted for 10% or more of net sales in either FY2025 or FY2026 (<¥26,913 million per client). Demand is driven by Tier-1 accounts, including Taiwan Semiconductor Manufacturing Company (TSMC), Samsung Electronics, SK Hynix, Kioxia/Western Digital, Micron Technology, Semiconductor Manufacturing International Corporation (SMIC), BOE Technology Group, and CSOT.
To manage lead times and geopolitical constraints across these accounts, ULVAC operates a distributed production and customer engineering network:
Table MANUFACTURING, R&D AND REGIONAL SUBSIDIARY ASSET INFRASTRUCTURE
Total Capital Expenditures (CAPEX) expanded 14.48% YoY to ¥17,990 million (versus ¥15,715 million in FY2025). Vacuum Equipment received ¥14,138 million (78.59%), directed into cleanroom upgrades and semiconductor evaluation rigs at Fuji Susono, Chigasaki, and Pyeongtaek. Vacuum Application absorbed ¥3,852 million (+52.68% YoY; 21.41% share) for target bonding lines and mask blank expansions. With Depreciation & Amortization flat at ¥10,807 million (FY2025: ¥10,805 million), the CAPEX-to-depreciation ratio reached 1.66x (FY2025: 1.45x). Under EDINET reporting for Section 3, disclosures for single mega-scale greenfield construction and disposals were listed as "Not Applicable", confirming that capital was directed into modular cleanroom fit-outs. On a cash basis, property, plant, equipment, and intangible acquisitions totaled ¥13,297 million (FY2025: ¥11,348 million).
Fixed asset impairment charges normalized to ¥339 million in FY2026 (-88.25% YoY), following the purge in FY2025 of ¥2,886 million in legacy display machinery and vehicles (machinery and equipment: ¥2,802 million; others: ¥85 million) written down to zero value-in-use. Net tangible fixed assets closed FY2026 at ¥80,379 million.
R&D expenditure reached ¥14,611 million (+4.43% YoY), representing 5.43% of net sales (FY2025: ¥13,991 million / 5.57%). Spending was booked across General & Administrative expenses (¥13,107 million) and manufacturing costs (¥1,504 million). Vacuum Equipment accounted for 93.00% (¥13,587 million), focusing on the ENTRON-EXX sputtering system (single and tandem configurations for 3D DRAM, 323+ layer 3D NAND, and HBM packaging), GaN metasurface circular polarized emitters with Osaka University, and advanced packaging joint research with Tokyo Institute of Technology presented at the IEEE 76th ECTC (selected at a ~27% acceptance rate). In energy hardware, the EWL-030 300mm-wide roll-to-roll lithium metal vacuum evaporation system was delivered under the NEDO Green Innovation program. Vacuum Application absorbed ¥1,024 million (7.00%) for tantalum (Ta), niobium (Nb), tungsten (W), and molybdenum (Mo) targets, as well as EUV/FPD mask blanks. ULVAC also joined the imec industrial affiliation program to access sub-2nm deposition development.
Corporate portfolio restructuring executed during the fiscal year included:
* Divestment of Chinese Target Assets: On May 16, 2026, ULVAC contracted to sell its 100% equity stake in ULVAC Materials Suzhou to Beijing Fengjingzhengbang; completion on June 25, 2026, generated an extraordinary gain on sale of subsidiary investment of ¥2,833 million.
* Korean Joint Venture Realignment: Subsidiary Pure Surface Technology, Ltd. (PST) spun off operations in August 2026 to establish UFOMAT Korea, Ltd., consolidating display sputtering target manufacturing.
* Human Capital Rationalization: Headcount contracted to 5,613 across the consolidated group (-519 YoY) and 1,483 at the parent company (-165 YoY). In February 2026, a voluntary retirement program resulted in 165 parent staff exiting on June 30, 2026. Consolidated personnel distribution stands at 4,132 in Vacuum Equipment (73.6%), 838 in Vacuum Application (14.9%), and 643 in Corporate Shared Services (11.5%). Parent metrics average 44.8 years of age, 17.8 years of service, and an annual salary of ¥8,685,031 (-2.2% YoY). Group female management representation reached 10.8% (exceeding the 10.0% target; parent company stood at 6.8%, and ULVAC CRYOGENICS at 16.7%). Male childcare leave uptake reached 51.5% at the parent company and 100.0% at ULVAC TECHNO, ULVAC SALES, ULVAC PHI, and ULVAC KIKAI.
* Policy Equity Unwinding: Strategic cross-holdings total ¥1,486 million (0.60% of consolidated net assets; 1.00% non-consolidated), comprising 8 stocks and zero commercial customer or supplier exposure. Pure investments stand at ¥0. Listed shares total ¥1,460 million across 3 primary lenders: Sumitomo Mitsui Financial Group (136,179 shares; ¥864 million book value), Mizuho Financial Group (69,008 shares; ¥534 million), and Sumitomo Mitsui Trust Holdings (10,200 shares; ¥62 million). Unlisted regional shares account for ¥26 million across 5 entities.
HDIN Institutional Verdict
ULVAC’s operational performance presents an asset-allocation tension for institutional portfolios. The operational model exhibits high engineering self-sufficiency, supplying proprietary internal subsystems including cryogenic vacuum pumps (ULVAC CRYOGENICS INC.), dry pumps, helium leak detectors, and RF power units, bypassing third-party supplier markups common at pure assemblers.
Table CONSOLIDATED CASH FLOW DYNAMICS & LIQUIDITY RESERVES (FY2022–FY2026)
Table Balance Sheet Solvency and Leverage Profile (FY2025–FY2026)
Cash flow generation remains fully self-funding. CFO settled at ¥30,732 million (following ¥34,811 million in FY2025 and an inventory-driven low of ¥1,011 million in FY2023), funding FY2026 cash capex of ¥13,297 million, yielding +¥18,822 million in Free Cash Flow (FCF) and supporting ¥7,501 million in total dividend distributions (FY2025: ¥8,094 million). Net debt is negative at -¥60,775 million, supported by ¥106,527 million in cash and cash equivalents against ¥44,231 million in interest-bearing debt (short-term: ¥9,698 million; long-term: ¥34,533 million), moving the Net Debt/EBITDA ratio to -2.00x (EBITDA at ~¥30,405 million). Off-balance sheet strength is reinforced by an undrawn, ¥80,000 million syndicated revolving credit line across 9 banks, while financial loan guarantees stand at an immaterial ¥160 million (ULVAC CRYOGENICS INC. ¥159 million, ULVAC MALAYSIA ¥1 million; down from ¥245 million in FY2025, which included ¥77 million for ULVAC GmbH now discharged), representing 0.06% of net assets. Asset Retirement Obligations (ARO) remain under statutory disclosure levels (<1% of liabilities/net assets). Zero material patent infringement litigations are pending.
Table FIVE-YEAR SHAREHOLDER DISTRIBUTION & CAPITAL ALLOCATION PROFILE
Corporate governance adheres to Tokyo Stock Exchange Prime standards:
* Board of Directors: 7 members, including 4 Independent Outside Directors (57.1% majority) and 1 female director (Yoshimi Nakajima, 9.09% of board).
* Nomination & Remuneration Committee: 7 members (6 outside directors, 1 internal president), chaired by Yoshimi Nakajima.
* Audit & Supervisory Board: 4 members (2 internal, 2 outside independent).
* Executive Remuneration (3 Executive Directors): ¥221 million total, composed of ¥140 million fixed base salary (63.3%), ¥46 million performance bonus (20.8%, evaluated on single-year non-consolidated operating margin of 2.4% and consolidated operating income), and ¥36 million Board Benefit Trust stock compensation (16.3%, tied to Value Up Plan operating income and ROE). Outside directors receive ¥101 million in fixed cash across 6 officers. Individual remuneration for President Setsuo Iwashita totaled ¥104 million.
Holding over ¥106.5 billion in cash provides downside protection during semiconductor equipment downcycles, but this capital preservation weighs on asset efficiency. Management’s Value Up Plan targets ¥360 billion in sales, a 22.0% operating margin, and a 16.0% ROE by FY2031 (with an interim ROE milestone of 10.0% in FY2028). However, the current ROE of 7.4% and an equity ratio of 58.2% indicate that excessive capital retention is dampening equity returns. Reaching double-digit ROE will require shifting surplus cash from risk reserves into higher capital returns—surpassing the 35% minimum payout floor (43.8% in FY2026; DPS of ¥152 on EPS of ¥347.41) with structured share buybacks beyond the ¥487 million BBT allocation—and accelerating the conversion of the ¥47,820 million Work in Process backlog into recognized revenue.
Presentation Download & Video Access
- Presentation Download: Click the PDF download link under 'Related Topics' to access the full institutional presentation of this report.
- Video Link: Click this link to watch the HDIN analyst briefing on YouTube.
About HDIN Research
HDIN Research is a premier global market intelligence and strategic advisory firm specializing in institutional-grade financial analysis, supply chain audits, and macroeconomic forecasting. Our dedicated sector analysts deliver actionable, data-driven insights tailored for private equity, hedge funds, and corporate strategy teams. Visit us at http://www.hdinresearch.com.
2026 AI Transparency Footer
This intelligence report was authored by HDIN Research analysts following a rigorous audit of official corporate filings. AI was utilized for massive-scale data synthesis and structural drafting, ensuring 100% inclusion of reported data points. All strategic insights, financial modeling, and final verdicts were verified by our editorial board to ensure professional accuracy and compliance with 2026 Google Search E-E-A-T standards.
1. High-Bandwidth Memory (HBM) and IT OLED tool demand drove FY2026 order intake to ¥324,228 million (+43.7% YoY) and expanded backlogs to ¥176,062 million (+52.1% YoY), though delivery bottlenecks compressed operating margins by 328 bps to 7.28%.
2. Customer revenue remains concentrated in East Asia (65.30% of sales across China, Korea, and Taiwan, Province of China), prompting structural de-risking via the ¥2,833 million divestment of ULVAC Materials Suzhou.
3. Balance sheet safety is anchored by a ¥60,775 million net cash surplus and an undrawn ¥80,000 million credit line, yet low financial leverage (1.66x equity multiplier) caps return on equity at 7.4%, trailing management's 10.0% FY2028 Value Up Plan target.
Figure ULVAC Executive Dashboard: Financial Health, Competitive Moat & Strategic Growth Pillars
Segmental Realities, Delivery Bottlenecks, and Operating Margin CompressionULVAC, Inc. [TYO: 6728] closed FY2026 with net sales expanding 7.14% YoY to ¥269,130 million, establishing a five-year compound annual growth rate (CAGR) of 2.77% from FY2022 levels (¥241,260 million). However, profitability deteriorated across key operational metrics. Consolidated gross profit settled at ¥77,725 million, yielding a gross margin of 28.88% (down 291 bps YoY from 31.79% in FY2025). Consolidated operating income contracted 26.11% YoY to ¥19,598 million, yielding an operating margin of 7.28% against 10.56% in FY2025. Ordinary income declined to ¥19,908 million (-30.40% YoY; five-year CAGR of -11.35% from ¥32,200 million in FY2022), while net profit attributable to owners of the parent adjusted to ¥17,092 million (+2.43% YoY; five-year CAGR of -4.10% from ¥20,211 million in FY2022).
Table ULVAC, INC.: FIVE-YEAR CONSOLIDATED OPERATIONAL SUMMARY (FY2022–FY2026)
| Metric (¥ Million, Unless Noted) | FY2022 | FY2023 | FY2024 | FY2025 | FY2026 | CAGR / Variance |
|---|---|---|---|---|---|---|
| Net Sales | 241,260 | 227,528 | 261,115 | 251,184 | 269,130 | +2.77% CAGR |
| Operating Income | N/A | N/A | N/A | 26,523 | 19,598 | -26.11% YoY |
| Ordinary Income | 32,200 | 22,880 | 29,785 | 28,605 | 19,908 | -11.35% CAGR |
| Net Profit Attributable to Parent | 20,211 | 14,169 | 20,233 | 16,687 | 17,092 | -4.10% CAGR |
| Gross Margin (%) | N/A | N/A | N/A | 31.79% | 28.88% | -291 bps |
| Operating Margin (%) | N/A | N/A | N/A | 10.56% | 7.28% | -328 bps |
| Net Profit Margin (%) | 8.38% | 6.23% | 7.75% | 6.64% | 6.35% | -203 bps |
| Inventory Turnover Days | N/A | N/A | N/A | 151.5 days | 135.5 days | -16.0 days |
Segment disaggregation highlights that earnings dilution originated within the primary equipment divisions, which absorbed temporary restructuring expenses associated with electric vehicle (EV) applications, shifting product mixes, and higher research allocations:
* Vacuum Equipment Business: Revenue rose to ¥210,759 million (78.31% of total sales) from ¥199,050 million in FY2025. Segment profit contracted 30.53% YoY to ¥15,197 million, reducing segment margin from 11.0% to 7.2%. Net orders received expanded 51.41% YoY to ¥262,644 million, generating a 1.25x Book-to-Bill ratio and lifting segment order backlog by 59.20% YoY to ¥156,594 million. Sub-divisional revenue broke down into Semiconductor & Electronics at ¥88,328 million (42.0% share; Book-to-Bill >1.0x); Display & Energy at ¥63,711 million (30.2% share; Book-to-Bill >1.0x); Components at ¥36,542 million (17.3% share; Book-to-Bill ~1.0x); and Industrial Equipment at ¥22,179 million (10.5% share; Book-to-Bill >1.0x).
* Vacuum Application Business : Revenue increased to ¥58,370 million (21.69% of total sales) from ¥52,134 million in FY2025. Segment profit contracted 5.51% YoY to ¥4,283 million, bringing segment margin to 7.3% (versus 8.7% in FY2025). Orders reached ¥61,584 million, creating a 1.05x Book-to-Bill ratio and leaving an ending backlog of ¥19,468 million. Materials (sputtering targets) generated ¥27,892 million (47.8% share; Book-to-Bill ~1.0x), while Others (surface analysis tools and mask blanks) produced ¥30,478 million (52.2% share; Book-to-Bill ~1.0x).
Table DIVISIONAL PERFORMANCE MATRIX (FY2026 VS. FY2025)
| Segment / Sub-Division | Sales (¥ Million) | Profit (¥ Million) | Operating Margin (%) | Orders (¥ Million) | Backlog (¥ Million) |
|---|---|---|---|---|---|
| Vacuum Equipment Business | 210,759 | 15,197 | 7.2% | 262,644 | 156,594 |
| └ Semiconductor & Electronics | 88,328 | — | — | Strong YoY growth | — |
| └ Display & Energy | 63,711 | — | — | Strong YoY growth | — |
| └ Components | 36,542 | — | — | Steady performance | — |
| └ Industrial Equipment | 22,179 | — | — | Strong YoY growth | — |
| Vacuum Application Business | 58,370 | 4,283 | 7.3% | 61,584 | 19,468 |
| └ Materials (Sputtering Targets) | 27,892 | — | — | Strong YoY growth | — |
| └ Others (Blanks, Analysis Tools) | 30,478 | — | — | Strong YoY growth | — |
| Consolidated Total | 269,130 | 19,598 | 7.28% | 324,228 | 176,062 |
Total order intake surged 43.7% YoY to ¥324,228 million, creating a group Book-to-Bill ratio of 1.20x and pushing ending backlog up 52.1% YoY to ¥176,062 million. Total manufacturing production output reached ¥272,891 million (+7.6% YoY). However, order conversion encountered physical throughput limitations.
Under revenue recognition criteria, Point-in-Time recognition expanded 16.63% YoY to ¥140,062 million (52.04% of total sales), driven by fab utilization and consumable reorders, while Over-Time contract milestones fell to ¥129,068 million (47.96% of sales, versus 52.19% in FY2025). The installed-base cash buffer generated ¥64,434 million (23.94% of total net sales) through Vacuum Components (¥36,542 million) and Sputtering Target Materials (¥27,892 million). When combined with Field CS, Maintenance, and Surface Analysis (~¥75,628 million, or 28.10% of revenue), recurring lifecycle operations accounted for more than 35% of commercial operations.
Cost of Goods Sold (COGS) expanded to ¥191,404 million (from ¥171,322 million in FY2025). Total inventory was held flat at ¥71,072 million (versus ¥71,118 million in FY2025), but structural disaggregation indicates conversion bottlenecks:
* Finished Goods declined to ¥4,735 million (6.66% of total inventory, versus ¥5,186 million / 7.29% in FY2025).
* Work in Process expanded to ¥47,820 million, comprising 67.28% of total inventories (versus ¥45,650 million / 64.19% in FY2025), reflecting long tool assembly, vacuum chamber piping, and Factory Acceptance Testing (FAT) cycles.
* Raw Materials & Supplies contracted to ¥18,517 million (26.05% of inventory, versus ¥20,282 million / 28.52% in FY2025), representing a ¥1,765 million inventory drawdown.
* Inventory turnover days shortened by 16.0 days YoY from 151.5 days to 135.5 days due to internal module standardization.
Table REVENUE RECOGNITION TIMING & AFTERMARKET CASH ENGINE (FY2025–FY2026)
| Revenue Stream / Category | FY2025 Revenue (¥ Million) | FY2025 Share | FY2026 Revenue (¥ Million) | FY2026 Share | YoY Change |
|---|---|---|---|---|---|
| Over-Time Recognition (Progress-Based) | 131,091 | 52.19% | 129,068 | 47.96% | -1.54% |
| Point-in-Time Recognition | 120,093 | 47.81% | 140,062 | 52.04% | +16.63% |
| └ Vacuum Components Division | 35,400 | 14.09% | 36,542 | 13.58% | +3.23% |
| └ Sputtering Target Materials | 25,100 | 9.99% | 27,892 | 10.36% | +11.12% |
| └ Field CS, Refurbishment & PHI Services | ~59,593 | 23.72% | ~75,628 | 28.10% | +26.91% |
| Total Consolidated Net Sales | 251,184 | 100.00% | 269,130 | 100.00% | +7.14% |
Under DuPont disaggregation, calculated Return on Equity (ROE) moderated to 6.86% (reported ROE settled at 7.4% in FY2026, down from 10.27% calculated in FY2022):
* Net Profit Margin settled at 6.35% (FY22: 8.38%; FY23: 6.23%; FY24: 7.75%; FY25: 6.64%).
* Asset Turnover remained constrained at 0.65x (FY22: 0.68x; FY23: 0.64x; FY24: 0.67x; FY25: 0.67x) by trade receivables and contract assets (¥89.5 billion) and inventory (¥71.1 billion) over total assets of ¥414.0 billion.
* The Equity Multiplier dropped from 1.80x in FY2022 to 1.66x in FY2026 (FY23: 1.72x; FY24: 1.71x; FY25: 1.62x), as retained earnings raised consolidated net assets to ¥249,216 million (from ¥196.7 billion in FY2022), moving the equity ratio from 53.4% to 58.2%.
Table DUPONT CAPITAL EFFICIENCY BREAKDOWN (FY2022–FY2026)
| Factor | FY2022 | FY2023 | FY2024 | FY2025 | FY2026 | 5-Year Variance |
|---|---|---|---|---|---|---|
| Net Profit Margin (%) | 8.38% | 6.23% | 7.75% | 6.64% | 6.35% | -203 bps |
| Asset Turnover (x) | 0.68x | 0.64x | 0.67x | 0.67x | 0.65x | -0.03x |
| Equity Multiplier (x) | 1.80x | 1.72x | 1.71x | 1.62x | 1.66x | -0.14x |
| Calculated ROE (%) | 10.27% | 6.91% | 8.88% | 7.22% | 6.86% | -341 bps |
| Reported ROE (%) | N/A | N/A | N/A | N/A | 7.40% | — |
| Equity Ratio (%) | 53.4% | N/A | N/A | N/A | 58.2% | +480 bps |
Industrial Footprint, Asset Quality, and Regional Supply Chains
Commercial exposure is weighted toward East Asian semiconductor and flat-panel display fabs. Overseas customer revenue reached 74.28% (¥199,909 million) in FY2026. Mainland China, Korea, and Taiwan, Province of China accounted for 65.30% of global net sales and 87.90% of total overseas turnover.
Table GEOGRAPHIC REVENUE DISTRIBUTION (FY2025 VS. FY2026)
| Region / Customer Location | FY2025 Revenue (¥ Million) | FY2025 Share | FY2026 Revenue (¥ Million) | FY2026 Share | YoY Change |
|---|---|---|---|---|---|
| Mainland China | 86,518 | 34.44% | 102,894 | 38.23% | +18.93% |
| Japan (Domestic) | 78,054 | 31.07% | 69,221 | 25.72% | -11.32% |
| Korea | 31,472 | 12.53% | 41,437 | 15.40% | +31.66% |
| Taiwan, Province of China | 28,109 | 11.19% | 31,420 | 11.67% | +11.78% |
| Others (North America, Europe & Southeast Asia) | 27,030 | 10.76% | 24,157 | 8.98% | -10.63% |
| Consolidated Total | 251,184 | 100.00% | 269,130 | 100.00% | +7.14% |
Notes to the consolidated financial statements under Segment Information confirm that no individual external customer accounted for 10% or more of net sales in either FY2025 or FY2026 (<¥26,913 million per client). Demand is driven by Tier-1 accounts, including Taiwan Semiconductor Manufacturing Company (TSMC), Samsung Electronics, SK Hynix, Kioxia/Western Digital, Micron Technology, Semiconductor Manufacturing International Corporation (SMIC), BOE Technology Group, and CSOT.
To manage lead times and geopolitical constraints across these accounts, ULVAC operates a distributed production and customer engineering network:
Table MANUFACTURING, R&D AND REGIONAL SUBSIDIARY ASSET INFRASTRUCTURE
| Operating Entity & Location | PP&E Book Value (¥ Million) | Facility Area (m²) | Headcount |
|---|---|---|---|
| Chigasaki Headquarters & Plant (Kanagawa, Japan) | 14,061 | 53,000 | 871 |
| Fuji Susono Plant (Shizuoka, Japan) | 14,584 | 106,000 | 195 |
| Chiba Tomisato Plant (Chiba, Japan) | 2,284 | 25,000 | 19 |
| Tohoku Plant (Aomori, Japan) | 2,528 | 121,000 | 143 |
| Kyushu Plant (Kagoshima, Japan) | 3,612 | 142,000 | 210 |
| ULVAC KOREA, Ltd. (Pyeongtaek, Korea) | 6,402 | N/A | 497 |
| ULVAC TAIWAN INC. (Tainan, Taiwan) | 3,396 | N/A | 309 |
| ULVAC Oriental Testing (Chengdu, China) | 2,638 | N/A | 270 |
| ULVAC Vacuum Tech (Shenyang, China) | 1,344 | N/A | 197 |
| ULVAC Vacuum Tech (Suzhou, China) | 1,256 | N/A | 172 |
| ULVAC Commercial (Shanghai, China) | 510 | N/A | 357 |
| ULCOAT TAIWAN, Inc. (Tainan, Taiwan) | 2,004 | N/A | 110 |
| Physical Electronics USA (Minnesota, USA) | 672 | N/A | 101 |
Total Capital Expenditures (CAPEX) expanded 14.48% YoY to ¥17,990 million (versus ¥15,715 million in FY2025). Vacuum Equipment received ¥14,138 million (78.59%), directed into cleanroom upgrades and semiconductor evaluation rigs at Fuji Susono, Chigasaki, and Pyeongtaek. Vacuum Application absorbed ¥3,852 million (+52.68% YoY; 21.41% share) for target bonding lines and mask blank expansions. With Depreciation & Amortization flat at ¥10,807 million (FY2025: ¥10,805 million), the CAPEX-to-depreciation ratio reached 1.66x (FY2025: 1.45x). Under EDINET reporting for Section 3, disclosures for single mega-scale greenfield construction and disposals were listed as "Not Applicable", confirming that capital was directed into modular cleanroom fit-outs. On a cash basis, property, plant, equipment, and intangible acquisitions totaled ¥13,297 million (FY2025: ¥11,348 million).
Fixed asset impairment charges normalized to ¥339 million in FY2026 (-88.25% YoY), following the purge in FY2025 of ¥2,886 million in legacy display machinery and vehicles (machinery and equipment: ¥2,802 million; others: ¥85 million) written down to zero value-in-use. Net tangible fixed assets closed FY2026 at ¥80,379 million.
R&D expenditure reached ¥14,611 million (+4.43% YoY), representing 5.43% of net sales (FY2025: ¥13,991 million / 5.57%). Spending was booked across General & Administrative expenses (¥13,107 million) and manufacturing costs (¥1,504 million). Vacuum Equipment accounted for 93.00% (¥13,587 million), focusing on the ENTRON-EXX sputtering system (single and tandem configurations for 3D DRAM, 323+ layer 3D NAND, and HBM packaging), GaN metasurface circular polarized emitters with Osaka University, and advanced packaging joint research with Tokyo Institute of Technology presented at the IEEE 76th ECTC (selected at a ~27% acceptance rate). In energy hardware, the EWL-030 300mm-wide roll-to-roll lithium metal vacuum evaporation system was delivered under the NEDO Green Innovation program. Vacuum Application absorbed ¥1,024 million (7.00%) for tantalum (Ta), niobium (Nb), tungsten (W), and molybdenum (Mo) targets, as well as EUV/FPD mask blanks. ULVAC also joined the imec industrial affiliation program to access sub-2nm deposition development.
Corporate portfolio restructuring executed during the fiscal year included:
* Divestment of Chinese Target Assets: On May 16, 2026, ULVAC contracted to sell its 100% equity stake in ULVAC Materials Suzhou to Beijing Fengjingzhengbang; completion on June 25, 2026, generated an extraordinary gain on sale of subsidiary investment of ¥2,833 million.
* Korean Joint Venture Realignment: Subsidiary Pure Surface Technology, Ltd. (PST) spun off operations in August 2026 to establish UFOMAT Korea, Ltd., consolidating display sputtering target manufacturing.
* Human Capital Rationalization: Headcount contracted to 5,613 across the consolidated group (-519 YoY) and 1,483 at the parent company (-165 YoY). In February 2026, a voluntary retirement program resulted in 165 parent staff exiting on June 30, 2026. Consolidated personnel distribution stands at 4,132 in Vacuum Equipment (73.6%), 838 in Vacuum Application (14.9%), and 643 in Corporate Shared Services (11.5%). Parent metrics average 44.8 years of age, 17.8 years of service, and an annual salary of ¥8,685,031 (-2.2% YoY). Group female management representation reached 10.8% (exceeding the 10.0% target; parent company stood at 6.8%, and ULVAC CRYOGENICS at 16.7%). Male childcare leave uptake reached 51.5% at the parent company and 100.0% at ULVAC TECHNO, ULVAC SALES, ULVAC PHI, and ULVAC KIKAI.
* Policy Equity Unwinding: Strategic cross-holdings total ¥1,486 million (0.60% of consolidated net assets; 1.00% non-consolidated), comprising 8 stocks and zero commercial customer or supplier exposure. Pure investments stand at ¥0. Listed shares total ¥1,460 million across 3 primary lenders: Sumitomo Mitsui Financial Group (136,179 shares; ¥864 million book value), Mizuho Financial Group (69,008 shares; ¥534 million), and Sumitomo Mitsui Trust Holdings (10,200 shares; ¥62 million). Unlisted regional shares account for ¥26 million across 5 entities.
HDIN Institutional Verdict
ULVAC’s operational performance presents an asset-allocation tension for institutional portfolios. The operational model exhibits high engineering self-sufficiency, supplying proprietary internal subsystems including cryogenic vacuum pumps (ULVAC CRYOGENICS INC.), dry pumps, helium leak detectors, and RF power units, bypassing third-party supplier markups common at pure assemblers.
Table CONSOLIDATED CASH FLOW DYNAMICS & LIQUIDITY RESERVES (FY2022–FY2026)
| Cash Flow Component (¥ Million) | FY2022 | FY2023 | FY2024 | FY2025 | FY2026 | 5-Year Net |
|---|---|---|---|---|---|---|
| Operating Cash Flow (CFO) | 33,931 | 1,011 | 17,162 | 34,811 | 30,732 | 117,647 |
| Investing Cash Flow (CFI) | (7,432) | (15,673) | (19,524) | (10,800) | (11,910) | (65,339) |
| Free Cash Flow (FCF = CFO + CFI) | +26,499 | (14,662) | (2,362) | +24,011 | +18,822 | +52,308 |
| Financing Cash Flow (CFF) | (6,445) | (5,438) | (2,784) | (14,215) | (8,319) | (37,201) |
| Ending Cash & Cash Equivalents | 107,106 | 87,317 | 84,541 | 92,609 | 106,527 | — |
Table Balance Sheet Solvency and Leverage Profile (FY2025–FY2026)
| Metric Indicator | FY2025 | FY2026 |
|---|---|---|
| Cash & Deposits (Balance Sheet Cash) | ¥98,951M | ¥105,006M |
| Short-Term Borrowings (Including Current Portion of Long-Term Debt) | ¥9,774M | ¥9,698M |
| Long-Term Borrowings (Excluding Current Portion) | ¥32,354M | ¥34,533M |
| Total Interest-Bearing Debt | ¥42,128M | ¥44,231M |
| Net Debt Position (Debt Minus Liquid Cash) | (¥56,823M) | (¥60,775M) |
| EBITDA (Operating Income + Depreciation) | ~¥37,328M | ~¥30,405M |
| Net Debt / EBITDA Ratio | (1.52x) | (2.00x) |
| Current Ratio (%) | 268.32% | 246.02% |
| Quick Ratio (%) | 189.45% | 168.18% |
Cash flow generation remains fully self-funding. CFO settled at ¥30,732 million (following ¥34,811 million in FY2025 and an inventory-driven low of ¥1,011 million in FY2023), funding FY2026 cash capex of ¥13,297 million, yielding +¥18,822 million in Free Cash Flow (FCF) and supporting ¥7,501 million in total dividend distributions (FY2025: ¥8,094 million). Net debt is negative at -¥60,775 million, supported by ¥106,527 million in cash and cash equivalents against ¥44,231 million in interest-bearing debt (short-term: ¥9,698 million; long-term: ¥34,533 million), moving the Net Debt/EBITDA ratio to -2.00x (EBITDA at ~¥30,405 million). Off-balance sheet strength is reinforced by an undrawn, ¥80,000 million syndicated revolving credit line across 9 banks, while financial loan guarantees stand at an immaterial ¥160 million (ULVAC CRYOGENICS INC. ¥159 million, ULVAC MALAYSIA ¥1 million; down from ¥245 million in FY2025, which included ¥77 million for ULVAC GmbH now discharged), representing 0.06% of net assets. Asset Retirement Obligations (ARO) remain under statutory disclosure levels (<1% of liabilities/net assets). Zero material patent infringement litigations are pending.
Table FIVE-YEAR SHAREHOLDER DISTRIBUTION & CAPITAL ALLOCATION PROFILE
| Metric | FY2022 | FY2023 | FY2024 | FY2025 | FY2026 | Trend |
|---|---|---|---|---|---|---|
| Dividend Per Share (DPS: ¥) | ¥124.00 | ¥109.00 | ¥144.00 | ¥164.00 | ¥152.00 | Variable |
| Total Dividends Paid (¥ Million) | 6,120 | 5,380 | 7,107 | 8,094 | 7,501 | Re-alignment |
| Consolidated Payout Ratio (%) | 30.2% | 37.9% | 35.1% | 48.4% | 43.8% | Maintained above 35% base level |
| Share Buybacks (¥ Million) | Minimal | Minimal | Minimal | 309 | 487 | BBT Trust-related purchases |
| Consolidated EPS (¥) | ¥410.37 | ¥287.70 | ¥410.67 | ¥338.74 | ¥347.41 | Cyclical trend |
Corporate governance adheres to Tokyo Stock Exchange Prime standards:
* Board of Directors: 7 members, including 4 Independent Outside Directors (57.1% majority) and 1 female director (Yoshimi Nakajima, 9.09% of board).
* Nomination & Remuneration Committee: 7 members (6 outside directors, 1 internal president), chaired by Yoshimi Nakajima.
* Audit & Supervisory Board: 4 members (2 internal, 2 outside independent).
* Executive Remuneration (3 Executive Directors): ¥221 million total, composed of ¥140 million fixed base salary (63.3%), ¥46 million performance bonus (20.8%, evaluated on single-year non-consolidated operating margin of 2.4% and consolidated operating income), and ¥36 million Board Benefit Trust stock compensation (16.3%, tied to Value Up Plan operating income and ROE). Outside directors receive ¥101 million in fixed cash across 6 officers. Individual remuneration for President Setsuo Iwashita totaled ¥104 million.
Holding over ¥106.5 billion in cash provides downside protection during semiconductor equipment downcycles, but this capital preservation weighs on asset efficiency. Management’s Value Up Plan targets ¥360 billion in sales, a 22.0% operating margin, and a 16.0% ROE by FY2031 (with an interim ROE milestone of 10.0% in FY2028). However, the current ROE of 7.4% and an equity ratio of 58.2% indicate that excessive capital retention is dampening equity returns. Reaching double-digit ROE will require shifting surplus cash from risk reserves into higher capital returns—surpassing the 35% minimum payout floor (43.8% in FY2026; DPS of ¥152 on EPS of ¥347.41) with structured share buybacks beyond the ¥487 million BBT allocation—and accelerating the conversion of the ¥47,820 million Work in Process backlog into recognized revenue.
Presentation Download & Video Access
- Presentation Download: Click the PDF download link under 'Related Topics' to access the full institutional presentation of this report.
- Video Link: Click this link to watch the HDIN analyst briefing on YouTube.
About HDIN Research
HDIN Research is a premier global market intelligence and strategic advisory firm specializing in institutional-grade financial analysis, supply chain audits, and macroeconomic forecasting. Our dedicated sector analysts deliver actionable, data-driven insights tailored for private equity, hedge funds, and corporate strategy teams. Visit us at http://www.hdinresearch.com.
2026 AI Transparency Footer
This intelligence report was authored by HDIN Research analysts following a rigorous audit of official corporate filings. AI was utilized for massive-scale data synthesis and structural drafting, ensuring 100% inclusion of reported data points. All strategic insights, financial modeling, and final verdicts were verified by our editorial board to ensure professional accuracy and compliance with 2026 Google Search E-E-A-T standards.