Dynamic Electronics Co., Ltd.: Capital Pivot to Thailand Plant and AI Interconnects Amid Automotive Margin Compression
Date : 2026-09-30
Reading : 128
HDIN Executive Takeaways
1. Dynamic Electronics Co., Ltd. pivoted toward High-Density Interconnect (HDI) boards, which reached 43.78% of revenue in 2026 H1, while blended ASP rose 35.70% to RMB 1,684 per sq.m. ($234.30 per sq.m.).
2. The offshore expansion at the Thailand Rayong base absorbed $468.40 million in non-current assets as of June 30, 2026, anchoring a "China + 1" structure where overseas and bonded markets accounted for 71.80% of revenue.
3. Heavy CapEx totaling $188.66 million in 2026 H1 dropped Free Cash Flow to -$179.50 million, elevating Net Gearing to 150.79% and requiring HKEX H-share listing proceeds to alleviate debt refinancing strain.
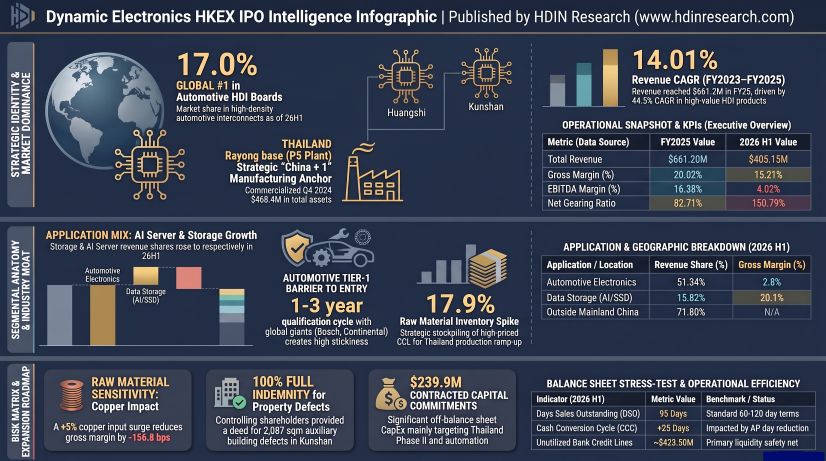
Figure Dynamic Electronics HKEX IPO Intelligence Infographic
 Segmental Realities and Margin Compression
Dynamic Electronics Co., Ltd. [SSE: 603175.SH] expanded its top-line revenue at a 14.01% CAGR from $508.70 million (RMB 3,656.25 million) in FY2023 to $661.20 million (RMB 4,752.34 million) in FY2025. In 2026 H1, revenue rose 33.29% YoY to $405.15 million (RMB 2,912.04 million). However, gross profit margin contracted from 23.54% in FY2023 to 20.02% in FY2025 and 15.21% in 2026 H1, a cumulative decline of 833 basis points. In 2026 H1, the company registered an operating loss of -$13.89 million (-RMB 99.85 million) and a consolidated net loss of -$26.60 million (-RMB 191.21 million), driven by a $23.73 million (RMB 170.53 million) unhedged non-cash foreign exchange loss caused by the accounting revaluation of USD-denominated net monetary liabilities.
Consolidated Financial Trajectory (2023 – 2026 H1)
* Consolidated Revenue: FY2023: $508,695.9K (RMB 3,656,252K); FY2024: $573,720.6K (RMB 4,123,617K); FY2025: $661,195.1K (RMB 4,752,340K); 2025 H1: $303,969.0K (RMB 2,184,777K); 2026 H1: $405,154.0K (RMB 2,912,044K).
* Cost of Sales: FY2023: $388,929.4K (RMB 2,795,430K); FY2024: $445,437.1K (RMB 3,201,579K); FY2025: $528,799.1K (RMB 3,800,781K); 2025 H1: $237,048.3K (RMB 1,703,785K); 2026 H1: $343,539.8K (RMB 2,469,192K).
* Gross Profit: FY2023: $119,766.5K (RMB 860,822K); FY2024: $128,283.6K (RMB 922,038K); FY2025: $132,390.8K (RMB 951,559K); 2025 H1: $66,920.6K (RMB 480,992K); 2026 H1: $61,614.2K (RMB 442,852K).
* Operating Profit (EBIT): FY2023: $56,982.7K (RMB 409,563K); FY2024: $60,112.7K (RMB 432,060K); FY2025: $54,463.4K (RMB 391,456K); 2025 H1: $32,770.9K (RMB 235,541K); 2026 H1: -$13,892.7K (-RMB 99,854K).
* EBITDA: FY2023: $94,762.2K (RMB 681,103K); FY2024: $100,198.7K (RMB 720,178K); FY2025: $108,322.9K (RMB 778,571K); 2025 H1: $58,159.9K (RMB 418,024K); 2026 H1: $16,289.0K (RMB 117,077K).
* Net Profit Attributable to Owners: FY2023: $37,030.3K (RMB 266,155K); FY2024: $38,430.2K (RMB 276,217K); FY2025: $32,187.8K (RMB 231,350K); 2025 H1: $22,093.8K (RMB 158,799K); 2026 H1: -$26,602.6K (-RMB 191,206K).
* Operating Cash Flow (CFO): FY2023: $113,877.4K (RMB 818,494K); FY2024: $84,285.2K (RMB 605,800K); FY2025: $57,423.2K (RMB 412,729K); 2025 H1: $29,096.9K (RMB 209,134K); 2026 H1: $9,162.4K (RMB 65,855K).
* Cash Capital Expenditure (CapEx): FY2023: $98,065.2K (RMB 704,844K); FY2024: $177,447.8K (RMB 1,275,406K); FY2025: $210,275.9K (RMB 1,511,358K); 2025 H1: $90,656.3K (RMB 651,592K); 2026 H1: $188,663.0K (RMB 1,356,015K).
* Free Cash Flow (FCF): FY2023: $15,812.2K (RMB 113,650K); FY2024: -$93,162.6K (-RMB 669,606K); FY2025: -$152,852.7K (-RMB 1,098,629K); 2025 H1: -$61,559.4K (-RMB 442,458K); 2026 H1: -$179,500.5K (-RMB 1,290,160K).
Product Category Revenue and Pricing Metrics
* Double-sided Boards: Revenue contribution was 7.25% in FY2023, 6.38% in FY2024, 4.79% in FY2025, 5.51% in 2025 H1, and 3.75% in 2026 H1. ASP moved from RMB 645/sq.m. ($89.7) in FY2023 to RMB 595/sq.m. ($82.8) in FY2024, RMB 562/sq.m. ($78.2) in FY2025, and RMB 614/sq.m. ($85.4) in 2026 H1. Gross margin dropped from 23.9% in FY2023 to 3.9% in 2026 H1.
* Multi-layer Boards (4 to 6 Layers): Revenue share declined from 42.67% in FY2023 to 33.64% in FY2024, 30.22% in FY2025, 33.37% in 2025 H1, and 24.69% in 2026 H1. ASP stood at RMB 938/sq.m. ($130.5) in FY2023, RMB 918/sq.m. ($127.7) in FY2024, RMB 895/sq.m. ($124.5) in FY2025, and RMB 970/sq.m. ($135.0) in 2026 H1. Gross margin dropped from 19.6% in FY2023 to 0.3% in 2026 H1.
* Multi-layer Boards (8 to 14 Layers): Revenue share was 23.38% in FY2023, 22.79% in FY2024, 20.62% in FY2025, 19.21% in 2025 H1, and 20.62% in 2026 H1. ASP rose from RMB 2,065/sq.m. ($287.3) in FY2023 to RMB 2,186/sq.m. ($304.1) in FY2024, RMB 2,183/sq.m. ($303.7) in FY2025, and RMB 2,523/sq.m. ($351.0) in 2026 H1.
* Multi-layer Boards (16 Layers & Above): Revenue share represented 0.00% in FY2023, 0.07% in FY2024, 0.25% in FY2025, 0.07% in 2025 H1, and 0.17% in 2026 H1. ASP registered at RMB 11,388/sq.m. ($1,584) in FY2023, RMB 14,161/sq.m. ($1,970) in FY2024, RMB 13,292/sq.m. ($1,849) in FY2025, and RMB 9,505/sq.m. ($1,322) in 2026 H1.
* HDI Boards: Revenue contribution expanded from 23.37% in FY2023 to 32.79% in FY2024, 37.52% in FY2025, 35.79% in 2025 H1, and 43.78% in 2026 H1. ASP grew from RMB 2,364/sq.m. ($328.9) in FY2023 to RMB 2,440/sq.m. ($339.5) in FY2024, RMB 2,512/sq.m. ($349.5) in FY2025, and RMB 2,833/sq.m. ($394.2) in 2026 H1. Gross margin shifted from 25.0% in FY2023 to 27.7% in FY2024, 23.1% in FY2025, and 13.8% in 2026 H1.
* Other Operations (Scrap Sales): Revenue contribution moved from 3.32% in FY2023 to 4.32% in FY2024, 6.59% in FY2025, 6.04% in 2025 H1, and 6.99% in 2026 H1 ($28.31 million / RMB 203.50 million in 2026 H1, carrying a 99.4% gross margin).
* Consolidated PCB ASP: Blended ASP climbed from RMB 1,241/sq.m. ($172.7) in FY2023 to RMB 1,343/sq.m. ($186.9) in FY2024, RMB 1,400/sq.m. ($194.8) in FY2025, and RMB 1,684/sq.m. ($234.3) in 2026 H1. Total sales volume tracked at 2,849K sq.m. in FY2023, 2,937K sq.m. in FY2024, 3,170K sq.m. in FY2025, and 1,608K sq.m. in 2026 H1.
Downstream Sector Revenue Share and Application Margin
* Automotive Electronics: Sales share moved from 68.87% (RMB 2,517.92M) in FY2023 to 65.65% (RMB 2,707.10M) in FY2024, 55.30% (RMB 2,628.14M) in FY2025, 59.57% (RMB 1,299.26M) in 2025 H1, and 51.34% (RMB 1,495.03M / $208.00M) in 2026 H1. Application gross margin compressed from 19.4% in FY2023 to 16.7% in FY2024, 12.2% in FY2025, and 2.8% in 2026 H1.
* Data Storage: Sales share expanded from 7.02% (RMB 256.72M) in FY2023 to 7.66% (RMB 316.04M) in FY2024, 11.53% (RMB 548.09M) in FY2025, 9.03% (RMB 197.32M) in 2025 H1, and 15.82% (RMB 460.75M / $64.10M) in 2026 H1 (+133.5% YoY). Application gross margin tracked at 22.3% in FY2023, 25.3% in FY2024, 21.1% in FY2025, and 20.1% in 2026 H1.
* Telecom & AI Servers: Sales share shifted from 4.27% (RMB 156.22M) in FY2023 to 6.88% (RMB 283.89M) in FY2024, 9.28% (RMB 440.90M) in FY2025, 8.11% (RMB 177.28M) in 2025 H1, and 10.00% (RMB 291.21M / $40.52M) in 2026 H1 (+64.3% YoY). Application gross margin stood at 25.9% in FY2023, 27.5% in FY2024, 19.6% in FY2025, and 17.0% in 2026 H1.
* Display: Sales share accounted for 11.78% (RMB 430.62M) in FY2023, 10.46% (RMB 431.20M) in FY2024, 10.93% (RMB 519.45M) in FY2025, 11.08% (RMB 242.08M) in 2025 H1, and 8.94% (RMB 260.29M) in 2026 H1. Application gross margin dropped from 26.3% in FY2023 to 17.9% in FY2024, 10.0% in FY2025, and 10.8% in 2026 H1.
* Consumer Electronics: Sales share accounted for 4.47% (RMB 163.29M) in FY2023, 4.55% (RMB 187.62M) in FY2024, 5.62% (RMB 266.93M) in FY2025, 5.73% (RMB 125.08M) in 2025 H1, and 5.91% (RMB 172.21M) in 2026 H1. Gross margin stood at 22.3% in FY2023, 26.0% in FY2024, 18.5% in FY2025, and 13.7% in 2026 H1.
* Other Applications: Sales share was 0.28% (RMB 10.19M) in FY2023, 0.47% (RMB 19.52M) in FY2024, 0.75% (RMB 35.53M) in FY2025, 0.54% (RMB 11.77M) in 2025 H1, and 1.00% (RMB 29.05M) in 2026 H1.
Raw material expenditures constituted 55.5% of COGS in FY2023, 53.8% in FY2024, 55.2% ($292.08 million / RMB 2,099.29 million) in FY2025, and 56.9% ($195.44 million / RMB 1,404.71 million) in 2026 H1. Spot copper prices advanced from $8.5K per ton in 2023 to $13.0K per ton in 2026 H1 (+31.3%). Customer pricing resets lag input inflation by 3 to 6 months, while automotive contracts enforce mandatory annual price reductions of 1% to 5%. A 1% increase in raw material procurement prices reduces gross margin by 48.2 basis points under the 2026 H1 cost structure.
Working Capital and Credit Structure
* Balance Sheet Liquidity: Cash and cash equivalents reached $152.13 million (RMB 1,093.41 million) as of June 30, 2026, supplemented by $1.15 million (RMB 8.24 million) in pledged deposits. Standalone unutilized bank credit facilities totaled $423.50 million.
* Leverage Profile: Total interest-bearing debt expanded to $683.04 million (RMB 4,909.35 million) as of June 30, 2026, comprising $218.71 million (RMB 1,572.01 million) in short-term bank borrowings and current portions of long-term debt, $462.79 million (RMB 3,326.29 million) in long-term borrowings, and $1.54 million (RMB 11.05 million) in lease liabilities. Net debt reached $529.77 million (RMB 3,807.70 million). The Net Gearing Ratio increased to 150.79%, while the Asset-Liability Ratio reached 75.61%. The Current Ratio stood at 1.01x, the Quick Ratio at 0.73x, and Interest Coverage dropped to -1.28x in 2026 H1.
* Working Capital Metrics: The Cash Conversion Cycle (CCC) lengthened to +25 days in 2026 H1 (+20 days in FY2023; -14 days in FY2024; +1 day in FY2025). Inventory turnover days tracked at 85 days in 2026 H1 (86 days in FY2025). Accounts receivable turnover days registered at 95 days in 2026 H1 (96 days in FY2025), with 100% of billed receivables under 1 year of age and a blended Expected Credit Loss (ECL) rate of 0.24%. Overdue accounts past 30 days are impaired at 100%. One-month post-period collection of 2026 H1 receivables reached 29.1% (RMB 488.9 million collected by July 31, 2026). Accounts payable turnover days fell to 155 days in 2026 H1 from 181 days in FY2025.
* Inventory Diagnostics: Inventory gross book value increased to RMB 1,252.01 million ($174.19 million) as of June 30, 2026, comprising raw materials of RMB 223.88 million ($31.15 million), work-in-progress (WIP) of RMB 373.58 million ($51.98 million), finished goods of RMB 255.77 million ($35.59 million), and Vendor-Managed Inventory (VMI) goods in transit of RMB 318.13 million ($44.26 million; 25.4% of total inventory). Inventory provisions reached RMB 79.24 million in FY2025 and RMB 80.65 million in 2026 H1, reflecting an inventory reserve ratio of 6.44%. The subsequent one-month inventory utilization rate stood at 46.5% as of July 31, 2026.
Operating Costs and Capitalized Depreciation
Operating expenses as a share of revenue totaled 12.73% in FY2023, 13.50% in FY2024, 12.09% in FY2025, and 11.32% in 2026 H1.
* Selling and marketing expense ratio stood at 3.61% in FY2023, 3.23% in FY2024, 2.24% ($14.78 million / RMB 106.24 million) in FY2025, and 2.46% ($9.96 million / RMB 71.57 million) in 2026 H1.
* Administrative expense ratio was 5.78% in FY2023, 7.00% ($40.18 million / RMB 288.78 million) in FY2024, 6.43% ($42.54 million / RMB 305.73 million) in FY2025, and 5.14% ($20.82 million / RMB 149.63 million) in 2026 H1.
* R&D expense ratio reached 3.34% ($16.98 million / RMB 122.07 million) in FY2023, 3.27% ($18.78 million / RMB 135.03 million) in FY2024, 3.42% ($22.61 million / RMB 162.53 million) in FY2025, and 3.72% ($15.06 million / RMB 108.23 million) in 2026 H1. Under IAS 38, R&D expenditures are 100% expensed with 0% capitalization. Personnel compensation accounted for 66.4% and material consumption accounted for 21.2% of 2026 H1 R&D expenses.
* PPE Depreciation: Fixed asset depreciation rose from $36.85 million (RMB 264.83 million) in FY2023 to $52.75 million (RMB 379.15 million) in FY2025. Machinery is depreciated across 5.15 to 11.1 years (annual depreciation rates of 9.00% to 19.40%). As of June 30, 2026, machinery gross book value reached RMB 3,616.42 million ($503.15 million), accumulated depreciation stood at RMB 1,664.91 million, resulting in a machinery replacement newness ratio of 53.96%. Construction in progress stood at RMB 1,541 million.
Infrastructure Layout and Regional Moats
Dynamic Electronics Co., Ltd. operates three manufacturing complexes with a combined production volume that expanded from 2,766,770 sq.m. in FY2023 to 3,009,560 sq.m. in FY2024, 3,256,889 sq.m. in FY2025, and 1,542,897 sq.m. in 2026 H1. Consolidated utilization rates were 90.7% in FY2023, 93.6% in FY2024, 86.3% in FY2025, and 94.8% in 2026 H1. The sales-to-production ratio was 102.97% in FY2023, 97.59% in FY2024, 97.33% in FY2025, and 104.22% in 2026 H1.
Operational Footprint by Manufacturing Base
* Huangshi Base (Hubei, Mainland China - P1 and P2 Plants): Primary site for automotive electronics, data storage, and telecommunication PCBs. Design capacity tracked at 2,501,148 sq.m. in FY2023, 2,677,595 sq.m. in FY2024, 2,747,904 sq.m. in FY2025, and 1,239,247 sq.m. in 2026 H1. Actual output was 2,336,779 sq.m. (93.4% utilization) in FY2023, 2,520,595 sq.m. (94.1% utilization) in FY2024, 2,481,589 sq.m. (90.3% utilization) in FY2025, and 1,204,464 sq.m. (97.2% utilization) in 2026 H1.
* Kunshan Base (Jiangsu, Mainland China): Dedicated to automotive, display, and consumer rigid PCBs. Design capacity was 547,901 sq.m. in FY2023, 511,987 sq.m. in FY2024, 531,899 sq.m. in FY2025, and 233,438 sq.m. in 2026 H1. Actual output registered at 429,991 sq.m. (78.5% utilization) in FY2023, 471,215 sq.m. (92.0% utilization) in FY2024, 437,707 sq.m. (82.3% utilization) in FY2025, and 220,094 sq.m. (94.3% utilization) in 2026 H1.
* Thailand Rayong Base (Prachinburi/Rayong - P5 Plant): Operated by Dynamic Technology Manufacturing (Thailand) Co., Ltd. (registered capital 9.1 billion THB). Spans 27 land parcels (262,874 sq.m.) and 36 buildings (257,773 sq.m.). Commercial production started in Q4 2024. Design capacity stood at 26,688 sq.m. in FY2024, 494,468 sq.m. in FY2025, and 155,305 sq.m. in 2026 H1. Actual output rose from 17,750 sq.m. (66.5% utilization) in FY2024 to 337,593 sq.m. (68.3% utilization) in FY2025 and 118,339 sq.m. (76.2% utilization) in 2026 H1. The facility is awarded Thailand Board of Investment (BOI) status, granting an 8-year 100% Corporate Income Tax exemption. Non-current assets allocated to Thailand rose from $30.94 million (RMB 222.38 million) in FY2023 to $243.90 million (RMB 1,753.07 million) in FY2024, $332.15 million (RMB 2,387.32 million) in FY2025, and $468.40 million (RMB 3,366.65 million) as of June 30, 2026. Initial ramp costs generated onerous contract provisions of $2.90 million (RMB 20.77 million) in FY2024 and $1.60 million (RMB 11.51 million) in FY2025.
Geographic Revenue Breakdown (Client Destination)
* Mainland China (excluding Bonded Zones): FY2023: $106,752.6K (RMB 767,284K; 21.0%); FY2024: RMB 856,972K (20.8%); FY2025: $161,077.2K (RMB 1,157,742K; 24.4%); 2026 H1: $114,248.2K (RMB 821,159K; 28.20%).
* Rest of Asia (including Taiwan, Province of China): FY2023: $164,386.6K (RMB 1,181,529K; 32.4%); FY2024: RMB 1,077,793K (26.1%); FY2025: $202,074.2K (RMB 1,452,408K; 30.5%); 2026 H1: $114,123.4K (RMB 820,262K; 28.17%).
* Europe: FY2023: $108,860.5K (RMB 782,435K; 21.4%); FY2024: RMB 752,784K (18.3%); FY2025: $97,377.4K (RMB 699,900K; 14.7%); 2026 H1: $49,455.0K (RMB 355,458K; 12.21%).
* Americas: FY2023: $51,528.9K (RMB 370,364K; 10.1%); FY2024: RMB 500,052K (12.1%); FY2025: $68,219.3K (RMB 490,326K; 10.3%); 2026 H1: $51,785.2K (RMB 372,206K; 12.78%).
* Africa: FY2023: $742.7K (RMB 5,338K; 0.1%); FY2024: RMB 3,468K (0.1%); FY2025: $411.1K (RMB 2,955K; 0.1%); 2026 H1: $260.0K (RMB 1,869K; 0.06%).
* PRC Bonded Zones: FY2023: $76,424.6K (RMB 549,302K; 15.0%); FY2024: RMB 932,548K (22.6%); FY2025: $132,036.0K (RMB 949,009K; 20.0%); 2026 H1: $75,282.1K (RMB 541,090K; 18.58%). Total sales outside Mainland China and to PRC bonded zones represented 71.80% in 2026 H1.
Supply Chain Counterparties and Equipment Dependencies
The company operates on a Make-to-Order basis with direct sales exceeding 95%. Top 5 customer concentration declined from 49.9% in FY2023 to 43.0% in FY2024, 38.2% in FY2025, and 34.7% ($140.45 million / RMB 1,009.50 million) in 2026 H1. The largest customer (Customer A, a German automotive Tier-1 supplier) accounted for 17.4% of revenue in FY2023, 13.8% in FY2024, 11.4% in FY2025, and 9.7% in 2026 H1. Customer B (a US EMS provider) contributed 8.4% in 2026 H1, Customer D (a German automotive Tier-1) contributed 6.8%, Customer C (a French automotive Tier-1) contributed 4.9%, and Customer G (Taiwan, Province of China computing ODM) contributed 4.9%.
Top 5 supplier concentration rose from 41.5% in FY2023 to 40.1% in FY2024, 42.2% in FY2025, and 45.3% ($125.78 million / RMB 904.00 million) in 2026 H1. Supplier A (Taiwan, Province of China; CCL and Prepreg) represented 14.2% of purchases in 2026 H1. Supplier B (Jiangsu, Mainland China; gold salt) accounted for 12.2%. Supplier E (Jiangxi, Mainland China; copper balls and oxide powder) accounted for 7.4% ($20.47 million / RMB 147.13 million); Dynamic also sold copper scrap back to Supplier E totaling RMB 8.00 million ($1.11 million) in 2026 H1. Supplier G (Jiangsu, Mainland China; CCL) accounted for 6.6%, and Supplier C (Jiangsu, Mainland China; CCL) represented 4.9%.
Expansion at the Thailand and Huangshi sites requires imported capital equipment with 6 to 12 month delivery cycles, specifically Laser Direct Imaging (LDI) systems for lines under 45 μm pitch, high-precision laser drillers for micro-vias under 0.15 mm, vertical continuous plating (VCP) lines, and automated lamination presses for high-layer counts up to 78 layers.
Corporate Governance, Shareholding, and Independence
The ultimate controlling shareholder is Dynamic Holding Co., Ltd. [TWSE: 3715] (incorporated in Taiwan, Province of China), which holds an indirect 86.10% controlling stake through Wintek (Mauritius) Co., Ltd. and Dynamic Electronics Holding Pte. Ltd. (DEH, Singapore). Public A-shareholders hold 13.90% following the October 2025 listing on the Shanghai Stock Exchange, which raised gross proceeds of $124.76 million (RMB 896.70 million) at RMB 17.08 per share. Pre-IPO shares are locked up for 36 months until October 23, 2028. The Board of Directors includes 7 members (3 Executive, 1 Non-Executive, 3 INEDs; 28.6% female representation). Chairman and General Manager Mr. Huang Ming-Hong possesses over 25 years of industry experience. The R&D staff totals 1,383 personnel (19.8% of 6,972 total employees). A share option program adopted on May 11, 2026, issued 3,343,000 options to 419 core personnel at RMB 96.16 per share.
The parent company executed a binding Deed of Non-Competition on December 15, 2023, granting Dynamic Electronics Co., Ltd. a global Right of First Refusal (ROFR) over PCB opportunities. Transactions with DSG Group were phased out to zero in FY2025. Parent entities provided guarantees for $232.97 million (RMB 1,674.49 million) of the company's bank borrowings as of June 30, 2026, exempt from HKEX listing approval under Rule 14A.90; the group maintained $423.50 million in standalone unutilized credit lines and $253.96 million (RMB 1,825.80 million) in cash reserves as of July 31, 2026. Auxiliary structures measuring 2,087 sq.m. at Kunshan lack planning permits and are fully indemnified by the controlling shareholder.
HDIN Institutional Verdict
Dynamic Electronics Co., Ltd.'s capital deployment balances a defensive hedge against Western trade restrictions with a targeted expansion into high-tier interconnect segments. By commercializing its Thailand Rayong P5 plant ahead of competitors, the company creates an offshore channel to retain Tier-1 automotive and Cloud Service Provider contracts subject to Section 301 tariffs (reaching 37.5% combined rates on direct Mainland exports).
Global Market Position and Peer Comparison
* Automotive HDI Global Leadership: The company ranked 1 globally in Automotive HDI boards with a 15.0% market share ($182.26 million / RMB 1,310 million) in FY2025, expanding to 17.0% ($112.70 million / RMB 810 million) in 2026 H1.
* Automotive Total Rigid PCB: Dynamic ranked 8 globally in FY2025 with a 3.8% share ($365.91 million / RMB 2,628.14 million), advancing to 6 globally in 2026 H1 with a 4.1% share ($208.70 million / RMB 1,495.03 million). In FY2025, competitors ranked as follows: Company A ($966.96M / RMB 6.95B; 10.9%), Company B ($637.22M / RMB 4.58B; 8.7%), Company D ($521.74M / RMB 3.75B; 5.4%), Company C ($448.00M / RMB 3.22B; 5.3%), Company E / Wus Printed Circuit ($422.96M / RMB 3.04B; 4.8%), Company F ($418.78M / RMB 3.01B; 4.1%), Company G / Olympic Circuit ($386.78M / RMB 2.78B; 3.9%), Dynamic Electronics ($365.91M / RMB 2.63B; 3.8%), Company I / Kinwong Electronics ($360.35M / RMB 2.59B; 3.8%), Company J ($322.78M / RMB 2.32B; 2.9%).
* AI Storage and Memory Modules: Dynamic ranked 3 globally in Memory Module PCBs with an 8.1% share ($40.35 million / RMB 290 million) in 2026 H1, and 3 globally in AI Data Storage PCBs ($32.00 million / RMB 230 million in 2026 H1). The overall global PCB market is projected by Frost & Sullivan and Prismark to expand from $85.8 billion in 2025 to $144.6 billion by 2030 (9.1% CAGR), with Automotive HDI expanding at 14.3%, Telecom and AI Servers at 13.9%, and Data Storage at 13.7%.
Operational Execution and Balance Sheet Constraints
The strategic reallocation into 6 to 8-stage HDI, 50 to 78-layer backplanes, DDR5/SOCAMM modules, and 1.6T Co-Packaged Optics (CPO) architectures has driven blended ASP up 35.70% to RMB 1,684 per sq.m. ($234.30 per sq.m.). Nevertheless, execution risks remain concentrated in the cost structure:
1. Automotive Margin Compression: Automotive PCB gross margin fell to 2.8% in 2026 H1 due to annual OEM contractual price cuts of 1% to 5% coinciding with a 31.3% increase in copper prices. Fixed customer contract pricing limits real-time cost pass-through.
2. Asset Ramp Drag in Thailand: Thailand capacity utilization of 76.2% in 2026 H1 continues to dilute operating leverage, having generated $4.50 million (RMB 32.28 million) in cumulative onerous contract provisions across FY2024 and FY2025.
3. Liquidity and Gearing Sensitivity: With negative Free Cash Flow of -$179.50 million in 2026 H1, contracted CapEx commitments of $239.90 million (RMB 1,724.30 million), and Net Gearing expanding to 150.79%, capital structure stability depends directly on completing the HKEX H-share listing to fund ongoing Thailand Phase II outlays.
Presentation Download & Video Access
- Presentation Download: Click the PDF download link under 'Related Topics' to access the full institutional presentation of this report.
- Video Link: Click this link to watch the HDIN analyst briefing on YouTube.
About HDIN Research
HDIN Research is a premier global market intelligence and strategic advisory firm specializing in institutional-grade financial analysis, supply chain audits, and macroeconomic forecasting. Our dedicated sector analysts deliver actionable, data-driven insights tailored for private equity, hedge funds, and corporate strategy teams. Visit us at http://www.hdinresearch.com.
2026 AI Transparency Footer
"This intelligence report was authored by HDIN Research analysts following a rigorous audit of official corporate filings. AI was utilized for massive-scale data synthesis and structural drafting, ensuring 100% inclusion of reported data points. All strategic insights, financial modeling, and final verdicts were verified by our editorial board to ensure professional accuracy and compliance with 2026 Google Search E-E-A-T standards."
1. Dynamic Electronics Co., Ltd. pivoted toward High-Density Interconnect (HDI) boards, which reached 43.78% of revenue in 2026 H1, while blended ASP rose 35.70% to RMB 1,684 per sq.m. ($234.30 per sq.m.).
2. The offshore expansion at the Thailand Rayong base absorbed $468.40 million in non-current assets as of June 30, 2026, anchoring a "China + 1" structure where overseas and bonded markets accounted for 71.80% of revenue.
3. Heavy CapEx totaling $188.66 million in 2026 H1 dropped Free Cash Flow to -$179.50 million, elevating Net Gearing to 150.79% and requiring HKEX H-share listing proceeds to alleviate debt refinancing strain.
Figure Dynamic Electronics HKEX IPO Intelligence Infographic
Segmental Realities and Margin CompressionDynamic Electronics Co., Ltd. [SSE: 603175.SH] expanded its top-line revenue at a 14.01% CAGR from $508.70 million (RMB 3,656.25 million) in FY2023 to $661.20 million (RMB 4,752.34 million) in FY2025. In 2026 H1, revenue rose 33.29% YoY to $405.15 million (RMB 2,912.04 million). However, gross profit margin contracted from 23.54% in FY2023 to 20.02% in FY2025 and 15.21% in 2026 H1, a cumulative decline of 833 basis points. In 2026 H1, the company registered an operating loss of -$13.89 million (-RMB 99.85 million) and a consolidated net loss of -$26.60 million (-RMB 191.21 million), driven by a $23.73 million (RMB 170.53 million) unhedged non-cash foreign exchange loss caused by the accounting revaluation of USD-denominated net monetary liabilities.
Consolidated Financial Trajectory (2023 – 2026 H1)
* Consolidated Revenue: FY2023: $508,695.9K (RMB 3,656,252K); FY2024: $573,720.6K (RMB 4,123,617K); FY2025: $661,195.1K (RMB 4,752,340K); 2025 H1: $303,969.0K (RMB 2,184,777K); 2026 H1: $405,154.0K (RMB 2,912,044K).
* Cost of Sales: FY2023: $388,929.4K (RMB 2,795,430K); FY2024: $445,437.1K (RMB 3,201,579K); FY2025: $528,799.1K (RMB 3,800,781K); 2025 H1: $237,048.3K (RMB 1,703,785K); 2026 H1: $343,539.8K (RMB 2,469,192K).
* Gross Profit: FY2023: $119,766.5K (RMB 860,822K); FY2024: $128,283.6K (RMB 922,038K); FY2025: $132,390.8K (RMB 951,559K); 2025 H1: $66,920.6K (RMB 480,992K); 2026 H1: $61,614.2K (RMB 442,852K).
* Operating Profit (EBIT): FY2023: $56,982.7K (RMB 409,563K); FY2024: $60,112.7K (RMB 432,060K); FY2025: $54,463.4K (RMB 391,456K); 2025 H1: $32,770.9K (RMB 235,541K); 2026 H1: -$13,892.7K (-RMB 99,854K).
* EBITDA: FY2023: $94,762.2K (RMB 681,103K); FY2024: $100,198.7K (RMB 720,178K); FY2025: $108,322.9K (RMB 778,571K); 2025 H1: $58,159.9K (RMB 418,024K); 2026 H1: $16,289.0K (RMB 117,077K).
* Net Profit Attributable to Owners: FY2023: $37,030.3K (RMB 266,155K); FY2024: $38,430.2K (RMB 276,217K); FY2025: $32,187.8K (RMB 231,350K); 2025 H1: $22,093.8K (RMB 158,799K); 2026 H1: -$26,602.6K (-RMB 191,206K).
* Operating Cash Flow (CFO): FY2023: $113,877.4K (RMB 818,494K); FY2024: $84,285.2K (RMB 605,800K); FY2025: $57,423.2K (RMB 412,729K); 2025 H1: $29,096.9K (RMB 209,134K); 2026 H1: $9,162.4K (RMB 65,855K).
* Cash Capital Expenditure (CapEx): FY2023: $98,065.2K (RMB 704,844K); FY2024: $177,447.8K (RMB 1,275,406K); FY2025: $210,275.9K (RMB 1,511,358K); 2025 H1: $90,656.3K (RMB 651,592K); 2026 H1: $188,663.0K (RMB 1,356,015K).
* Free Cash Flow (FCF): FY2023: $15,812.2K (RMB 113,650K); FY2024: -$93,162.6K (-RMB 669,606K); FY2025: -$152,852.7K (-RMB 1,098,629K); 2025 H1: -$61,559.4K (-RMB 442,458K); 2026 H1: -$179,500.5K (-RMB 1,290,160K).
Product Category Revenue and Pricing Metrics
* Double-sided Boards: Revenue contribution was 7.25% in FY2023, 6.38% in FY2024, 4.79% in FY2025, 5.51% in 2025 H1, and 3.75% in 2026 H1. ASP moved from RMB 645/sq.m. ($89.7) in FY2023 to RMB 595/sq.m. ($82.8) in FY2024, RMB 562/sq.m. ($78.2) in FY2025, and RMB 614/sq.m. ($85.4) in 2026 H1. Gross margin dropped from 23.9% in FY2023 to 3.9% in 2026 H1.
* Multi-layer Boards (4 to 6 Layers): Revenue share declined from 42.67% in FY2023 to 33.64% in FY2024, 30.22% in FY2025, 33.37% in 2025 H1, and 24.69% in 2026 H1. ASP stood at RMB 938/sq.m. ($130.5) in FY2023, RMB 918/sq.m. ($127.7) in FY2024, RMB 895/sq.m. ($124.5) in FY2025, and RMB 970/sq.m. ($135.0) in 2026 H1. Gross margin dropped from 19.6% in FY2023 to 0.3% in 2026 H1.
* Multi-layer Boards (8 to 14 Layers): Revenue share was 23.38% in FY2023, 22.79% in FY2024, 20.62% in FY2025, 19.21% in 2025 H1, and 20.62% in 2026 H1. ASP rose from RMB 2,065/sq.m. ($287.3) in FY2023 to RMB 2,186/sq.m. ($304.1) in FY2024, RMB 2,183/sq.m. ($303.7) in FY2025, and RMB 2,523/sq.m. ($351.0) in 2026 H1.
* Multi-layer Boards (16 Layers & Above): Revenue share represented 0.00% in FY2023, 0.07% in FY2024, 0.25% in FY2025, 0.07% in 2025 H1, and 0.17% in 2026 H1. ASP registered at RMB 11,388/sq.m. ($1,584) in FY2023, RMB 14,161/sq.m. ($1,970) in FY2024, RMB 13,292/sq.m. ($1,849) in FY2025, and RMB 9,505/sq.m. ($1,322) in 2026 H1.
* HDI Boards: Revenue contribution expanded from 23.37% in FY2023 to 32.79% in FY2024, 37.52% in FY2025, 35.79% in 2025 H1, and 43.78% in 2026 H1. ASP grew from RMB 2,364/sq.m. ($328.9) in FY2023 to RMB 2,440/sq.m. ($339.5) in FY2024, RMB 2,512/sq.m. ($349.5) in FY2025, and RMB 2,833/sq.m. ($394.2) in 2026 H1. Gross margin shifted from 25.0% in FY2023 to 27.7% in FY2024, 23.1% in FY2025, and 13.8% in 2026 H1.
* Other Operations (Scrap Sales): Revenue contribution moved from 3.32% in FY2023 to 4.32% in FY2024, 6.59% in FY2025, 6.04% in 2025 H1, and 6.99% in 2026 H1 ($28.31 million / RMB 203.50 million in 2026 H1, carrying a 99.4% gross margin).
* Consolidated PCB ASP: Blended ASP climbed from RMB 1,241/sq.m. ($172.7) in FY2023 to RMB 1,343/sq.m. ($186.9) in FY2024, RMB 1,400/sq.m. ($194.8) in FY2025, and RMB 1,684/sq.m. ($234.3) in 2026 H1. Total sales volume tracked at 2,849K sq.m. in FY2023, 2,937K sq.m. in FY2024, 3,170K sq.m. in FY2025, and 1,608K sq.m. in 2026 H1.
Downstream Sector Revenue Share and Application Margin
* Automotive Electronics: Sales share moved from 68.87% (RMB 2,517.92M) in FY2023 to 65.65% (RMB 2,707.10M) in FY2024, 55.30% (RMB 2,628.14M) in FY2025, 59.57% (RMB 1,299.26M) in 2025 H1, and 51.34% (RMB 1,495.03M / $208.00M) in 2026 H1. Application gross margin compressed from 19.4% in FY2023 to 16.7% in FY2024, 12.2% in FY2025, and 2.8% in 2026 H1.
* Data Storage: Sales share expanded from 7.02% (RMB 256.72M) in FY2023 to 7.66% (RMB 316.04M) in FY2024, 11.53% (RMB 548.09M) in FY2025, 9.03% (RMB 197.32M) in 2025 H1, and 15.82% (RMB 460.75M / $64.10M) in 2026 H1 (+133.5% YoY). Application gross margin tracked at 22.3% in FY2023, 25.3% in FY2024, 21.1% in FY2025, and 20.1% in 2026 H1.
* Telecom & AI Servers: Sales share shifted from 4.27% (RMB 156.22M) in FY2023 to 6.88% (RMB 283.89M) in FY2024, 9.28% (RMB 440.90M) in FY2025, 8.11% (RMB 177.28M) in 2025 H1, and 10.00% (RMB 291.21M / $40.52M) in 2026 H1 (+64.3% YoY). Application gross margin stood at 25.9% in FY2023, 27.5% in FY2024, 19.6% in FY2025, and 17.0% in 2026 H1.
* Display: Sales share accounted for 11.78% (RMB 430.62M) in FY2023, 10.46% (RMB 431.20M) in FY2024, 10.93% (RMB 519.45M) in FY2025, 11.08% (RMB 242.08M) in 2025 H1, and 8.94% (RMB 260.29M) in 2026 H1. Application gross margin dropped from 26.3% in FY2023 to 17.9% in FY2024, 10.0% in FY2025, and 10.8% in 2026 H1.
* Consumer Electronics: Sales share accounted for 4.47% (RMB 163.29M) in FY2023, 4.55% (RMB 187.62M) in FY2024, 5.62% (RMB 266.93M) in FY2025, 5.73% (RMB 125.08M) in 2025 H1, and 5.91% (RMB 172.21M) in 2026 H1. Gross margin stood at 22.3% in FY2023, 26.0% in FY2024, 18.5% in FY2025, and 13.7% in 2026 H1.
* Other Applications: Sales share was 0.28% (RMB 10.19M) in FY2023, 0.47% (RMB 19.52M) in FY2024, 0.75% (RMB 35.53M) in FY2025, 0.54% (RMB 11.77M) in 2025 H1, and 1.00% (RMB 29.05M) in 2026 H1.
Raw material expenditures constituted 55.5% of COGS in FY2023, 53.8% in FY2024, 55.2% ($292.08 million / RMB 2,099.29 million) in FY2025, and 56.9% ($195.44 million / RMB 1,404.71 million) in 2026 H1. Spot copper prices advanced from $8.5K per ton in 2023 to $13.0K per ton in 2026 H1 (+31.3%). Customer pricing resets lag input inflation by 3 to 6 months, while automotive contracts enforce mandatory annual price reductions of 1% to 5%. A 1% increase in raw material procurement prices reduces gross margin by 48.2 basis points under the 2026 H1 cost structure.
Working Capital and Credit Structure
* Balance Sheet Liquidity: Cash and cash equivalents reached $152.13 million (RMB 1,093.41 million) as of June 30, 2026, supplemented by $1.15 million (RMB 8.24 million) in pledged deposits. Standalone unutilized bank credit facilities totaled $423.50 million.
* Leverage Profile: Total interest-bearing debt expanded to $683.04 million (RMB 4,909.35 million) as of June 30, 2026, comprising $218.71 million (RMB 1,572.01 million) in short-term bank borrowings and current portions of long-term debt, $462.79 million (RMB 3,326.29 million) in long-term borrowings, and $1.54 million (RMB 11.05 million) in lease liabilities. Net debt reached $529.77 million (RMB 3,807.70 million). The Net Gearing Ratio increased to 150.79%, while the Asset-Liability Ratio reached 75.61%. The Current Ratio stood at 1.01x, the Quick Ratio at 0.73x, and Interest Coverage dropped to -1.28x in 2026 H1.
* Working Capital Metrics: The Cash Conversion Cycle (CCC) lengthened to +25 days in 2026 H1 (+20 days in FY2023; -14 days in FY2024; +1 day in FY2025). Inventory turnover days tracked at 85 days in 2026 H1 (86 days in FY2025). Accounts receivable turnover days registered at 95 days in 2026 H1 (96 days in FY2025), with 100% of billed receivables under 1 year of age and a blended Expected Credit Loss (ECL) rate of 0.24%. Overdue accounts past 30 days are impaired at 100%. One-month post-period collection of 2026 H1 receivables reached 29.1% (RMB 488.9 million collected by July 31, 2026). Accounts payable turnover days fell to 155 days in 2026 H1 from 181 days in FY2025.
* Inventory Diagnostics: Inventory gross book value increased to RMB 1,252.01 million ($174.19 million) as of June 30, 2026, comprising raw materials of RMB 223.88 million ($31.15 million), work-in-progress (WIP) of RMB 373.58 million ($51.98 million), finished goods of RMB 255.77 million ($35.59 million), and Vendor-Managed Inventory (VMI) goods in transit of RMB 318.13 million ($44.26 million; 25.4% of total inventory). Inventory provisions reached RMB 79.24 million in FY2025 and RMB 80.65 million in 2026 H1, reflecting an inventory reserve ratio of 6.44%. The subsequent one-month inventory utilization rate stood at 46.5% as of July 31, 2026.
Operating Costs and Capitalized Depreciation
Operating expenses as a share of revenue totaled 12.73% in FY2023, 13.50% in FY2024, 12.09% in FY2025, and 11.32% in 2026 H1.
* Selling and marketing expense ratio stood at 3.61% in FY2023, 3.23% in FY2024, 2.24% ($14.78 million / RMB 106.24 million) in FY2025, and 2.46% ($9.96 million / RMB 71.57 million) in 2026 H1.
* Administrative expense ratio was 5.78% in FY2023, 7.00% ($40.18 million / RMB 288.78 million) in FY2024, 6.43% ($42.54 million / RMB 305.73 million) in FY2025, and 5.14% ($20.82 million / RMB 149.63 million) in 2026 H1.
* R&D expense ratio reached 3.34% ($16.98 million / RMB 122.07 million) in FY2023, 3.27% ($18.78 million / RMB 135.03 million) in FY2024, 3.42% ($22.61 million / RMB 162.53 million) in FY2025, and 3.72% ($15.06 million / RMB 108.23 million) in 2026 H1. Under IAS 38, R&D expenditures are 100% expensed with 0% capitalization. Personnel compensation accounted for 66.4% and material consumption accounted for 21.2% of 2026 H1 R&D expenses.
* PPE Depreciation: Fixed asset depreciation rose from $36.85 million (RMB 264.83 million) in FY2023 to $52.75 million (RMB 379.15 million) in FY2025. Machinery is depreciated across 5.15 to 11.1 years (annual depreciation rates of 9.00% to 19.40%). As of June 30, 2026, machinery gross book value reached RMB 3,616.42 million ($503.15 million), accumulated depreciation stood at RMB 1,664.91 million, resulting in a machinery replacement newness ratio of 53.96%. Construction in progress stood at RMB 1,541 million.
Infrastructure Layout and Regional Moats
Dynamic Electronics Co., Ltd. operates three manufacturing complexes with a combined production volume that expanded from 2,766,770 sq.m. in FY2023 to 3,009,560 sq.m. in FY2024, 3,256,889 sq.m. in FY2025, and 1,542,897 sq.m. in 2026 H1. Consolidated utilization rates were 90.7% in FY2023, 93.6% in FY2024, 86.3% in FY2025, and 94.8% in 2026 H1. The sales-to-production ratio was 102.97% in FY2023, 97.59% in FY2024, 97.33% in FY2025, and 104.22% in 2026 H1.
Operational Footprint by Manufacturing Base
* Huangshi Base (Hubei, Mainland China - P1 and P2 Plants): Primary site for automotive electronics, data storage, and telecommunication PCBs. Design capacity tracked at 2,501,148 sq.m. in FY2023, 2,677,595 sq.m. in FY2024, 2,747,904 sq.m. in FY2025, and 1,239,247 sq.m. in 2026 H1. Actual output was 2,336,779 sq.m. (93.4% utilization) in FY2023, 2,520,595 sq.m. (94.1% utilization) in FY2024, 2,481,589 sq.m. (90.3% utilization) in FY2025, and 1,204,464 sq.m. (97.2% utilization) in 2026 H1.
* Kunshan Base (Jiangsu, Mainland China): Dedicated to automotive, display, and consumer rigid PCBs. Design capacity was 547,901 sq.m. in FY2023, 511,987 sq.m. in FY2024, 531,899 sq.m. in FY2025, and 233,438 sq.m. in 2026 H1. Actual output registered at 429,991 sq.m. (78.5% utilization) in FY2023, 471,215 sq.m. (92.0% utilization) in FY2024, 437,707 sq.m. (82.3% utilization) in FY2025, and 220,094 sq.m. (94.3% utilization) in 2026 H1.
* Thailand Rayong Base (Prachinburi/Rayong - P5 Plant): Operated by Dynamic Technology Manufacturing (Thailand) Co., Ltd. (registered capital 9.1 billion THB). Spans 27 land parcels (262,874 sq.m.) and 36 buildings (257,773 sq.m.). Commercial production started in Q4 2024. Design capacity stood at 26,688 sq.m. in FY2024, 494,468 sq.m. in FY2025, and 155,305 sq.m. in 2026 H1. Actual output rose from 17,750 sq.m. (66.5% utilization) in FY2024 to 337,593 sq.m. (68.3% utilization) in FY2025 and 118,339 sq.m. (76.2% utilization) in 2026 H1. The facility is awarded Thailand Board of Investment (BOI) status, granting an 8-year 100% Corporate Income Tax exemption. Non-current assets allocated to Thailand rose from $30.94 million (RMB 222.38 million) in FY2023 to $243.90 million (RMB 1,753.07 million) in FY2024, $332.15 million (RMB 2,387.32 million) in FY2025, and $468.40 million (RMB 3,366.65 million) as of June 30, 2026. Initial ramp costs generated onerous contract provisions of $2.90 million (RMB 20.77 million) in FY2024 and $1.60 million (RMB 11.51 million) in FY2025.
Geographic Revenue Breakdown (Client Destination)
* Mainland China (excluding Bonded Zones): FY2023: $106,752.6K (RMB 767,284K; 21.0%); FY2024: RMB 856,972K (20.8%); FY2025: $161,077.2K (RMB 1,157,742K; 24.4%); 2026 H1: $114,248.2K (RMB 821,159K; 28.20%).
* Rest of Asia (including Taiwan, Province of China): FY2023: $164,386.6K (RMB 1,181,529K; 32.4%); FY2024: RMB 1,077,793K (26.1%); FY2025: $202,074.2K (RMB 1,452,408K; 30.5%); 2026 H1: $114,123.4K (RMB 820,262K; 28.17%).
* Europe: FY2023: $108,860.5K (RMB 782,435K; 21.4%); FY2024: RMB 752,784K (18.3%); FY2025: $97,377.4K (RMB 699,900K; 14.7%); 2026 H1: $49,455.0K (RMB 355,458K; 12.21%).
* Americas: FY2023: $51,528.9K (RMB 370,364K; 10.1%); FY2024: RMB 500,052K (12.1%); FY2025: $68,219.3K (RMB 490,326K; 10.3%); 2026 H1: $51,785.2K (RMB 372,206K; 12.78%).
* Africa: FY2023: $742.7K (RMB 5,338K; 0.1%); FY2024: RMB 3,468K (0.1%); FY2025: $411.1K (RMB 2,955K; 0.1%); 2026 H1: $260.0K (RMB 1,869K; 0.06%).
* PRC Bonded Zones: FY2023: $76,424.6K (RMB 549,302K; 15.0%); FY2024: RMB 932,548K (22.6%); FY2025: $132,036.0K (RMB 949,009K; 20.0%); 2026 H1: $75,282.1K (RMB 541,090K; 18.58%). Total sales outside Mainland China and to PRC bonded zones represented 71.80% in 2026 H1.
Supply Chain Counterparties and Equipment Dependencies
The company operates on a Make-to-Order basis with direct sales exceeding 95%. Top 5 customer concentration declined from 49.9% in FY2023 to 43.0% in FY2024, 38.2% in FY2025, and 34.7% ($140.45 million / RMB 1,009.50 million) in 2026 H1. The largest customer (Customer A, a German automotive Tier-1 supplier) accounted for 17.4% of revenue in FY2023, 13.8% in FY2024, 11.4% in FY2025, and 9.7% in 2026 H1. Customer B (a US EMS provider) contributed 8.4% in 2026 H1, Customer D (a German automotive Tier-1) contributed 6.8%, Customer C (a French automotive Tier-1) contributed 4.9%, and Customer G (Taiwan, Province of China computing ODM) contributed 4.9%.
Top 5 supplier concentration rose from 41.5% in FY2023 to 40.1% in FY2024, 42.2% in FY2025, and 45.3% ($125.78 million / RMB 904.00 million) in 2026 H1. Supplier A (Taiwan, Province of China; CCL and Prepreg) represented 14.2% of purchases in 2026 H1. Supplier B (Jiangsu, Mainland China; gold salt) accounted for 12.2%. Supplier E (Jiangxi, Mainland China; copper balls and oxide powder) accounted for 7.4% ($20.47 million / RMB 147.13 million); Dynamic also sold copper scrap back to Supplier E totaling RMB 8.00 million ($1.11 million) in 2026 H1. Supplier G (Jiangsu, Mainland China; CCL) accounted for 6.6%, and Supplier C (Jiangsu, Mainland China; CCL) represented 4.9%.
Expansion at the Thailand and Huangshi sites requires imported capital equipment with 6 to 12 month delivery cycles, specifically Laser Direct Imaging (LDI) systems for lines under 45 μm pitch, high-precision laser drillers for micro-vias under 0.15 mm, vertical continuous plating (VCP) lines, and automated lamination presses for high-layer counts up to 78 layers.
Corporate Governance, Shareholding, and Independence
The ultimate controlling shareholder is Dynamic Holding Co., Ltd. [TWSE: 3715] (incorporated in Taiwan, Province of China), which holds an indirect 86.10% controlling stake through Wintek (Mauritius) Co., Ltd. and Dynamic Electronics Holding Pte. Ltd. (DEH, Singapore). Public A-shareholders hold 13.90% following the October 2025 listing on the Shanghai Stock Exchange, which raised gross proceeds of $124.76 million (RMB 896.70 million) at RMB 17.08 per share. Pre-IPO shares are locked up for 36 months until October 23, 2028. The Board of Directors includes 7 members (3 Executive, 1 Non-Executive, 3 INEDs; 28.6% female representation). Chairman and General Manager Mr. Huang Ming-Hong possesses over 25 years of industry experience. The R&D staff totals 1,383 personnel (19.8% of 6,972 total employees). A share option program adopted on May 11, 2026, issued 3,343,000 options to 419 core personnel at RMB 96.16 per share.
The parent company executed a binding Deed of Non-Competition on December 15, 2023, granting Dynamic Electronics Co., Ltd. a global Right of First Refusal (ROFR) over PCB opportunities. Transactions with DSG Group were phased out to zero in FY2025. Parent entities provided guarantees for $232.97 million (RMB 1,674.49 million) of the company's bank borrowings as of June 30, 2026, exempt from HKEX listing approval under Rule 14A.90; the group maintained $423.50 million in standalone unutilized credit lines and $253.96 million (RMB 1,825.80 million) in cash reserves as of July 31, 2026. Auxiliary structures measuring 2,087 sq.m. at Kunshan lack planning permits and are fully indemnified by the controlling shareholder.
HDIN Institutional Verdict
Dynamic Electronics Co., Ltd.'s capital deployment balances a defensive hedge against Western trade restrictions with a targeted expansion into high-tier interconnect segments. By commercializing its Thailand Rayong P5 plant ahead of competitors, the company creates an offshore channel to retain Tier-1 automotive and Cloud Service Provider contracts subject to Section 301 tariffs (reaching 37.5% combined rates on direct Mainland exports).
Global Market Position and Peer Comparison
* Automotive HDI Global Leadership: The company ranked 1 globally in Automotive HDI boards with a 15.0% market share ($182.26 million / RMB 1,310 million) in FY2025, expanding to 17.0% ($112.70 million / RMB 810 million) in 2026 H1.
* Automotive Total Rigid PCB: Dynamic ranked 8 globally in FY2025 with a 3.8% share ($365.91 million / RMB 2,628.14 million), advancing to 6 globally in 2026 H1 with a 4.1% share ($208.70 million / RMB 1,495.03 million). In FY2025, competitors ranked as follows: Company A ($966.96M / RMB 6.95B; 10.9%), Company B ($637.22M / RMB 4.58B; 8.7%), Company D ($521.74M / RMB 3.75B; 5.4%), Company C ($448.00M / RMB 3.22B; 5.3%), Company E / Wus Printed Circuit ($422.96M / RMB 3.04B; 4.8%), Company F ($418.78M / RMB 3.01B; 4.1%), Company G / Olympic Circuit ($386.78M / RMB 2.78B; 3.9%), Dynamic Electronics ($365.91M / RMB 2.63B; 3.8%), Company I / Kinwong Electronics ($360.35M / RMB 2.59B; 3.8%), Company J ($322.78M / RMB 2.32B; 2.9%).
* AI Storage and Memory Modules: Dynamic ranked 3 globally in Memory Module PCBs with an 8.1% share ($40.35 million / RMB 290 million) in 2026 H1, and 3 globally in AI Data Storage PCBs ($32.00 million / RMB 230 million in 2026 H1). The overall global PCB market is projected by Frost & Sullivan and Prismark to expand from $85.8 billion in 2025 to $144.6 billion by 2030 (9.1% CAGR), with Automotive HDI expanding at 14.3%, Telecom and AI Servers at 13.9%, and Data Storage at 13.7%.
Operational Execution and Balance Sheet Constraints
The strategic reallocation into 6 to 8-stage HDI, 50 to 78-layer backplanes, DDR5/SOCAMM modules, and 1.6T Co-Packaged Optics (CPO) architectures has driven blended ASP up 35.70% to RMB 1,684 per sq.m. ($234.30 per sq.m.). Nevertheless, execution risks remain concentrated in the cost structure:
1. Automotive Margin Compression: Automotive PCB gross margin fell to 2.8% in 2026 H1 due to annual OEM contractual price cuts of 1% to 5% coinciding with a 31.3% increase in copper prices. Fixed customer contract pricing limits real-time cost pass-through.
2. Asset Ramp Drag in Thailand: Thailand capacity utilization of 76.2% in 2026 H1 continues to dilute operating leverage, having generated $4.50 million (RMB 32.28 million) in cumulative onerous contract provisions across FY2024 and FY2025.
3. Liquidity and Gearing Sensitivity: With negative Free Cash Flow of -$179.50 million in 2026 H1, contracted CapEx commitments of $239.90 million (RMB 1,724.30 million), and Net Gearing expanding to 150.79%, capital structure stability depends directly on completing the HKEX H-share listing to fund ongoing Thailand Phase II outlays.
Presentation Download & Video Access
- Presentation Download: Click the PDF download link under 'Related Topics' to access the full institutional presentation of this report.
- Video Link: Click this link to watch the HDIN analyst briefing on YouTube.
About HDIN Research
HDIN Research is a premier global market intelligence and strategic advisory firm specializing in institutional-grade financial analysis, supply chain audits, and macroeconomic forecasting. Our dedicated sector analysts deliver actionable, data-driven insights tailored for private equity, hedge funds, and corporate strategy teams. Visit us at http://www.hdinresearch.com.
2026 AI Transparency Footer
"This intelligence report was authored by HDIN Research analysts following a rigorous audit of official corporate filings. AI was utilized for massive-scale data synthesis and structural drafting, ensuring 100% inclusion of reported data points. All strategic insights, financial modeling, and final verdicts were verified by our editorial board to ensure professional accuracy and compliance with 2026 Google Search E-E-A-T standards."