Exascale Labs Holdings Inc.: Asset-Light GaaS Model Surges 111.3% as Hong Kong Pivot Signals Regulatory Friction
Date : 2026-10-06
Reading : 126
HDIN Executive Takeaways
1. Exascale Labs Holdings Inc. [NASDAQ: EXAS] accelerated FY2026 consolidated revenue by 111.3% YoY to $14,822,799, driven by an expansion in deployed compute capacity to 1.82M Tflops across 1,154.7 GPUs and an enterprise ARPU increase of 128.0% to $570k.
2. Geographic realization transitioned heavily into the Asia-Pacific corridor, with Hong Kong generating $4,539,901 (30.6% share), elevating regulatory exposure under pending U.S. Bureau of Industry and Security foreign Infrastructure-as-a-Service verification frameworks.
3. Despite narrowing operating loss margins to -32.4% (+1,100 bps YoY), gross margin remains structurally capped at 16.3% due to high third-party sourcing fees (83.7% cost of revenue), while two insiders hold 94.8% voting control via 20:1 super-voting Class B equity.
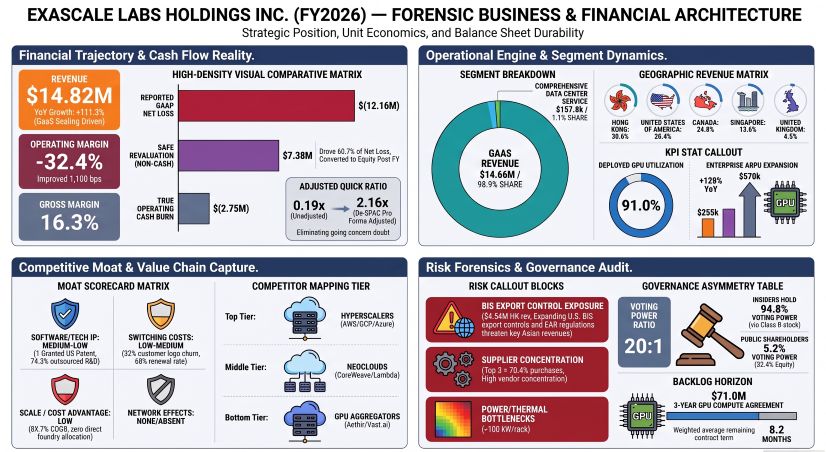
Figure EXASCALE LABS HOLDINGS INC- FORENSIC BUSINESS & FINANCIAL ARCHITECTURE
 Segmental Realities and Operating Leverage Decoupling
Exascale Labs Holdings Inc. operates as a single reportable segment under ASC 280 (GPU Computing Platform Services), evaluated on a consolidated basis by its Chief Operating Decision Maker. Revenue recognition under ASC 606 is disaggregated across two active service lines: Intelligent Computing Power Service (GPU-as-a-Service, or GaaS) and Comprehensive Data Center Service (AIDC Cluster Management). Complementary modular infrastructure solutions (modular data centers, liquid cooling, High-Voltage Direct Current power, interconnect, and storage) generated $0 revenue during FY2026.
Top-line revenue increased 111.3% YoY from $7,015,512 in FY2025 to $14,822,799 in FY2026. The expansion was propelled by GaaS, which climbed 124.0% YoY to $14,664,937, expanding from 93.3% to 98.9% of total net sales. Concurrently, Comprehensive Data Center Service contracted 66.4% YoY from $469,263 to $157,862 (1.1% of revenue) as customer scope was systematically reduced across its stable base of two clients.
Under ASC 606 contract pricing categories, Reserved Capacity Arrangements represented $14,652,429 (98.8% of total revenue), increasing 125.4% YoY from $6,501,569 in FY2025, operating under terms ranging between 3 months and 3 years. On-Demand (Pay-As-You-Go) arrangements receded 72.0% YoY to $12,508 (0.1% of total revenue), down from $44,680 in FY2025.
Table CONSOLIDATED FINANCIAL PERFORMANCE BREAKDOWN (ASC 280 / ASC 606)
Gross profit advanced 118.8% YoY to $2,418,253, reflecting a modest gross margin expansion of 50 bps from 15.8% to 16.3%. Cost of revenue of $12,404,546 (83.7% of total revenue) primarily comprises third-party GPU server capacity, power, colocation, hosting, and transit fees. Because Exascale Labs Holdings Inc. sources capacity externally rather than owning hardware fleets, cost of revenue displays a near-perfect variable elasticity of 0.99 relative to sales.
Operating leverage surfaced through operational expense efficiency:
* Selling and marketing outlays declined 49.5% YoY to $499,392 (contracting from 14.1% to 3.4% of revenue), as $4.8M (61.5%) of top-line growth was unlocked via existing account expansion.
* General and administrative expenses grew 238.7% YoY to $1,229,516 (5.3% of revenue), pushed by $785,257 in legal, audit, and public readiness fees associated with the business combination. General corporate payroll represented $444,259.
* Research and development costs grew 96.2% YoY to $5,490,185, representing 76.1% of total operating expenses and 37.0% of revenue (down 290 bps YoY). Disaggregated R&D expenditures reveal that $4,079,430 (74.3%) was paid to outsourced external software engineering contractors, while $1,410,755 was allocated to cluster throughput and compute testing. Zero internal-use software costs were capitalized on the balance sheet.
Total operating loss expanded in dollar terms from $(3,044,846) to $(4,800,840), but operating loss margins compressed positively by 1,100 bps from -43.4% to -32.4%. GAAP net loss widened 58.8% YoY to $(12,162,391). Non-operating Level 3 fair value revaluations on Simple Agreements for Future Equity (SAFEs) accounted for 60.7% ($7,377,383) of the net loss, driven by Black-Scholes valuation adjustments tracking the company's private-to-public equity price step-up.
Operating cash burn stood at $(2,754,624), diverging from GAAP net loss. Free cash flow was $(2,754,624) as FY2026 capital expenditures were $0 (compared to $2,138 in FY2025). The cash drain was amplified by a $992,725 surge in net Accounts Receivable (reaching $1,106,750 net of a $38,000 credit allowance), counterbalanced by an $826,400 increase in Accounts Payable ($916,400 total) and a $637,618 increase in Contract Liabilities ($1,070,378 total). The Cash Conversion Cycle registered at +0.2 days on an ending basis (DSO: 27.2 days, DIO: 0.0 days, DPO: 26.96 days).
Prior to its De-SPAC closing, Exascale Labs Holdings Inc. carried a GAAP Quick Ratio of 0.19x, with $5,961,082 in quick assets ($2,693,586 in cash; $2,160,746 in USDC stablecoins) against $31,894,795 in current liabilities, triggering a going concern audit explanatory note. On August 27, 2026, the De-SPAC business combination closed, automatically converting $29,121,570 in current SAFE liabilities (plus $1,000,000 issued in July 2026) into Class A Common Stock, eliminating funded interest-bearing debt, and injecting $11,800,000 in net cash proceeds. This recapitalization expanded pro forma liquid reserves to ~$16.6M, cutting post-merger current liabilities to $2,763,225 and elevating the adjusted Quick Ratio to 2.16x.
Operational KPIs and Realization Metrics
The company benchmarks compute operations on a standardized 730-hour monthly framework across bare-metal and virtualized clusters.
Table RIGOROUS OPERATIONAL KPI & COMPUTE REALIZATION FRAMEWORK
Compute intensity advanced substantially: deployed theoretical compute surged 205.1% YoY to 1,816,187 Tflops, outstripping physical deployed GPU count growth (+41.4%) as management transitioned supply toward higher-density silicon architectures. Enterprise ARPU expanded by 128.0% YoY to $570k, compensating for customer logo retention that declined 2,200 bps to 68.0% (19 of 28 FY2025 accounts renewed). Customer concentration remains elevated, with top Customer C generating 20.1% ($2,979,383) and Customer D accounting for 19.2% ($2,845,977) of consolidated net revenue.
Subsequent to the fiscal year-end, the company executed a 3-year Compute Service Agreement on July 15, 2026, securing ~4,000 PFLOPS (FP16) of accelerator compute capacity valued at ~$71.0M in contracted fees. On July 21, 2026, the firm signed a non-binding Memorandum of Understanding (MoU) to jointly develop >=20 MW of data center capacity in Japan. In the same month, Exascale Labs Holdings Inc. disbursed a $1,500,000 convertible loan to a third party.
Infrastructure Layout, Geographic Vectors, and Regional Moats
Exascale Labs Holdings Inc. operates an asset-light posture with zero balance sheet real estate or data center facilities. Long-lived physical equipment on the balance sheet totaled $12,840 net, located exclusively within the United States, generating annual depreciation of $6,760 ($6,234 in FY2025). The physical footprint comprises:
* Executive Headquarters: 820 Gessner Road, Suite 332, Houston, Texas, USA. Leased office space supporting 5 executive and corporate employees (CEO, CFO, Partnerships Lead, R&D Lead, Marketing Lead).
* Technical & Operations Hub: Evana Alpha Pte. Ltd., Singapore (wholly owned subsidiary incorporated December 2025). Virtual operations hub supporting 7 full-time personnel (1 Business Development Lead, 4 Senior R&D Engineers, 2 Operations Personnel).
* Third-Party Co-Location Sites: Distributed hosting infrastructure across the United States of America, Canada, Hong Kong, Singapore, and the United Kingdom, serviced via third-party on-site technical personnel.
Table GEOGRAPHIC REVENUE ALLOCATION MATRIX (BY CUSTOMER BILLING DESTINATION)
Supply architecture is exposed to high third-party supplier concentration. Procurement of third-party GPU compute is concentrated across three vendors accounting for 70.4% of total FY2026 purchases: Supplier B (31.0%), Supplier C (28.0%), and Supplier D (18.4%). Furthermore, Supplier C represented 77.3% of the company's $916,400 Accounts Payable balance at fiscal year-end.
Intellectual property defenses remain narrow. The technological moat rests on 1 granted U.S. Patent (US 12,058,179, "Computing Power Network System", granted August 2024, expiring ~August 2043), alongside three pending U.S. applications:
1. Application 19/440,612: AIOps Scheduling Method Based on Multi-Agent Collaborative Autonomy (filed January 5, 2026).
2. Application 19/440,577: Adaptive Supply-and-Return Water Temperature Regulation System for Modular Data Centers (filed January 5, 2026).
3. Application 19/444,167: Method and System for Maximizing Throughput of a GPU Cluster (filed January 8, 2026).
4. Pending Software Copyright: Case No: 1-15021399291 (Exascale Artificial Intelligence Computing Power Management Platform, filed October 15, 2025).
Exascale Labs Holdings Inc. maintains zero granted patents across Hong Kong, Canada, Singapore, or the United Kingdom.
Corporate governance reveals extreme voting concentration under a dual-class share structure (adopted January 2026) allocating 20 votes per share to Class B stock versus 1 vote per share to Class A stock. As of September 25, 2026, Chairperson Wenying Jia controls 25,645,739 Class B shares via Zerowave Ltd (79.3% voting power), while CEO Dr. Hoansoo Lee controls 5,000,000 Class B shares (2,000,000 via HSL Capital Management LLC; 3,000,000 via three Non-Grantor Directed Trusts), commanding 15.5% voting power. Together, these two founding insiders control 94.8% of total shareholder voting rights, leaving public Class A equity holders (52.4% equity stake) with 5.2% voting representation. The board maintains a 60% independence ratio (Dr. David Card, Dr. Shachar Kariv, Jaeyoung Shin), with Jaeyoung Shin serving as Audit Committee Financial Expert.
Under the executive employment agreement effective August 27, 2026, CEO Hoansoo Lee's annual base compensation increased 288% to $420,000 (up from $108,000 base in FY2026, of which $81,000 was paid in-period following $27,000 in related-party consulting disbursements). The agreement institutes guaranteed cash bonuses of $150,000 annually starting FY2028, annual grants of 300,000 time-based Class A RSUs through August 2029, up to 300,000 milestone-based RSUs tied to ARR hurdles of $20.0M and $30.0M, and single-trigger full equity vesting acceleration upon termination without cause or resignation for good reason, lacking post-employment non-compete covenants. Conversely, CFO Jake Carney operates under a flat $6,000 monthly ($72,000 annualized) contractor retainer with zero equity participation or severance provisions.
Financial control risks persist: management and independent auditors identified material weaknesses in internal controls over financial reporting under U.S. GAAP and SEC standards due to insufficient in-house technical accounting headcount and non-formalized accounting documentation. Remediation is not projected to conclude until calendar year-end 2027. Disclosures also revealed that $500,000 in FY2026 SAFE capital (and $1,207,626 in FY2025) was temporarily held and disbursed by an individual employee agent on behalf of the company, though settled to $0 by fiscal year-end. Corporate treasury held $2,160,746 in USDC stablecoins with a single third-party digital asset custodian.
Tax positions reflect a 0% effective tax rate, supported by a full valuation allowance of $3,009,413 against deferred tax assets ($1,652,998 in FY2025). Exascale holds $9.9M in U.S. federal net operating loss (NOL) carryforwards, $6.1M in state NOLs, and $0.4M in Singapore NOLs, subject to Section 382 ownership change limitations following the De-SPAC recapitalization. Zero active litigation or loss contingency accruals are recorded.
HDIN Institutional Verdict
Exascale Labs Holdings Inc.’s pure asset-light architecture provides high balance sheet insulation against hardware obsolescence write-downs and capital expenditure inflation, evidenced by its $0 FY2026 CapEx and immediate expensing of all R&D software outlays. However, the business model exhibits significant structural fragility. By acting as a pure software orchestration overlay without direct hardware ownership or foundry agreements, the firm absorbs high supplier concentration (top 3 vendors drive 70.4% of procurement; Supplier C controls 77.3% of payables), capping gross margins at 16.3%.
Furthermore, while the De-SPAC transaction resolved immediate going concern doubts through the extinguishment of $29.12M in SAFE liabilities and an $11.8M cash injection, forward execution faces dual headwinds: a 2,200 bps degradation in customer renewal rates (to 68.0%) that forces reliance on ARPU expansion, and an acute geographic tilt toward Hong Kong (30.6% of revenue). This concentration intersects directly with proposed U.S. BIS Infrastructure-as-a-Service foreign customer verification rules and EAR export restrictions. With 94.8% voting control entrenched across two insiders, public equity holders lack governance mechanisms to mitigate operational and geopolitical execution risks.
Presentation Download & Video Access:
- Presentation Download: Click the PDF download link under 'Related Topics' to access the full institutional presentation of this report.
- Video Link: Click this link to watch the HDIN analyst briefing on YouTube.
About HDIN Research:
HDIN Research is a premier global market intelligence and strategic advisory firm specializing in institutional-grade financial analysis, supply chain audits, and macroeconomic forecasting. Our dedicated sector analysts deliver actionable, data-driven insights tailored for private equity, hedge funds, and corporate strategy teams. Visit us at http://www.hdinresearch.com.
2026 AI Transparency Footer:
"This intelligence report was authored by HDIN Research analysts following a rigorous audit of official corporate filings. AI was utilized for massive-scale data synthesis and structural drafting, ensuring 100% inclusion of reported data points. All strategic insights, financial modeling, and final verdicts were verified by our editorial board to ensure professional accuracy and compliance with 2026 Google Search E-E-A-T standards."
1. Exascale Labs Holdings Inc. [NASDAQ: EXAS] accelerated FY2026 consolidated revenue by 111.3% YoY to $14,822,799, driven by an expansion in deployed compute capacity to 1.82M Tflops across 1,154.7 GPUs and an enterprise ARPU increase of 128.0% to $570k.
2. Geographic realization transitioned heavily into the Asia-Pacific corridor, with Hong Kong generating $4,539,901 (30.6% share), elevating regulatory exposure under pending U.S. Bureau of Industry and Security foreign Infrastructure-as-a-Service verification frameworks.
3. Despite narrowing operating loss margins to -32.4% (+1,100 bps YoY), gross margin remains structurally capped at 16.3% due to high third-party sourcing fees (83.7% cost of revenue), while two insiders hold 94.8% voting control via 20:1 super-voting Class B equity.
Figure EXASCALE LABS HOLDINGS INC- FORENSIC BUSINESS & FINANCIAL ARCHITECTURE
Segmental Realities and Operating Leverage DecouplingExascale Labs Holdings Inc. operates as a single reportable segment under ASC 280 (GPU Computing Platform Services), evaluated on a consolidated basis by its Chief Operating Decision Maker. Revenue recognition under ASC 606 is disaggregated across two active service lines: Intelligent Computing Power Service (GPU-as-a-Service, or GaaS) and Comprehensive Data Center Service (AIDC Cluster Management). Complementary modular infrastructure solutions (modular data centers, liquid cooling, High-Voltage Direct Current power, interconnect, and storage) generated $0 revenue during FY2026.
Top-line revenue increased 111.3% YoY from $7,015,512 in FY2025 to $14,822,799 in FY2026. The expansion was propelled by GaaS, which climbed 124.0% YoY to $14,664,937, expanding from 93.3% to 98.9% of total net sales. Concurrently, Comprehensive Data Center Service contracted 66.4% YoY from $469,263 to $157,862 (1.1% of revenue) as customer scope was systematically reduced across its stable base of two clients.
Under ASC 606 contract pricing categories, Reserved Capacity Arrangements represented $14,652,429 (98.8% of total revenue), increasing 125.4% YoY from $6,501,569 in FY2025, operating under terms ranging between 3 months and 3 years. On-Demand (Pay-As-You-Go) arrangements receded 72.0% YoY to $12,508 (0.1% of total revenue), down from $44,680 in FY2025.
Table CONSOLIDATED FINANCIAL PERFORMANCE BREAKDOWN (ASC 280 / ASC 606)
| Financial Metric (in US$) | FY2025 | FY2026 | YoY Change (US$) | YoY Change (%) |
|---|---|---|---|---|
| Total Revenue | $7,015,512 | $14,822,799 | +$7,807,287 | +111.3% |
| • Intelligent Computing (GaaS) | $6,546,249 | $14,664,937 | +$8,118,688 | +124.0% |
| • Comprehensive Data Center Services | $469,263 | $157,862 | -$311,401 | -66.4% |
| • Modular Infrastructure Solutions | $0 | $0 | $0 | 0.0% |
| Cost of Revenue | $(5,910,315) | $(12,404,546) | -$6,494,231 | +109.9% |
| Gross Profit | $1,105,197 | $2,418,253 | +$1,313,056 | +118.8% |
| Gross Margin (%) | 15.8% | 16.3% | +50 bps | +3.2% |
| Selling & Marketing (S&M) | $(989,155) | $(499,392) | +$489,763 | -49.5% |
| General & Administrative (G&A) | $(362,982) | $(1,229,516) | -$866,534 | +238.7% |
| Research & Development (R&D) | $(2,797,906) | $(5,490,185) | -$2,692,279 | +96.2% |
| Total Operating Expenses | $(4,150,043) | $(7,219,093) | -$3,069,050 | +74.0% |
| Loss from Operations (EBIT) | $(3,044,846) | $(4,800,840) | -$1,755,994 | +57.7% |
| Operating Margin (%) | -43.4% | -32.4% | +1,100 bps | +25.3% |
| SAFE Fair Value Adjustment | $(4,614,821) | $(7,377,383) | -$2,762,562 | +59.9% |
| Other Income (USDC Yield) | $0 | $15,832 | +$15,832 | N/A |
| GAAP Net Loss | $(7,659,667) | $(12,162,391) | -$4,502,724 | +58.8% |
| Diluted Loss Per Share (EPS) | $(5,106.44) | $(8,108.26) | -$3,001.82 | +58.8% |
| Weighted Shares Outstanding (Basic & Diluted) | 1,500 | 1,500 | 0 | 0.0% |
Gross profit advanced 118.8% YoY to $2,418,253, reflecting a modest gross margin expansion of 50 bps from 15.8% to 16.3%. Cost of revenue of $12,404,546 (83.7% of total revenue) primarily comprises third-party GPU server capacity, power, colocation, hosting, and transit fees. Because Exascale Labs Holdings Inc. sources capacity externally rather than owning hardware fleets, cost of revenue displays a near-perfect variable elasticity of 0.99 relative to sales.
Operating leverage surfaced through operational expense efficiency:
* Selling and marketing outlays declined 49.5% YoY to $499,392 (contracting from 14.1% to 3.4% of revenue), as $4.8M (61.5%) of top-line growth was unlocked via existing account expansion.
* General and administrative expenses grew 238.7% YoY to $1,229,516 (5.3% of revenue), pushed by $785,257 in legal, audit, and public readiness fees associated with the business combination. General corporate payroll represented $444,259.
* Research and development costs grew 96.2% YoY to $5,490,185, representing 76.1% of total operating expenses and 37.0% of revenue (down 290 bps YoY). Disaggregated R&D expenditures reveal that $4,079,430 (74.3%) was paid to outsourced external software engineering contractors, while $1,410,755 was allocated to cluster throughput and compute testing. Zero internal-use software costs were capitalized on the balance sheet.
Total operating loss expanded in dollar terms from $(3,044,846) to $(4,800,840), but operating loss margins compressed positively by 1,100 bps from -43.4% to -32.4%. GAAP net loss widened 58.8% YoY to $(12,162,391). Non-operating Level 3 fair value revaluations on Simple Agreements for Future Equity (SAFEs) accounted for 60.7% ($7,377,383) of the net loss, driven by Black-Scholes valuation adjustments tracking the company's private-to-public equity price step-up.
Operating cash burn stood at $(2,754,624), diverging from GAAP net loss. Free cash flow was $(2,754,624) as FY2026 capital expenditures were $0 (compared to $2,138 in FY2025). The cash drain was amplified by a $992,725 surge in net Accounts Receivable (reaching $1,106,750 net of a $38,000 credit allowance), counterbalanced by an $826,400 increase in Accounts Payable ($916,400 total) and a $637,618 increase in Contract Liabilities ($1,070,378 total). The Cash Conversion Cycle registered at +0.2 days on an ending basis (DSO: 27.2 days, DIO: 0.0 days, DPO: 26.96 days).
Prior to its De-SPAC closing, Exascale Labs Holdings Inc. carried a GAAP Quick Ratio of 0.19x, with $5,961,082 in quick assets ($2,693,586 in cash; $2,160,746 in USDC stablecoins) against $31,894,795 in current liabilities, triggering a going concern audit explanatory note. On August 27, 2026, the De-SPAC business combination closed, automatically converting $29,121,570 in current SAFE liabilities (plus $1,000,000 issued in July 2026) into Class A Common Stock, eliminating funded interest-bearing debt, and injecting $11,800,000 in net cash proceeds. This recapitalization expanded pro forma liquid reserves to ~$16.6M, cutting post-merger current liabilities to $2,763,225 and elevating the adjusted Quick Ratio to 2.16x.
Operational KPIs and Realization Metrics
The company benchmarks compute operations on a standardized 730-hour monthly framework across bare-metal and virtualized clusters.
Table RIGOROUS OPERATIONAL KPI & COMPUTE REALIZATION FRAMEWORK
| Operational Metric / KPI | FY2025 | FY2026 | YoY Delta | YoY Delta (%) |
|---|---|---|---|---|
| Average Contracted GPU Supply | 935.3 GPUs | 1,294.7 GPUs | +359.4 | +38.4% |
| Contracted Theoretical Compute Capacity | 733,231 Tflops | 2,194,087 Tflops | +1,460,856 | +199.2% |
| Average Deployed GPU Capacity | 816.7 GPUs | 1,154.7 GPUs | +338.0 | +41.4% |
| Deployed Theoretical Compute Capacity | 595,289 Tflops | 1,816,187 Tflops | +1,220,898 | +205.1% |
| Customer-Contracted GPU Capacity | 754.7 GPUs | 1,050.8 GPUs | +296.1 | +39.2% |
| Customer-Contracted Compute Capacity | 532,238 Tflops | 1,580,057 Tflops | +1,047,819 | +196.9% |
| Available GPU-Hours (Denominator) | 7,154,000 hrs | 10,114,880 hrs | +2,960,880 | +41.4% |
| Billable GPU-Hours (Numerator) | 6,610,880 hrs | 9,205,008 hrs | +2,594,128 | +39.2% |
| Capacity Utilization Rate | 92.4% | 91.0% | -140 bps | -1.5% |
| Weighted Contract Term Remaining | 4.2 months | 8.2 months | +4.0 months | +95.2% |
| Average Customer Usage Duration | 8.2 months | 11.8 months | +3.6 months | +43.9% |
| Enterprise ARPU | $250,000 | $570,000 | +$320,000 | +128.0% |
| Customer Renewal Rate | ~90% | 68.0% (19/28) | -2,200 bps | -24.4% |
| Active Enterprise Customers | 28 clients | ~50 clients | +22 | +78.6% |
Compute intensity advanced substantially: deployed theoretical compute surged 205.1% YoY to 1,816,187 Tflops, outstripping physical deployed GPU count growth (+41.4%) as management transitioned supply toward higher-density silicon architectures. Enterprise ARPU expanded by 128.0% YoY to $570k, compensating for customer logo retention that declined 2,200 bps to 68.0% (19 of 28 FY2025 accounts renewed). Customer concentration remains elevated, with top Customer C generating 20.1% ($2,979,383) and Customer D accounting for 19.2% ($2,845,977) of consolidated net revenue.
Subsequent to the fiscal year-end, the company executed a 3-year Compute Service Agreement on July 15, 2026, securing ~4,000 PFLOPS (FP16) of accelerator compute capacity valued at ~$71.0M in contracted fees. On July 21, 2026, the firm signed a non-binding Memorandum of Understanding (MoU) to jointly develop >=20 MW of data center capacity in Japan. In the same month, Exascale Labs Holdings Inc. disbursed a $1,500,000 convertible loan to a third party.
Infrastructure Layout, Geographic Vectors, and Regional Moats
Exascale Labs Holdings Inc. operates an asset-light posture with zero balance sheet real estate or data center facilities. Long-lived physical equipment on the balance sheet totaled $12,840 net, located exclusively within the United States, generating annual depreciation of $6,760 ($6,234 in FY2025). The physical footprint comprises:
* Executive Headquarters: 820 Gessner Road, Suite 332, Houston, Texas, USA. Leased office space supporting 5 executive and corporate employees (CEO, CFO, Partnerships Lead, R&D Lead, Marketing Lead).
* Technical & Operations Hub: Evana Alpha Pte. Ltd., Singapore (wholly owned subsidiary incorporated December 2025). Virtual operations hub supporting 7 full-time personnel (1 Business Development Lead, 4 Senior R&D Engineers, 2 Operations Personnel).
* Third-Party Co-Location Sites: Distributed hosting infrastructure across the United States of America, Canada, Hong Kong, Singapore, and the United Kingdom, serviced via third-party on-site technical personnel.
Table GEOGRAPHIC REVENUE ALLOCATION MATRIX (BY CUSTOMER BILLING DESTINATION)
| Destination / Region | FY2025 Revenue | FY2025 Share (%) | FY2026 Revenue | FY2026 Share (%) | YoY Growth (%) |
|---|---|---|---|---|---|
| Hong Kong | $600,000 | 8.6% | $4,539,901 | 30.6% | +656.6% |
| United States of America | $2,085,579 | 29.7% | $3,913,744 | 26.4% | +87.7% |
| Canada | $1,443,306 | 20.6% | $3,679,780 | 24.8% | +154.9% |
| Singapore | $2,484,905 | 35.4% | $2,023,271 | 13.6% | -18.6% |
| United Kingdom | $391,722 | 5.6% | $666,103 | 4.5% | +70.0% |
| Others | $10,000 | 0.1% | $0 | 0.0% | -100.0% |
| Total Consolidated Revenue | $7,015,512 | 100.0% | $14,822,799 | 100.0% | +111.3% |
Supply architecture is exposed to high third-party supplier concentration. Procurement of third-party GPU compute is concentrated across three vendors accounting for 70.4% of total FY2026 purchases: Supplier B (31.0%), Supplier C (28.0%), and Supplier D (18.4%). Furthermore, Supplier C represented 77.3% of the company's $916,400 Accounts Payable balance at fiscal year-end.
Intellectual property defenses remain narrow. The technological moat rests on 1 granted U.S. Patent (US 12,058,179, "Computing Power Network System", granted August 2024, expiring ~August 2043), alongside three pending U.S. applications:
1. Application 19/440,612: AIOps Scheduling Method Based on Multi-Agent Collaborative Autonomy (filed January 5, 2026).
2. Application 19/440,577: Adaptive Supply-and-Return Water Temperature Regulation System for Modular Data Centers (filed January 5, 2026).
3. Application 19/444,167: Method and System for Maximizing Throughput of a GPU Cluster (filed January 8, 2026).
4. Pending Software Copyright: Case No: 1-15021399291 (Exascale Artificial Intelligence Computing Power Management Platform, filed October 15, 2025).
Exascale Labs Holdings Inc. maintains zero granted patents across Hong Kong, Canada, Singapore, or the United Kingdom.
Corporate governance reveals extreme voting concentration under a dual-class share structure (adopted January 2026) allocating 20 votes per share to Class B stock versus 1 vote per share to Class A stock. As of September 25, 2026, Chairperson Wenying Jia controls 25,645,739 Class B shares via Zerowave Ltd (79.3% voting power), while CEO Dr. Hoansoo Lee controls 5,000,000 Class B shares (2,000,000 via HSL Capital Management LLC; 3,000,000 via three Non-Grantor Directed Trusts), commanding 15.5% voting power. Together, these two founding insiders control 94.8% of total shareholder voting rights, leaving public Class A equity holders (52.4% equity stake) with 5.2% voting representation. The board maintains a 60% independence ratio (Dr. David Card, Dr. Shachar Kariv, Jaeyoung Shin), with Jaeyoung Shin serving as Audit Committee Financial Expert.
Under the executive employment agreement effective August 27, 2026, CEO Hoansoo Lee's annual base compensation increased 288% to $420,000 (up from $108,000 base in FY2026, of which $81,000 was paid in-period following $27,000 in related-party consulting disbursements). The agreement institutes guaranteed cash bonuses of $150,000 annually starting FY2028, annual grants of 300,000 time-based Class A RSUs through August 2029, up to 300,000 milestone-based RSUs tied to ARR hurdles of $20.0M and $30.0M, and single-trigger full equity vesting acceleration upon termination without cause or resignation for good reason, lacking post-employment non-compete covenants. Conversely, CFO Jake Carney operates under a flat $6,000 monthly ($72,000 annualized) contractor retainer with zero equity participation or severance provisions.
Financial control risks persist: management and independent auditors identified material weaknesses in internal controls over financial reporting under U.S. GAAP and SEC standards due to insufficient in-house technical accounting headcount and non-formalized accounting documentation. Remediation is not projected to conclude until calendar year-end 2027. Disclosures also revealed that $500,000 in FY2026 SAFE capital (and $1,207,626 in FY2025) was temporarily held and disbursed by an individual employee agent on behalf of the company, though settled to $0 by fiscal year-end. Corporate treasury held $2,160,746 in USDC stablecoins with a single third-party digital asset custodian.
Tax positions reflect a 0% effective tax rate, supported by a full valuation allowance of $3,009,413 against deferred tax assets ($1,652,998 in FY2025). Exascale holds $9.9M in U.S. federal net operating loss (NOL) carryforwards, $6.1M in state NOLs, and $0.4M in Singapore NOLs, subject to Section 382 ownership change limitations following the De-SPAC recapitalization. Zero active litigation or loss contingency accruals are recorded.
HDIN Institutional Verdict
Exascale Labs Holdings Inc.’s pure asset-light architecture provides high balance sheet insulation against hardware obsolescence write-downs and capital expenditure inflation, evidenced by its $0 FY2026 CapEx and immediate expensing of all R&D software outlays. However, the business model exhibits significant structural fragility. By acting as a pure software orchestration overlay without direct hardware ownership or foundry agreements, the firm absorbs high supplier concentration (top 3 vendors drive 70.4% of procurement; Supplier C controls 77.3% of payables), capping gross margins at 16.3%.
Furthermore, while the De-SPAC transaction resolved immediate going concern doubts through the extinguishment of $29.12M in SAFE liabilities and an $11.8M cash injection, forward execution faces dual headwinds: a 2,200 bps degradation in customer renewal rates (to 68.0%) that forces reliance on ARPU expansion, and an acute geographic tilt toward Hong Kong (30.6% of revenue). This concentration intersects directly with proposed U.S. BIS Infrastructure-as-a-Service foreign customer verification rules and EAR export restrictions. With 94.8% voting control entrenched across two insiders, public equity holders lack governance mechanisms to mitigate operational and geopolitical execution risks.
Presentation Download & Video Access:
- Presentation Download: Click the PDF download link under 'Related Topics' to access the full institutional presentation of this report.
- Video Link: Click this link to watch the HDIN analyst briefing on YouTube.
About HDIN Research:
HDIN Research is a premier global market intelligence and strategic advisory firm specializing in institutional-grade financial analysis, supply chain audits, and macroeconomic forecasting. Our dedicated sector analysts deliver actionable, data-driven insights tailored for private equity, hedge funds, and corporate strategy teams. Visit us at http://www.hdinresearch.com.
2026 AI Transparency Footer:
"This intelligence report was authored by HDIN Research analysts following a rigorous audit of official corporate filings. AI was utilized for massive-scale data synthesis and structural drafting, ensuring 100% inclusion of reported data points. All strategic insights, financial modeling, and final verdicts were verified by our editorial board to ensure professional accuracy and compliance with 2026 Google Search E-E-A-T standards."