Uranium Energy Corp.: Physical Inventory Arbitrage and Dilution Engine Fund Zero-Debt Expansion Across Texas and Wyoming Hubs
Date : 2026-10-05
Reading : 352
HDIN Executive Takeaways
1. Uranium Energy Corp. [NYSE American: UEC] posted a FY2026 operational cash burn of $98.56 million and a net loss of $137.31 million, yet expanded cash reserves by 232.68% to $495.46 million via $529.96 million in net equity offerings, extending its zero-debt operational runway to 4.6 years.
2. The company extracted 229,294 pounds of U3O8 across Christensen Ranch (Wyoming) and Burke Hollow (Texas) but recognized $0 in mined uranium revenue, generating 100% of its $37.25 million top line by liquidating 400,000 pounds of purchased spot inventory.
3. Exploiting SEC Regulation S-K 1300 Exploration Stage Issuer rules, Uranium Energy Corp. expensed $102.37 million in mine development costs directly to operations, shielding its balance sheet while stockpiling 359,260 pounds of unhedged domestic yellowcake to capture pricing premiums from U.S. federal and utility off-takers.
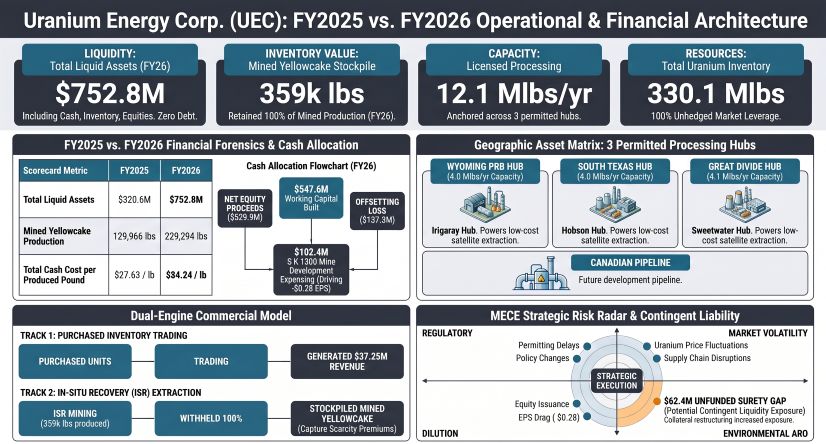
Figure Uranium Energy Corp (UEC) FY2025 vs FY2026 Operational & Financial Architecture
 Segmental Realities and Capital Optimization Mechanics
Uranium Energy Corp. reported a 44.27% year-over-year contraction in top-line sales and service revenue for FY2026 to $37.25 million, compared to $66.84 million in FY2025. This entire revenue base was generated through the physical trading of 400,000 pounds of purchased drummed inventory at an average realized price of $93.13 per pound, achieving a realized gross margin of 45.36% (up 874 basis points year-over-year from 36.62% in FY2025). The company recognized zero operational revenue from its primary mining assets, purposefully keeping 100% of its physical in-situ recovery (ISR) extraction within inventory reserves.
Operating losses widened by 81.59% to $133.15 million, driven by the immediate expensing of mine wellfield installations under SEC Regulation S-K 1300 rules. Classified as an Exploration Stage Issuer due to the absence of bankable feasibility studies, the company expensed $102.37 million as current-period Mineral Property Expenditures, up 54.95% from $66.06 million in FY2025. This expensing protocol depressed reported earnings while reducing downstream inventory carrying costs to $39.94 per produced pound (all-in) and $34.24 per pound (cash cost).
Table Financial Performance, Cash Flow Profile and Balance Sheet Indicators (FY2025–FY2026)
The company financed its operations by tapping capital markets, securing $529.96 million in net equity proceeds during the fiscal year through At-The-Market (ATM) agreements underwritten by Goldman Sachs and H.C. Wainwright, alongside public offerings. This extended a four-year capital accumulation program, which has diluted common shares outstanding by 70.21% since FY2023 (rising from 291.15 million to 495.57 million shares) to amass $1.05 billion in cumulative net financing proceeds.
Table UEC CAPITAL ALLOCATION WATERFALL (FY2025 vs. FY2026)
The balance sheet carried zero debt, zero convertible instruments, and $547.61 million in working capital as of July 31, 2026. Cash reserves reached $495.46 million, and liquid assets—comprising cash, marketable equities, and physical inventory—totaled $752.80 million, generating $15.58 million in annualized interest income. Total balance sheet assets stood at $1.51 billion, supported by $708.01 million in unamortized mineral property rights and $72.26 million in property, plant, and equipment, all of which passed annual impairment testing by independent auditor PricewaterhouseCoopers LLP with zero goodwill recognized.
Infrastructure Footprint and Cross-Border Asset Networks
Uranium Energy Corp. operates three processing hubs spanning Wyoming and Texas with a combined licensed processing capacity of 12.1 million pounds of U3O8 per year, supported by high-grade conventional assets in the Athabasca Basin of Saskatchewan, Canada.
Wyoming Powder River Basin Hub
* Irigaray Central Processing Plant (Johnson County, WY): Serves as the operating hub, licensed by the Wyoming Department of Environmental Quality (WDEQ License WYSUA-1341) for 4.0 million pounds of U3O8 per year. Processed 211,942 pounds of mined uranium in FY2026 (a 63.07% increase over FY2025 throughput of 129,966 pounds), representing a plant utilization rate of 5.30%. Facility throughput bottlenecks were mitigated through the mechanical overhaul of a primary yellowcake thickener and a rebuild of the multi-hearth calciner, enabling continuous 24/7 two-shift drying and packaging operations.
* Christensen Ranch Mine (Johnson and Campbell Counties, WY): Primary extraction spoke operating under WDEQ Permit No. 478. Produced 211,942 pounds of U3O8 from deep Wasatch Formation roll-front sandstones via an on-site 6,500-gallon-per-minute satellite ion-exchange (IX) plant. In FY2026, the company operationalized three header houses in Mine Unit 11, completed four header houses in the Mine Unit 10 Extension, and advanced wellfield patterns across Mine Unit 12.
* Ludeman Project (Converse County, WY): Permitted under WDEQ Permit No. 844 to serve as a satellite feed. Completed a 240-hole delineation drilling campaign and initiated monitor and injection wellfield installations, absorbing $22.50 million in mineral property expenditures.
* Reno Creek Project (Campbell County, WY): S-K 1300 resource base holding 12.92 million pounds Measured and 13.07 million pounds Indicated (0.043% and 0.039% U3O8, cut-off 0.20 ft% eU3O8. Maintained under Permit No. 824 in full operational readiness.
South Texas Uranium Belt Hub
* Hobson Central Processing Plant (Karnes County, TX): Processing center licensed by the Texas Commission on Environmental Quality (TCEQ) for 4.0 million pounds per year, featuring a 1.5 million pound per year vacuum drying circuit. Restarted operations in May 2026, processing 17,352 pounds of drummed yellowcake for a capacity utilization rate of 0.43%.
* Burke Hollow Mine (Bee County, TX): Commenced lixiviant injection and recovery within Production Area Authorization 1 (PAA-1) in April 2026, yielding 17,352 pounds of U3O8 trucked to Hobson as loaded resin. Advanced PAA-2 infrastructure, completing 73 monitor wells under regional Groundwater Conservation District supervision. Total FY2026 capital expenditure reached $20.93 million.
* Palangana Mine (Duval County, TX): Maintained on care and maintenance with zero active production; fully permitted for rapid restart.
* Goliad Project (Goliad County, TX): Production Area Authorizations remain subject to ongoing contested case proceedings before the State Office of Administrative Hearings (SOAH) and the TCEQ following petitioner appeals.
Wyoming Great Divide Basin Hub
* Sweetwater Mill (Sweetwater County, WY): Acquired from Rio Tinto in December 2024 for $175.40 million in cash ($44.49 million allocated to PP&E, $145.75 million to mineral properties). Features a 3,000-ton-per-day conventional mill licensed for 4.1 million pounds per year under WDEQ Permit No. 481. Under federal FAST-41 monitoring, the Bureau of Land Management is processing an ISR conversion plan targeting a final Environmental Assessment in March 2027 and formal Plan of Operations approval in May 2027. Ion-exchange vessels are being fabricated to process resin trucked from the Red Desert and Green Mountain satellite properties. Tailings management remains governed by an ongoing Corrective Action Program addressing a 1980s unlined pond leakage event.
Canadian Conventional Athabasca Basin Portfolio
* Roughrider Project (Saskatchewan, Canada): High-grade basement-hosted unconformity deposit located seven kilometers north of Points North Landing. Controls 27.86 million pounds of Indicated resources (771,000 tons at 1.81% U3O8 and 33.38 million pounds of Inferred resources (683,000 tons at 2.45% U3O8. In FY2026, the company spent $12.02 million executing a 36,000-meter diamond drill program to transition inferred material toward indicated status to support an upcoming Pre-Feasibility Study led by Tetra Tech Canada Inc. An engineering agreement with Saskatchewan Power Corporation (SaskPower) advanced a high-voltage grid connection, while mine licensing progresses toward a targeted 48 to 72-month Canadian Nuclear Safety Commission (CNSC) review window.
* Athabasca Joint Ventures: Controls an 82.77% stake in Christie Lake, a 49.10% interest in the Shea Creek project operated by Orano, and an equity holding in JCU (Canada) Exploration Company, providing access to Wheeler River (5%) and Millennium (15.05%).
Downstream, the company operates United States Uranium Refining & Conversion Corp. (UR&C), established in September 2025 to develop a 10,000 MTU per year domestic refining and conversion facility to convert yellowcake into uranium hexafluoride (UF6). The subsidiary spent $6.28 million in FY2026 on Fluor-led feasibility and siting studies across three short-listed jurisdictions, with initial licensing dockets submitted to the U.S. Nuclear Regulatory Commission.
HDIN Institutional Verdict
Uranium Energy Corp. has created a financial structure that decouples capital-market-driven liquidity from internal mine economics. The company's corporate posture relies on three balance sheet mechanisms:
First, executive leadership utilizes its Physical Uranium Program to supply commercial liquidity while preserving its domestic mining output. By selling 400,000 pounds of historically purchased uranium to realize $37.25 million in cash, the company fulfilled its final 300,000-pound legacy purchase commitment ($37.05/lb delivery cost) and cleared all future purchase liabilities to zero.
This inventory monetization generated $16.90 million in gross trading cash profit, allowing the company to retain 100% of its cumulative 359,260 pounds of domestic mined yellowcake. These domestic volumes remain unhedged to target procurement programs that require unobligated U.S. uranium—including the Department of Defense's $2.2 billion Janus microreactor initiative, the Department of Energy Strategic Reserve, and naval propulsion fuel procurements.
Second, the company's accounting structure exploits SEC Regulation S-K 1300 rules. By avoiding bankable feasibility studies, Uranium Energy Corp. classifies all assets within the exploration stage. This requires 100% of pre-extraction drilling, wellfield piping, and casing installations to be expensed immediately as Mineral Property Expenditures rather than capitalized to the balance sheet.
While this expensing inflated reported net loss to $137.31 million in FY2026, it deflated the carrying cost of produced inventory to $39.94 per pound all-in ($34.24/lb cash cost). When this stockpiled uranium is eventually liquidated, it will record amplified gross margins because the wellfields were fully written off through historical income statements.
Third, corporate governance audits reveal a structural misalignment inside the executive Short-Term Incentive Plan (STIP). Executive performance matrices allocate a 23% weighting directly to "Balance Sheet Liquid Assets," setting a $500.00 million breakthrough metric. By tapping equity markets for $529.96 million in net financing, management triggered maximum 200% STIP bonus multipliers based on ATM issuances rather than operating cash flow. CEO compensation expanded 46.05% YoY to $9.28 million, widening the CEO-to-median employee pay ratio to 134:1.
Simultaneously, environmental collateral terms were renegotiated to release $7.31 million in restricted cash back into working capital, reducing cash collateralization against $64.27 million in state surety bonds to just 2.9% ($1.89 million). This shift exposed the company to a $62.38 million unfunded surety gap against total undiscounted Asset Retirement Obligations of $93.92 million.
Uranium Energy Corp. operates as a high-beta proxy on the physical uranium market. Its financial foundation is backed by $495.46 million in unencumbered cash, zero debt, and 12.1 million pounds of licensed capacity, but institutional shareholders should note that top-line performance remains driven by public market equity dilution and inventory trading rather than positive mining cash flows.
Presentation Download & Video Access:
- Presentation Download: Click the PDF download link under 'Related Topics' to access the full institutional presentation of this report.
- Video Link: Click this link to watch the HDIN analyst briefing on YouTube.
About HDIN Research:
HDIN Research is a global market intelligence and strategic advisory firm specializing in institutional-grade financial analysis, supply chain audits, and macroeconomic forecasting. Our dedicated sector analysts deliver actionable, data-driven insights tailored for private equity, hedge funds, and corporate strategy teams. Visit us at http://www.hdinresearch.com.
2026 AI Transparency Footer:
"This intelligence report was authored by HDIN Research analysts following a rigorous audit of official corporate filings. AI was utilized for massive-scale data synthesis and structural drafting, ensuring 100% inclusion of reported data points. All strategic insights, financial modeling, and final verdicts were verified by our editorial board to ensure professional accuracy and compliance with 2026 Google Search E-E-A-T standards."
1. Uranium Energy Corp. [NYSE American: UEC] posted a FY2026 operational cash burn of $98.56 million and a net loss of $137.31 million, yet expanded cash reserves by 232.68% to $495.46 million via $529.96 million in net equity offerings, extending its zero-debt operational runway to 4.6 years.
2. The company extracted 229,294 pounds of U3O8 across Christensen Ranch (Wyoming) and Burke Hollow (Texas) but recognized $0 in mined uranium revenue, generating 100% of its $37.25 million top line by liquidating 400,000 pounds of purchased spot inventory.
3. Exploiting SEC Regulation S-K 1300 Exploration Stage Issuer rules, Uranium Energy Corp. expensed $102.37 million in mine development costs directly to operations, shielding its balance sheet while stockpiling 359,260 pounds of unhedged domestic yellowcake to capture pricing premiums from U.S. federal and utility off-takers.
Figure Uranium Energy Corp (UEC) FY2025 vs FY2026 Operational & Financial Architecture
Segmental Realities and Capital Optimization MechanicsUranium Energy Corp. reported a 44.27% year-over-year contraction in top-line sales and service revenue for FY2026 to $37.25 million, compared to $66.84 million in FY2025. This entire revenue base was generated through the physical trading of 400,000 pounds of purchased drummed inventory at an average realized price of $93.13 per pound, achieving a realized gross margin of 45.36% (up 874 basis points year-over-year from 36.62% in FY2025). The company recognized zero operational revenue from its primary mining assets, purposefully keeping 100% of its physical in-situ recovery (ISR) extraction within inventory reserves.
Operating losses widened by 81.59% to $133.15 million, driven by the immediate expensing of mine wellfield installations under SEC Regulation S-K 1300 rules. Classified as an Exploration Stage Issuer due to the absence of bankable feasibility studies, the company expensed $102.37 million as current-period Mineral Property Expenditures, up 54.95% from $66.06 million in FY2025. This expensing protocol depressed reported earnings while reducing downstream inventory carrying costs to $39.94 per produced pound (all-in) and $34.24 per pound (cash cost).
Table Financial Performance, Cash Flow Profile and Balance Sheet Indicators (FY2025–FY2026)
| Financial Metric | FY2025 ($ in thousands) | FY2026 ($ in thousands) | YoY Variance ($) | YoY Variance (%) | Strategic Commentary |
| Sales & Service Revenue | $66,837 | $37,250 | -$29,587 | -44.27% | 100% derived from purchased inventory trading (400k lbs @ $93.13/lb). |
| Cost of Goods Sold (COGS) | $42,360 | $20,355 | -$22,005 | -51.95% | Reflects historical carrying cost of liquidated purchase contracts. |
| Gross Profit | $24,477 | $16,895 | -$7,582 | -30.98% | Margin expanded to 45.36% (+874 bps) due to higher realized spot spread. |
| Mineral Property Expenditures | $66,064 | $102,365 | +$36,301 | +54.95% | Wellfield drilling & construction expensed directly under S-K 1300 rules. |
| General & Administrative (G&A) | $27,260 | $34,472 | +$7,212 | +26.46% | Personnel expansion (+$2.47M) and stock-based compensation (+$2.03M). |
| UR&C Downstream Project Costs | $0 | $6,284 | +$6,284 | N/A | Siting and engineering work executed with Fluor for conversion facility. |
| Depreciation, Amort. & Accretion | $4,474 | $6,921 | +$2,447 | +54.69% | PP&E additions from Sweetwater Mill integration and wellfield equipment. |
| Total Operating Costs | $97,798 | $150,042 | +$52,244 | +53.42% | Mine ramp-ups at Christensen Ranch and Burke Hollow drive cost base. |
| Loss from Operations | -$73,321 | -$133,147 | -$59,826 | +81.59% | Operating shortfall resulting from non-capitalized wellfield expenditure. |
| Fair Value Gain/Loss on Equities | -$18,051 | -$17,510 | +$541 | -3.00% | Non-operating mark-to-market adjustments on junior mining shares. |
| Revaluation Loss on Sub. Receipts | $0 | -$9,890 | -$9,890 | N/A | Fair value write-down on converted Uranium Royalty Corp. receipts. |
| Income/Loss from Equity Investments | -$3,352 | $7,086 | +$10,438 | +311.40% | Includes $6.83M URC share and $5.24M dilution gain, less JCU loss (-$4.99M). |
| Interest Income | $4,022 | $15,578 | +$11,556 | +287.32% | Yield generated from money market deposits following equity raises. |
| Net Loss | -$87,656 | -$137,311 | -$49,655 | +56.65% | Bottom-line deficit reflects operational ramp and non-operating write-downs. |
| Operating Cash Flow (CFO) | -$64,458 | -$98,558 | -$34,100 | +52.90% | Operating drain accelerated by uncapitalized pattern drilling. |
| PP&E Capital Expenditures | $5,480 | $8,783 | +$3,303 | +60.27% | Direct cash outlays for calciner upgrades and plant refurbishments. |
| Free Cash Flow (FCF) | -$69,938 | -$107,341 | -$37,403 | +53.48% | Total operational cash burn across mining and processing centers. |
| Cash & Cash Equivalents | $148,930 | $495,460 | +$346,530 | +232.68% | Liquidity inflated via $529.96M net equity infusions across FY2026. |
| Working Capital | $207,583 | $547,613 | +$340,030 | +163.81% | Current assets of $581.30M offset against current liabilities of $33.69M. |
| Total Debt Obligations | $0 | $0 | $0 | 0.00% | Entity carries zero drawn credit facilities and zero debt securities. |
| Asset Retirement Obligations (PV) | $39,064 | $43,139 | +$4,075 | +10.43% | Discounted reclamation liabilities ($1.68M current, $41.46M non-current). |
| Common Shares Outstanding | 454,015,855 | 495,572,369 | +41,556,514 | +9.15% | Share base expansion under At-The-Market facilities and options exercises. |
The company financed its operations by tapping capital markets, securing $529.96 million in net equity proceeds during the fiscal year through At-The-Market (ATM) agreements underwritten by Goldman Sachs and H.C. Wainwright, alongside public offerings. This extended a four-year capital accumulation program, which has diluted common shares outstanding by 70.21% since FY2023 (rising from 291.15 million to 495.57 million shares) to amass $1.05 billion in cumulative net financing proceeds.
Table UEC CAPITAL ALLOCATION WATERFALL (FY2025 vs. FY2026)
| Capital Allocation Category | FY2025 ($M) | FY2026 ($M) | YoY Change ($M) | Key Components / Use of Funds |
|---|---|---|---|---|
| INFLOW SOURCES | ||||
| Net Equity Offerings (ATM / Public) | $287.51 | $529.96 | +$242.45 | Equity financing and public-market capital raising |
| Physical Trading Cash Margin | $24.48 | $16.90 | -$7.58 | Cash margin generated from physical uranium trading |
| Interest Income Yield | $4.02 | $15.58 | +$11.56 | Interest income from cash and money-market investments |
| CAPITAL DEPLOYMENT | ||||
| 1. Project Development Capital | $50.51 | $89.81 | +$39.30 | Wellfield development and sustaining capital expenditures |
| • Development Expenditures | $33.89 | $57.80 | +$23.91 | Wellfield development activities |
| • Exploration Expenditures | $11.14 | $23.23 | +$12.09 | Exploration and resource-development activities |
| • PP&E Capital Expenditures | $5.48 | $8.78 | +$3.30 | Property, plant and equipment investment |
| 2. Net Strategic & M&A Capital | $206.05 | $81.48 | -$124.57 | Acquisitions, equity investments and securities transactions |
| • Sweetwater Acquisition | $179.60 | -- | -$179.60 | Sweetwater-related acquisition investment |
| • Equity Securities | $25.70 | $40.43 | +$14.73 | Strategic equity securities investments |
| • Uranium Royalty Corp. (URC) Subsidiary Receipts | -- | $40.00 | +$40.00 | URC subsidiary receipt investment |
| • JCU Contribution | -- | $1.05 | +$1.05 | JCU-related capital contribution |
| • Securities Sales | -$54.44 | -$1.17 | +$53.27 | Proceeds from securities dispositions |
| 3. Downstream & Strategic Outlays | $0.00 | $17.39 | +$17.39 | Conversion feasibility and physical uranium activities |
| • UR&C Feasibility | $0.00 | $6.28 | +$6.28 | Uranium refining and conversion feasibility activities |
| • Physical Delivery | $0.00 | $11.11 | +$11.11 | Physical uranium delivery-related outlays |
| NET WORKING CAPITAL EXPANSION | ||||
| Cash & Cash Equivalents | $148.93 | $495.46 | +$346.53 | +232.7% YoY |
| Total Working Capital | $207.58 | $547.61 | +$340.03 | +163.8% YoY |
The balance sheet carried zero debt, zero convertible instruments, and $547.61 million in working capital as of July 31, 2026. Cash reserves reached $495.46 million, and liquid assets—comprising cash, marketable equities, and physical inventory—totaled $752.80 million, generating $15.58 million in annualized interest income. Total balance sheet assets stood at $1.51 billion, supported by $708.01 million in unamortized mineral property rights and $72.26 million in property, plant, and equipment, all of which passed annual impairment testing by independent auditor PricewaterhouseCoopers LLP with zero goodwill recognized.
Infrastructure Footprint and Cross-Border Asset Networks
Uranium Energy Corp. operates three processing hubs spanning Wyoming and Texas with a combined licensed processing capacity of 12.1 million pounds of U3O8 per year, supported by high-grade conventional assets in the Athabasca Basin of Saskatchewan, Canada.
Wyoming Powder River Basin Hub
* Irigaray Central Processing Plant (Johnson County, WY): Serves as the operating hub, licensed by the Wyoming Department of Environmental Quality (WDEQ License WYSUA-1341) for 4.0 million pounds of U3O8 per year. Processed 211,942 pounds of mined uranium in FY2026 (a 63.07% increase over FY2025 throughput of 129,966 pounds), representing a plant utilization rate of 5.30%. Facility throughput bottlenecks were mitigated through the mechanical overhaul of a primary yellowcake thickener and a rebuild of the multi-hearth calciner, enabling continuous 24/7 two-shift drying and packaging operations.
* Christensen Ranch Mine (Johnson and Campbell Counties, WY): Primary extraction spoke operating under WDEQ Permit No. 478. Produced 211,942 pounds of U3O8 from deep Wasatch Formation roll-front sandstones via an on-site 6,500-gallon-per-minute satellite ion-exchange (IX) plant. In FY2026, the company operationalized three header houses in Mine Unit 11, completed four header houses in the Mine Unit 10 Extension, and advanced wellfield patterns across Mine Unit 12.
* Ludeman Project (Converse County, WY): Permitted under WDEQ Permit No. 844 to serve as a satellite feed. Completed a 240-hole delineation drilling campaign and initiated monitor and injection wellfield installations, absorbing $22.50 million in mineral property expenditures.
* Reno Creek Project (Campbell County, WY): S-K 1300 resource base holding 12.92 million pounds Measured and 13.07 million pounds Indicated (0.043% and 0.039% U3O8, cut-off 0.20 ft% eU3O8. Maintained under Permit No. 824 in full operational readiness.
South Texas Uranium Belt Hub
* Hobson Central Processing Plant (Karnes County, TX): Processing center licensed by the Texas Commission on Environmental Quality (TCEQ) for 4.0 million pounds per year, featuring a 1.5 million pound per year vacuum drying circuit. Restarted operations in May 2026, processing 17,352 pounds of drummed yellowcake for a capacity utilization rate of 0.43%.
* Burke Hollow Mine (Bee County, TX): Commenced lixiviant injection and recovery within Production Area Authorization 1 (PAA-1) in April 2026, yielding 17,352 pounds of U3O8 trucked to Hobson as loaded resin. Advanced PAA-2 infrastructure, completing 73 monitor wells under regional Groundwater Conservation District supervision. Total FY2026 capital expenditure reached $20.93 million.
* Palangana Mine (Duval County, TX): Maintained on care and maintenance with zero active production; fully permitted for rapid restart.
* Goliad Project (Goliad County, TX): Production Area Authorizations remain subject to ongoing contested case proceedings before the State Office of Administrative Hearings (SOAH) and the TCEQ following petitioner appeals.
Wyoming Great Divide Basin Hub
* Sweetwater Mill (Sweetwater County, WY): Acquired from Rio Tinto in December 2024 for $175.40 million in cash ($44.49 million allocated to PP&E, $145.75 million to mineral properties). Features a 3,000-ton-per-day conventional mill licensed for 4.1 million pounds per year under WDEQ Permit No. 481. Under federal FAST-41 monitoring, the Bureau of Land Management is processing an ISR conversion plan targeting a final Environmental Assessment in March 2027 and formal Plan of Operations approval in May 2027. Ion-exchange vessels are being fabricated to process resin trucked from the Red Desert and Green Mountain satellite properties. Tailings management remains governed by an ongoing Corrective Action Program addressing a 1980s unlined pond leakage event.
Canadian Conventional Athabasca Basin Portfolio
* Roughrider Project (Saskatchewan, Canada): High-grade basement-hosted unconformity deposit located seven kilometers north of Points North Landing. Controls 27.86 million pounds of Indicated resources (771,000 tons at 1.81% U3O8 and 33.38 million pounds of Inferred resources (683,000 tons at 2.45% U3O8. In FY2026, the company spent $12.02 million executing a 36,000-meter diamond drill program to transition inferred material toward indicated status to support an upcoming Pre-Feasibility Study led by Tetra Tech Canada Inc. An engineering agreement with Saskatchewan Power Corporation (SaskPower) advanced a high-voltage grid connection, while mine licensing progresses toward a targeted 48 to 72-month Canadian Nuclear Safety Commission (CNSC) review window.
* Athabasca Joint Ventures: Controls an 82.77% stake in Christie Lake, a 49.10% interest in the Shea Creek project operated by Orano, and an equity holding in JCU (Canada) Exploration Company, providing access to Wheeler River (5%) and Millennium (15.05%).
Downstream, the company operates United States Uranium Refining & Conversion Corp. (UR&C), established in September 2025 to develop a 10,000 MTU per year domestic refining and conversion facility to convert yellowcake into uranium hexafluoride (UF6). The subsidiary spent $6.28 million in FY2026 on Fluor-led feasibility and siting studies across three short-listed jurisdictions, with initial licensing dockets submitted to the U.S. Nuclear Regulatory Commission.
HDIN Institutional Verdict
Uranium Energy Corp. has created a financial structure that decouples capital-market-driven liquidity from internal mine economics. The company's corporate posture relies on three balance sheet mechanisms:
First, executive leadership utilizes its Physical Uranium Program to supply commercial liquidity while preserving its domestic mining output. By selling 400,000 pounds of historically purchased uranium to realize $37.25 million in cash, the company fulfilled its final 300,000-pound legacy purchase commitment ($37.05/lb delivery cost) and cleared all future purchase liabilities to zero.
This inventory monetization generated $16.90 million in gross trading cash profit, allowing the company to retain 100% of its cumulative 359,260 pounds of domestic mined yellowcake. These domestic volumes remain unhedged to target procurement programs that require unobligated U.S. uranium—including the Department of Defense's $2.2 billion Janus microreactor initiative, the Department of Energy Strategic Reserve, and naval propulsion fuel procurements.
Second, the company's accounting structure exploits SEC Regulation S-K 1300 rules. By avoiding bankable feasibility studies, Uranium Energy Corp. classifies all assets within the exploration stage. This requires 100% of pre-extraction drilling, wellfield piping, and casing installations to be expensed immediately as Mineral Property Expenditures rather than capitalized to the balance sheet.
While this expensing inflated reported net loss to $137.31 million in FY2026, it deflated the carrying cost of produced inventory to $39.94 per pound all-in ($34.24/lb cash cost). When this stockpiled uranium is eventually liquidated, it will record amplified gross margins because the wellfields were fully written off through historical income statements.
Third, corporate governance audits reveal a structural misalignment inside the executive Short-Term Incentive Plan (STIP). Executive performance matrices allocate a 23% weighting directly to "Balance Sheet Liquid Assets," setting a $500.00 million breakthrough metric. By tapping equity markets for $529.96 million in net financing, management triggered maximum 200% STIP bonus multipliers based on ATM issuances rather than operating cash flow. CEO compensation expanded 46.05% YoY to $9.28 million, widening the CEO-to-median employee pay ratio to 134:1.
Simultaneously, environmental collateral terms were renegotiated to release $7.31 million in restricted cash back into working capital, reducing cash collateralization against $64.27 million in state surety bonds to just 2.9% ($1.89 million). This shift exposed the company to a $62.38 million unfunded surety gap against total undiscounted Asset Retirement Obligations of $93.92 million.
Uranium Energy Corp. operates as a high-beta proxy on the physical uranium market. Its financial foundation is backed by $495.46 million in unencumbered cash, zero debt, and 12.1 million pounds of licensed capacity, but institutional shareholders should note that top-line performance remains driven by public market equity dilution and inventory trading rather than positive mining cash flows.
Presentation Download & Video Access:
- Presentation Download: Click the PDF download link under 'Related Topics' to access the full institutional presentation of this report.
- Video Link: Click this link to watch the HDIN analyst briefing on YouTube.
About HDIN Research:
HDIN Research is a global market intelligence and strategic advisory firm specializing in institutional-grade financial analysis, supply chain audits, and macroeconomic forecasting. Our dedicated sector analysts deliver actionable, data-driven insights tailored for private equity, hedge funds, and corporate strategy teams. Visit us at http://www.hdinresearch.com.
2026 AI Transparency Footer:
"This intelligence report was authored by HDIN Research analysts following a rigorous audit of official corporate filings. AI was utilized for massive-scale data synthesis and structural drafting, ensuring 100% inclusion of reported data points. All strategic insights, financial modeling, and final verdicts were verified by our editorial board to ensure professional accuracy and compliance with 2026 Google Search E-E-A-T standards."