GRID Inc.: Infrastructure Asset Pivot Compresses Gross Margin by 1,332 Bps as Revenue Reaches JPY 3.12B
Date : 2026-10-05
Reading : 205
HDIN Executive Takeaways
1. Top-line revenue increased 51.16% year-over-year to JPY 3,119,079k in FY2026, driven by JPY 756,255k from the new Infrastructure Asset segment, while operating margins fell 603 basis points to 14.73%.
2. Gross margins contracted 1,332 basis points to 60.11% as EPC outsourcing fees surged 422.17% to JPY 608,637k for grid-scale battery projects in Japan.
3. Free cash flow reversed from positive JPY 359,715k to negative JPY 349,009k, pressured by a JPY 664,904k expansion in contract assets, primarily from regional utilities.
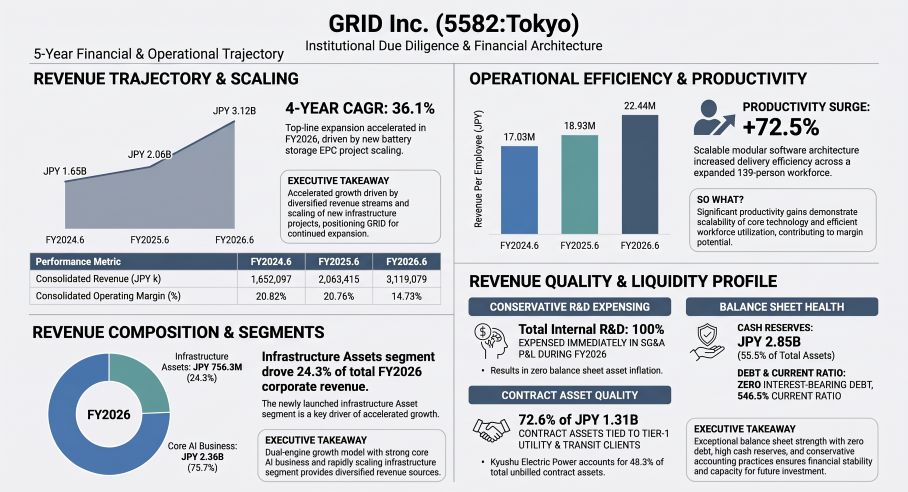
Figure GRID Inc Institutional Due Diligence & Financial Architecture
 Segment Trajectory and Gross Margin Compression
GRID Inc. [TSE: 5582] altered its financial profile in FY2026 by operationalizing a dual-segment model. The legacy AI Business was augmented by the Infrastructure Asset Business, which was launched in August 2024 (Q4 FY2025) and reported separately in FY2026. Consolidated revenue grew 51.16% year-over-year to JPY 3,119,079k, accelerating past its 4-year compound annual growth rate (CAGR) of 36.05%. However, operating profit expanded by only 7.27% to JPY 459,420k, causing the consolidated operating profit margin (OPM) to decline from 20.76% to 14.73%.
Table CONSOLIDATED FINANCIAL PERFORMANCE BRIDGE (FY2022.6 – FY2026.6)
*Note: FY2022–FY2024 operating profit reflects reported ordinary profit prior to unified post-IPO reporting.
Cost of sales grew 126.90% to JPY 1,244,072k, outpacing top-line expansion and lowering gross margin by 1,332 basis points to 60.11%. This deterioration was driven by manufacturing outsourcing fees, which rose 422.17% from JPY 116,560k to JPY 608,637k due to third-party engineering and construction costs for grid-scale battery storage facilities.
Table COST STRUCTURE & EXPENSE DISSECTION (FY2025.6 vs FY2026.6)
SG&A efficiency partially balanced the gross margin contraction: total SG&A expenses fell 729 basis points as a percentage of sales, down from 52.67% to 45.38%. This shift masked an underlying reduction in research intensity, as SG&A R&D fell from 6.89% to 4.65% of revenue.
Delivery structure showed divergent trends between software and turnkey hardware projects:
* Flow-Type Revenue: Grew 59.69% to JPY 2,479,933k, increasing from 75.26% to 79.51% of total revenue. Within this, AI system implementation accounted for JPY 1,723,677k (+15.40%), while storage EPC development contributed JPY 756,255k (+1,173.93%).
* Stock-Type Revenue: Maintained 100% within the AI segment, rising 25.22% to JPY 639,146k. Recurring software revenue expanded by 158 basis points to 27.05% of AI segment sales, supported by an average revenue per client of JPY 60,500k (+17.90% YoY) across 39 enterprise accounts.
Table MECE SEGMENT, DELIVERY & DOWNSTREAM VERTICAL MATRIX (FY2026.6)
Downstream end-market concentration shifted toward utilities and urban rail networks:
* Power & Energy: JPY 1,407,113k (+22.03% YoY; 45.11% of consolidated revenue), anchored by Kyushu Electric Power Co., Inc. [TSE: 9508], generating JPY 542,147k (17.38% of total sales). Hokkaido Electric Power Co., Inc. [TSE: 9509] contributed JPY 180,872k (5.80% of sales, dropping from 26.67% in FY2025 as major build-outs concluded).
* Infrastructure Asset: JPY 756,255k (24.25% of revenue), driven by A.D.Works Group Co., Ltd. [TSE: 2982], which generated JPY 488,355k (15.66% of total revenue) through a storage facility transfer.
* Manufacturing & Transport: JPY 477,773k (-15.35% YoY; 15.32% of total revenue), reflecting completion of initial rollouts of the ReNom VESSEL routing engine.
* Urban Infrastructure & Transport: JPY 402,849k (+86.60% YoY; 12.92% of revenue), driven by the deployment of the ReNom Railway crew scheduling suite.
* Other Verticals: JPY 75,087k (+6.28% YoY; 2.41% of total revenue).
Infrastructure Footprint and Operational Capacity
All reported revenue (100.0%, or JPY 3,119,079k) was generated inside Japan. In strict accordance with United Nations regional nomenclature, zero sales were recorded from international territories, including Taiwan, Province of China.
Operations and compute deployments are organized as follows:
* Facilities & Engineering Headquarters: In FY2026, the company relocated its central operational base to Kita-Aoyama, Minato-ku, Tokyo (Meiji Yasuda Seimei Aoyama Palacio 4F), investing JPY 221,910k in physical property, plant, and equipment additions alongside JPY 133,990k in lease security deposits.
* Cloud and Computing Architecture: ReNom APPS runs across Amazon Web Services (AWS), Microsoft Azure, and Google Cloud Platform (GCP). To comply with power grid operational regulations, the company maintains air-gapped on-premise server arrays at utility control centers and transit sites. Next-generation high-performance computing (HPC) and quantum combinatorial optimization algorithms are developed under a research initiative funded by the New Energy and Industrial Technology Development Organization (NEDO).
* Workforce Distribution: Total full-time personnel expanded 27.52% from 109 to 139 employees as of June 30, 2026. The technical division employed 93 engineers (+27.40% YoY). The AI Business deployed 102 personnel, the Infrastructure Asset segment employed 11 project managers, and 26 staff handled general administration. Average annual compensation rose 5.10% to JPY 8,883k, while output per employee increased 18.54% to JPY 22,439k.
Working Capital Mechanics and Working Capital Drain
Balance sheet quality showed signs of strain in working capital cycles. Free cash flow shifted to negative JPY 349,009k, down from positive JPY 359,715k in FY2025. Operating cash flow dropped to negative JPY 28,797k, while investing cash outflows reached JPY 320,212k due to headquarters expansion costs.
Table CASH FLOW CONVERSION AUDIT (FY2022.6 – FY2026.6)
Table WORKING CAPITAL AUDIT (FY2022.6 – FY2026.6)
A total of 70.35% of FY2026 consolidated revenue (JPY 2,194,177k) was recognized over time via cost-to-cost or labor-hour progress metrics. The working capital drain was driven by a 103.82% surge in contract assets (unbilled work-in-progress) to JPY 1,305,345k.
Independent auditor A&A Partners classified total estimated project costs on over-time contracts as a Key Audit Matter (KAM). Counterparty exposure for contract assets remains concentrated: Kyushu Electric Power Co., Inc. holds JPY 631,102k (48.35%), Hanshin Electric Railway Co., Ltd. holds JPY 168,696k (12.92%), EREX Co., Ltd. [TSE: 9517] accounts for JPY 148,201k (11.35%), A.D.Works Group Co., Ltd. represents JPY 135,458k (10.38%), and Kansai Electric Power Co., Inc. [TSE: 9503] holds JPY 58,609k (4.49%). No allowance for doubtful accounts was booked.
Formally reported remaining performance obligations dropped 23.54% to JPY 245,510k (with JPY 189,103k scheduled within one year), yielding a low reported backlog coverage ratio of 7.07% against realized revenues due to practical expedients exempting contracts under 12 months.
Corporate Governance and Capital Structure
Representative Director and President Yoichi Soga maintains voting control over the company. Through his wholly owned holding entity, Soga controls 2,608,000 shares, representing 54.30% of total voting rights. ITOCHU Corporation [TSE: 8001] and Marubeni Corporation [TSE: 8002] each hold 102,000 shares (2.12% each). No cross-shareholdings exist. Soga also owns Seicho Holdings, an outsourced logistics advisory entity, though filings disclose no commercial transactions between Seicho Holdings and the company.
Table EQUITY DILUTION & CAPITAL ALLOCATION PROFILE (As of June 30, 2026)
The 6-member Board of Directors includes two Independent Outside Directors: Professor Kenji Tanaka (University of Tokyo; Compensation Committee Chair) and Junko Takeuchi (energy policy specialist). Non-Executive Director Toma Soga (Professor, University of Electro-Communications) is the biological brother of CEO Yoichi Soga. Executive compensation is paid fully in fixed cash (JPY 85,800k across four inside directors; JPY 17,400k across outside directors and statutory auditors), with no performance-linked cash bonuses. Alignment relies on the 2019 Stock Option Trust, which represents an unexercised share dilution overhang of 9.96% against current shares (478,245 shares exercisable at JPY 128 per share through April 2029).
HDIN Institutional Verdict
The expansion of the Infrastructure Asset Business highlights an operational trade-off: management generated JPY 756,255k in top-line growth at the expense of software-tier unit economics. Consolidated gross margins contracted by 1,332 basis points, capital was tied up in JPY 1,305,345k of unbilled contract assets, and free cash flow turned negative at -JPY 349,009k.
Management met its FY2026 operating margin target (14.73% actual vs. 14.50% guidance) through SG&A overhead discipline rather than project-level profitability. Holding JPY 2,849,627k in idle, unhedged cash reserves (55.49% of assets) limits ROE to 8.40%, down from 21.80% in FY2023. Unless GRID successfully converts completed battery installations into long-term algorithmic operations software under the ReNom suite, the infrastructure pivot risks turning a high-margin AI software business into a capital-intensive engineering contractor.
Presentation Download & Video Access:
- Presentation Download: Click the PDF download link under 'Related Topics' to access the full institutional presentation of this report.
- Video Link: Click this link to watch the HDIN analyst briefing on YouTube.
About HDIN Research:
HDIN Research is a premier global market intelligence and strategic advisory firm specializing in institutional-grade financial analysis, supply chain audits, and macroeconomic forecasting. Our dedicated sector analysts deliver actionable, data-driven insights tailored for private equity, hedge funds, and corporate strategy teams. Visit us at http://www.hdinresearch.com.
2026 AI Transparency Footer:
"This intelligence report was authored by HDIN Research analysts following a rigorous audit of official corporate filings. AI was utilized for massive-scale data synthesis and structural drafting, ensuring 100% inclusion of reported data points. All strategic insights, financial modeling, and final verdicts were verified by our editorial board to ensure professional accuracy and compliance with 2026 Google Search E-E-A-T standards."
1. Top-line revenue increased 51.16% year-over-year to JPY 3,119,079k in FY2026, driven by JPY 756,255k from the new Infrastructure Asset segment, while operating margins fell 603 basis points to 14.73%.
2. Gross margins contracted 1,332 basis points to 60.11% as EPC outsourcing fees surged 422.17% to JPY 608,637k for grid-scale battery projects in Japan.
3. Free cash flow reversed from positive JPY 359,715k to negative JPY 349,009k, pressured by a JPY 664,904k expansion in contract assets, primarily from regional utilities.
Figure GRID Inc Institutional Due Diligence & Financial Architecture
Segment Trajectory and Gross Margin CompressionGRID Inc. [TSE: 5582] altered its financial profile in FY2026 by operationalizing a dual-segment model. The legacy AI Business was augmented by the Infrastructure Asset Business, which was launched in August 2024 (Q4 FY2025) and reported separately in FY2026. Consolidated revenue grew 51.16% year-over-year to JPY 3,119,079k, accelerating past its 4-year compound annual growth rate (CAGR) of 36.05%. However, operating profit expanded by only 7.27% to JPY 459,420k, causing the consolidated operating profit margin (OPM) to decline from 20.76% to 14.73%.
Table CONSOLIDATED FINANCIAL PERFORMANCE BRIDGE (FY2022.6 – FY2026.6)
| Financial Metric (JPY million) | FY2022.6 | FY2023.6 | FY2024.6 | FY2025.6 | FY2026.6 | 4-Year CAGR / Change |
|---|---|---|---|---|---|---|
| Revenue | 910.4 | 1,353.9 | 1,652.1 | 2,063.4 | 3,119.1 | 36.05% |
| • AI Business | 910.4 | 1,353.9 | 1,652.1 | 2,004.1 | 2,362.8 | 26.93% |
| • Infrastructure Asset Business | 0.0 | 0.0 | 0.0 | 59.4 | 756.3 | N/A |
| Gross Profit | N/A | N/A | N/A | 1,515.1 | 1,875.0 | N/A |
| • Gross Margin (%) | N/A | N/A | N/A | 73.43% | 60.11% | -1,332 bps |
| Operating Profit | 67.7* | 204.1* | 344.0* | 428.3 | 459.4 | 62.05% |
| • Operating Margin (%) | 7.43% | 15.08% | 20.82% | 20.76% | 14.73% | -603 bps |
| EBITDA | N/A | N/A | N/A | 479.4 | 529.0 | N/A |
| Ordinary Profit | 67.7 | 204.1 | 344.0 | 428.6 | 466.5 | 62.05% |
| Net Income | 92.0 | 228.5 | 403.8 | 298.3 | 345.1 | 39.18% |
Cost of sales grew 126.90% to JPY 1,244,072k, outpacing top-line expansion and lowering gross margin by 1,332 basis points to 60.11%. This deterioration was driven by manufacturing outsourcing fees, which rose 422.17% from JPY 116,560k to JPY 608,637k due to third-party engineering and construction costs for grid-scale battery storage facilities.
Table COST STRUCTURE & EXPENSE DISSECTION (FY2025.6 vs FY2026.6)
| Operating Cost Line (JPY million) | FY2025.6 | FY2026.6 | YoY Change (%) | FY2026 Revenue Share (%) |
|---|---|---|---|---|
| Manufacturing Outsourcing Fees | 116.6 | 608.6 | +422.17% | 19.51% |
| Manufacturing Labor Cost | 758.8 | 910.3 | +19.96% | 29.18% |
| Total Incurred Manufacturing R&D | 130.9 | 132.5 | +1.22% | 4.25% |
| Selling, General & Administrative (SG&A) | 1,086.8 | 1,415.6 | +30.25% | 45.38% |
| • SG&A Salaries & Allowances | 206.1 | 283.9 | +37.76% | 9.10% |
| • SG&A Technical Administration | 325.5 | 405.1 | +24.44% | 12.99% |
| • Expensed R&D (P&L SG&A) | 142.3 | 144.9 | +1.84% | 4.65% |
| Total Company Personnel Costs | 1,166.0 | 1,427.0 | +22.38% | 45.75% |
| Software License / Cloud Usage Fees | 86.3 | 121.3 | +40.60% | 3.89% |
SG&A efficiency partially balanced the gross margin contraction: total SG&A expenses fell 729 basis points as a percentage of sales, down from 52.67% to 45.38%. This shift masked an underlying reduction in research intensity, as SG&A R&D fell from 6.89% to 4.65% of revenue.
Delivery structure showed divergent trends between software and turnkey hardware projects:
* Flow-Type Revenue: Grew 59.69% to JPY 2,479,933k, increasing from 75.26% to 79.51% of total revenue. Within this, AI system implementation accounted for JPY 1,723,677k (+15.40%), while storage EPC development contributed JPY 756,255k (+1,173.93%).
* Stock-Type Revenue: Maintained 100% within the AI segment, rising 25.22% to JPY 639,146k. Recurring software revenue expanded by 158 basis points to 27.05% of AI segment sales, supported by an average revenue per client of JPY 60,500k (+17.90% YoY) across 39 enterprise accounts.
Table MECE SEGMENT, DELIVERY & DOWNSTREAM VERTICAL MATRIX (FY2026.6)
| Segment / Delivery Model | Downstream Vertical | FY2026 Revenue (JPY million) | YoY Growth (%) | Segment Operating Profit Margin (%) |
|---|---|---|---|---|
| AI: Flow (PoC & Integration) | Power & Energy | 1,166.0 | +18.89% | 35.91% |
| AI: Stock (SaaS & Maintenance) | Power & Energy | 241.1 | +39.87% | 35.91% |
| AI: Flow (PoC & Integration) | Manufacturing & Transport | 173.4 | -42.95% | 35.91% |
| AI: Stock (SaaS & Maintenance) | Manufacturing & Transport | 304.4 | +16.82% | 35.91% |
| AI: Flow (PoC & Integration) | Urban Infrastructure & Transport | 309.2 | +123.37% | 35.91% |
| AI: Stock (SaaS & Maintenance) | Urban Infrastructure & Transport | 93.6 | +20.88% | 35.91% |
| AI: Flow (PoC & Integration) | Other Verticals | 75.1 | +6.28% | 35.91% |
| Infra Asset: Flow (Turnkey EPC) | Battery Storage Facilities | 756.3 | +1,173.93% | 13.26% |
| Infra Asset: Stock (Operations) | Battery Storage Facilities | 0.0 | N/A | N/A |
| Total / Consolidated | All Downstream Sectors | 3,119.1 | +51.16% | 14.73% |
Downstream end-market concentration shifted toward utilities and urban rail networks:
* Power & Energy: JPY 1,407,113k (+22.03% YoY; 45.11% of consolidated revenue), anchored by Kyushu Electric Power Co., Inc. [TSE: 9508], generating JPY 542,147k (17.38% of total sales). Hokkaido Electric Power Co., Inc. [TSE: 9509] contributed JPY 180,872k (5.80% of sales, dropping from 26.67% in FY2025 as major build-outs concluded).
* Infrastructure Asset: JPY 756,255k (24.25% of revenue), driven by A.D.Works Group Co., Ltd. [TSE: 2982], which generated JPY 488,355k (15.66% of total revenue) through a storage facility transfer.
* Manufacturing & Transport: JPY 477,773k (-15.35% YoY; 15.32% of total revenue), reflecting completion of initial rollouts of the ReNom VESSEL routing engine.
* Urban Infrastructure & Transport: JPY 402,849k (+86.60% YoY; 12.92% of revenue), driven by the deployment of the ReNom Railway crew scheduling suite.
* Other Verticals: JPY 75,087k (+6.28% YoY; 2.41% of total revenue).
Infrastructure Footprint and Operational Capacity
All reported revenue (100.0%, or JPY 3,119,079k) was generated inside Japan. In strict accordance with United Nations regional nomenclature, zero sales were recorded from international territories, including Taiwan, Province of China.
Operations and compute deployments are organized as follows:
* Facilities & Engineering Headquarters: In FY2026, the company relocated its central operational base to Kita-Aoyama, Minato-ku, Tokyo (Meiji Yasuda Seimei Aoyama Palacio 4F), investing JPY 221,910k in physical property, plant, and equipment additions alongside JPY 133,990k in lease security deposits.
* Cloud and Computing Architecture: ReNom APPS runs across Amazon Web Services (AWS), Microsoft Azure, and Google Cloud Platform (GCP). To comply with power grid operational regulations, the company maintains air-gapped on-premise server arrays at utility control centers and transit sites. Next-generation high-performance computing (HPC) and quantum combinatorial optimization algorithms are developed under a research initiative funded by the New Energy and Industrial Technology Development Organization (NEDO).
* Workforce Distribution: Total full-time personnel expanded 27.52% from 109 to 139 employees as of June 30, 2026. The technical division employed 93 engineers (+27.40% YoY). The AI Business deployed 102 personnel, the Infrastructure Asset segment employed 11 project managers, and 26 staff handled general administration. Average annual compensation rose 5.10% to JPY 8,883k, while output per employee increased 18.54% to JPY 22,439k.
Working Capital Mechanics and Working Capital Drain
Balance sheet quality showed signs of strain in working capital cycles. Free cash flow shifted to negative JPY 349,009k, down from positive JPY 359,715k in FY2025. Operating cash flow dropped to negative JPY 28,797k, while investing cash outflows reached JPY 320,212k due to headquarters expansion costs.
Table CASH FLOW CONVERSION AUDIT (FY2022.6 – FY2026.6)
| Cash Flow Metric (JPY million) | FY2022.6 | FY2023.6 | FY2024.6 | FY2025.6 | FY2026.6 |
|---|---|---|---|---|---|
| Operating Cash Flow | -55.7 | 150.3 | 285.5 | 406.0 | -28.8 |
| Investing Cash Flow | -103.4 | -36.9 | -37.0 | -46.2 | -320.2 |
| Free Cash Flow (FCF) | -159.1 | 113.4 | 248.5 | 359.7 | -349.0 |
| Financing Cash Flow | -5.4 | -60.1 | 1,980.2 | -62.4 | 0.8 |
| Cash & Cash Equivalents | 618.5 | 671.8 | 2,900.5 | 3,197.8 | 2,849.6 |
Table WORKING CAPITAL AUDIT (FY2022.6 – FY2026.6)
| Working Capital / Balance Sheet Metric | FY2025.6 | FY2026.6 | Variance |
|---|---|---|---|
| Trade Accounts Receivable | 235.4 | 119.1 | -49.40% |
| Contract Assets | 640.4 | 1,305.3 | +103.82% |
| Contract Liabilities (Advances) | 146.9 | 320.1 | +117.86% |
| Days Sales Outstanding (DSO – Combined Basis) | 154.9 days | 166.7 days | +11.8 days |
| Days Inventory Outstanding (DIO) | 29.8 days | 16.1 days | -13.7 days |
| Days Payable Outstanding (DPO) | 13.3 days | 20.2 days | +6.9 days |
| Cash Conversion Cycle (CCC) | 171.5 days | 162.5 days | -9.0 days |
| Current Ratio | 871.60% | 546.51% | -32,509 bps |
| Debt-to-Equity Ratio | 12.12% | 19.65% | +753 bps |
A total of 70.35% of FY2026 consolidated revenue (JPY 2,194,177k) was recognized over time via cost-to-cost or labor-hour progress metrics. The working capital drain was driven by a 103.82% surge in contract assets (unbilled work-in-progress) to JPY 1,305,345k.
Independent auditor A&A Partners classified total estimated project costs on over-time contracts as a Key Audit Matter (KAM). Counterparty exposure for contract assets remains concentrated: Kyushu Electric Power Co., Inc. holds JPY 631,102k (48.35%), Hanshin Electric Railway Co., Ltd. holds JPY 168,696k (12.92%), EREX Co., Ltd. [TSE: 9517] accounts for JPY 148,201k (11.35%), A.D.Works Group Co., Ltd. represents JPY 135,458k (10.38%), and Kansai Electric Power Co., Inc. [TSE: 9503] holds JPY 58,609k (4.49%). No allowance for doubtful accounts was booked.
Formally reported remaining performance obligations dropped 23.54% to JPY 245,510k (with JPY 189,103k scheduled within one year), yielding a low reported backlog coverage ratio of 7.07% against realized revenues due to practical expedients exempting contracts under 12 months.
Corporate Governance and Capital Structure
Representative Director and President Yoichi Soga maintains voting control over the company. Through his wholly owned holding entity, Soga controls 2,608,000 shares, representing 54.30% of total voting rights. ITOCHU Corporation [TSE: 8001] and Marubeni Corporation [TSE: 8002] each hold 102,000 shares (2.12% each). No cross-shareholdings exist. Soga also owns Seicho Holdings, an outsourced logistics advisory entity, though filings disclose no commercial transactions between Seicho Holdings and the company.
Table EQUITY DILUTION & CAPITAL ALLOCATION PROFILE (As of June 30, 2026)
| Capital Component | Volume / Balance | Analytical Weight / Impact |
|---|---|---|
| Basic Issued Common Shares | 4,802,955 shares | 90.94% |
| Unexercised Stock Options (Trust Batch 1) | 478,245 shares | 9.06% |
| Fully Diluted Share Base | 5,281,200 shares | 100.00% |
| Stock Option Strike Price | JPY 128/share | N/A |
| Basic Earnings Per Share (EPS) | JPY 72.37 | N/A |
| Diluted Earnings Per Share (EPS) | JPY 65.67 | -9.26% potential dilution |
| Total Retained Cash & Equivalents | JPY 2,849,627 thousand | 55.49% of Total Assets |
| Unutilized Overdraft Credit Lines | JPY 900,000 thousand | Available through 3 commercial banks |
| Dividend Payout Distribution | JPY 0 | 0.0% (No dividend distribution) |
The 6-member Board of Directors includes two Independent Outside Directors: Professor Kenji Tanaka (University of Tokyo; Compensation Committee Chair) and Junko Takeuchi (energy policy specialist). Non-Executive Director Toma Soga (Professor, University of Electro-Communications) is the biological brother of CEO Yoichi Soga. Executive compensation is paid fully in fixed cash (JPY 85,800k across four inside directors; JPY 17,400k across outside directors and statutory auditors), with no performance-linked cash bonuses. Alignment relies on the 2019 Stock Option Trust, which represents an unexercised share dilution overhang of 9.96% against current shares (478,245 shares exercisable at JPY 128 per share through April 2029).
HDIN Institutional Verdict
The expansion of the Infrastructure Asset Business highlights an operational trade-off: management generated JPY 756,255k in top-line growth at the expense of software-tier unit economics. Consolidated gross margins contracted by 1,332 basis points, capital was tied up in JPY 1,305,345k of unbilled contract assets, and free cash flow turned negative at -JPY 349,009k.
Management met its FY2026 operating margin target (14.73% actual vs. 14.50% guidance) through SG&A overhead discipline rather than project-level profitability. Holding JPY 2,849,627k in idle, unhedged cash reserves (55.49% of assets) limits ROE to 8.40%, down from 21.80% in FY2023. Unless GRID successfully converts completed battery installations into long-term algorithmic operations software under the ReNom suite, the infrastructure pivot risks turning a high-margin AI software business into a capital-intensive engineering contractor.
Presentation Download & Video Access:
- Presentation Download: Click the PDF download link under 'Related Topics' to access the full institutional presentation of this report.
- Video Link: Click this link to watch the HDIN analyst briefing on YouTube.
About HDIN Research:
HDIN Research is a premier global market intelligence and strategic advisory firm specializing in institutional-grade financial analysis, supply chain audits, and macroeconomic forecasting. Our dedicated sector analysts deliver actionable, data-driven insights tailored for private equity, hedge funds, and corporate strategy teams. Visit us at http://www.hdinresearch.com.
2026 AI Transparency Footer:
"This intelligence report was authored by HDIN Research analysts following a rigorous audit of official corporate filings. AI was utilized for massive-scale data synthesis and structural drafting, ensuring 100% inclusion of reported data points. All strategic insights, financial modeling, and final verdicts were verified by our editorial board to ensure professional accuracy and compliance with 2026 Google Search E-E-A-T standards."