Asahi Intecc Co., Ltd.: Southeast Asian Precision Engine Fuels 31.1% Operating Margin as Nanning Buildout Counters China Procurement Headwinds
Date : 2026-10-05
Reading : 155
HDIN Executive Takeaways
1. Record consolidated operating income jumped 50.33% YoY to ¥45,218 million in FY2026, driven by a 277 bps gross margin expansion to 70.45% as direct sales models in the US and Western Europe absorbed fixed clinical distribution costs.
2. Production concentration across Pathum Thani (Thailand), Hanoi (Vietnam), and Cebu (Philippines) anchors 71.1% of the group's 10,177 employees, offsetting domestic wage disparity while the new ¥1,977 million Nanning facility hedges Chinese Volume-Based Procurement (VBP) exposure.
3. Balance sheet risk is contained by a 79.4% equity ratio and ¥57,632 million net cash position, but capital rotation faces friction from 253.4 Days Inventory Outstanding (DIO) and ¥18,363 million in parent loans extended to underperforming subsidiary Toyoflex Cebu.
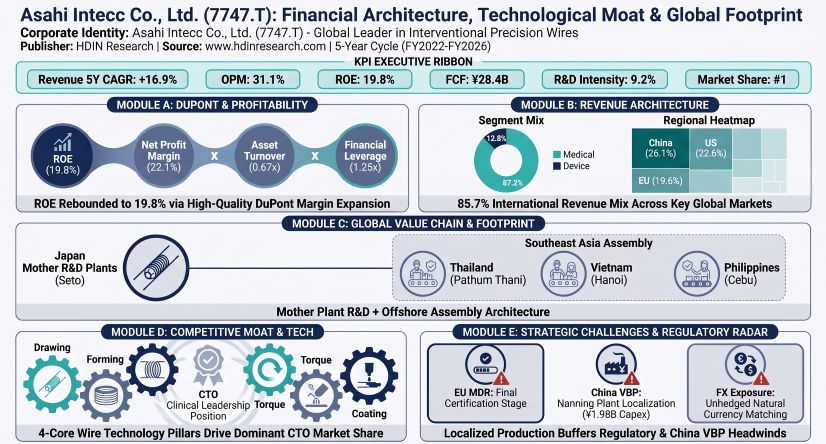
Figure Asahi intecc Financial Architecture, Technological Moat & Global Footprint
Segmental Realities and Operating Leverage
Asahi Intecc Co., Ltd. [TYO: 7747] delivered record consolidated net sales of ¥145,419 million in FY2026 (ended June 30, 2026), representing a 21.16% YoY increase from ¥120,025 million in FY2025. Operating leverage materialized at scale: operating profit accelerated 50.33% YoY to ¥45,218 million, lifting consolidated operating margin by 603 bps from 25.06% to 31.09%. Net profit attributable to owners of the parent expanded 151.82% YoY to ¥32,075 million, unburdened by the ¥9,244 million in non-cash goodwill and intangible impairments recognized during FY2025 across acquired US entities (Pathways Medical Corporation, Rev.1 Engineering Inc., and ASAHI Medical Technologies, Inc.). Impairment write-downs normalized to ¥1,061 million in FY2026.
The Medical Division generated ¥126,798 million in external sales (+17.65% YoY), contributing 87.20% of group revenue and delivering a segment operating margin of 36.43% (¥46,190 million segment profit). Within this division:
* Cardiovascular lines remained the core profit foundation, rising 16.71% YoY to ¥94,778 million (65.18% of group revenue). Flagship Percutaneous Coronary Intervention (PCI) guide wires brought in ¥70,424 million, or 48.43% of total group turnover, underpinned by dominant market positioning in complex Chronic Total Occlusion (CTO) revascularization procedures.
* Non-cardiovascular interventional tools served as the fastest organic growth engine, expanding 28.38% YoY to ¥24,370 million (16.76% of sales). Expansion was driven by peripheral vascular catheters, neurovascular access portfolios (including the SAYA86 radial access guiding catheter and the CHIKAI Nexus Petit 0.006-inch micro guide wire), and gastrointestinal endoscopic devices (CROSSLEAD ES, Caravel S).
* Contract medical device OEM/ODM manufacturing grew 0.75% YoY to ¥7,650 million (5.26% of sales), maintaining manufacturing volume for US medtech partners producing atherectomy systems.
The Device Division recorded external revenue of ¥18,620 million (+52.06% YoY), capturing 12.80% of sales and generating ¥8,485 million in segment profit on ¥35,386 million in total gross segmental revenue (23.98% margin). Medical components expanded 47.89% YoY to ¥11,859 million, boosted by external demand for ACT ONE multi-layer cable tubes, torque coils, and IVUS/OCT sub-assemblies following the consolidation of Nitta Mold Co., Ltd. Industrial components grew 60.00% YoY to ¥6,760 million via precision ultra-fine stainless rope deliveries to automotive, leisure, and surgical robotics clients, including tool units for the ANSUR robotic surgical system. Inter-segment component eliminations totaled ¥16,765 million, reflecting internal component supplies to the Medical Division that secure intellectual property boundaries and input cost controls.
Table CONSOLIDATED SEGMENT FINANCIAL MATRIX
*Note: Device Division margin is calculated on total segmental revenue of ¥35,386 million including internal transfers.
Geographically, overseas sales generated 85.67% of consolidated turnover. China represents the largest single territorial market, delivering ¥37,982 million (26.12% share; 5-year CAGR of 19.70%), supported by logistics partnership sales via Beijing Jiashi Weiye Medical Machinery Co., Ltd., which accounted for ¥17,793 million (12.24% of consolidated sales). Direct commercial operations in North America advanced 21.44% YoY to ¥32,811 million (22.56% share; 5-year CAGR of 15.74%), European operations generated ¥28,449 million (19.56% share; 5-year CAGR of 17.16%), and domestic Japan sales totaled ¥20,844 million (14.33% share; 5-year CAGR of 8.22%). Rest of World territories closed at ¥25,332 million (17.42% share; 5-year CAGR of 17.82%).
SG&A costs rose 11.87% YoY to ¥57,228 million, but SG&A-to-sales efficiency improved by 327 bps to 39.35%. Fixed direct sales expansion in the US, France, Germany, and Italy drove personnel compensation up 14.44% YoY to ¥14,792 million, while bonus provisions grew 32.72% to ¥1,935 million. Transpacific air-freight rates lifted distribution expenses 18.51% to ¥3,495 million. All internal R&D was expensed immediately under SG&A under Japanese GAAP, totaling ¥13,372 million (9.20% of sales), insulating the balance sheet from intangible development asset capitalization risk. Human capital productivity showed strong operating leverage: revenue per employee advanced from ¥7.45 million in FY2022 to ¥14.29 million in FY2026 (+91.81%), while operating income per employee climbed from ¥1.56 million to ¥4.44 million (+184.62%) over the same period across an aggregate headcount of 10,177.
Table GEOGRAPHIC REVENUE & EXPANSION TRAJECTORY
Table 5-YEAR FINANCIAL DECOMPOSITION & BALANCE SHEET
Infrastructure Layout and Regional Moats
Asahi Intecc operates an integrated "Mother Factory + Low-Cost Offshore Manufacturing Hub" model designed to protect precision metallurgical intellectual property while controlling unit assembly costs.
Upstream operations, tool engineering, custom diamond-die fabrication, cleanroom R&D, and primary raw wire-drawing reside across domestic Japanese facilities:
* Global HQ & Seto Mother Factory (Seto, Aichi Prefecture): Book value of ¥14,672 million (Medical: ¥10,620 million; Corporate: ¥4,052 million) with 690 personnel (581 Medical, 109 Corporate).
* Specialized Regional R&D Centers (Osaka, Shizuoka, Tohoku, Tokyo): Book value of ¥9,425 million (Osaka: ¥4,833 million; Shizuoka: ¥3,181 million; Tohoku: ¥1,411 million) with 312 dedicated researchers (Osaka: 154, Shizuoka: 101, Tohoku: 57). A ¥1,735 million building addition to the Shizuoka R&D facility was capitalized in FY2026 to scale resin compounding and precision molding operations.
Intermediate wire assemblies and proprietary ACT ONE cable tubing are transferred to primary assembly hubs in Southeast Asia:
* Asahi Intecc Thailand Co., Ltd. (Pathum Thani, Thailand): Book value of ¥11,883 million (Medical: ¥5,835 million; Device: ¥6,048 million), housing 3,430 employees (1,854 Medical, 1,576 Device). Serves as the primary finished catheter assembly and automated wire coiling hub.
* Asahi Intecc Hanoi Co., Ltd. (Hanoi, Vietnam): Book value of ¥2,932 million, operating with 1,719 personnel dedicated to microcatheter braiding, guide wire assembly, and multi-tier cleanroom packaging.
* Toyoflex Cebu Corporation (Cebu, Philippines): Book value of ¥7,236 million (Medical: ¥3,745 million; Device: ¥3,491 million), fielding 2,090 employees focused on stainless micro-rope stranding and sub-assembly components.
Table PHYSICAL ASSET & FACILITY ALLOCATION
To counter structural Average Selling Price (ASP) erosion from Chinese Volume-Based Procurement (VBP) mandates and protect its 26.12% regional revenue exposure, Asahi Intecc established ASAHI INTECC MEDICAL NANNING Co., Ltd. in Guangxi in April 2025. Total Capex is budgeted at ¥1,977 million, with ¥911 million deployed as of June 30, 2026. Construction runs from July 2025 to June 2027, with full commercial operation slated for December 2030 to establish domestic qualification status within Chinese hospital procurement systems.
Logistical risk mitigation is reflected in group working capital buffers. Balance sheet inventories rose 21.02% in FY2026 to ¥29,833 million:
* Merchandise and finished goods: ¥10,111 million (vs. ¥9,408 million in FY2025).
* Work-in-progress (WIP): ¥10,482 million (vs. ¥8,785 million in FY2025).
* Raw materials and supplies: ¥9,240 million (vs. ¥6,458 million in FY2025).
The raw material buffer provides strategic operational coverage against single-source procurement vulnerabilities in non-substitutable platinum (used in radiopaque fluoroscopy marker bands), super-elastic Nitinol alloy wire, and specialized fluororesin chemistries.
Table MACRO ELEMENT & FX STRESS PROFILES
HDIN Institutional Verdict
Asahi Intecc presents a highly cash-generative interventional engineering profile. Free cash flow surged from negative ¥1,401 million in FY2022 to positive ¥28,356 million in FY2026. Management has paired this cash generation with shareholder capital returns, elevating dividends per share by 32.1% CAGR to ¥48.24 (¥12,799 million payout, incorporating a ¥6.03 50th-anniversary bonus), while repurchasing ¥10,553 million in common stock (4,344,600 shares) and canceling 6,301,300 treasury shares. Management revised its FY2030 "Building the Future 2030" plan upward on August 14, 2026, targeting ¥212.5 billion in net sales, a 32.0% operating margin, an ROE of at least 20.0%, and an ROIC of at least 19.0%.
However, institutional analysis reveals three critical operational and governance frictions:
1. Operational Exposure to Unhedged Currency Movements: Asahi Intecc maintains zero derivative or FX forward contracts, leaving ¥124,575 million in international revenue exposed to natural hedging. While JPY weakness supported FY2026 sales (+¥1,454 million) and gross margins (+¥1,024 million), a simultaneous appreciation of the JPY against the USD alongside a stronger Thai Baht (which drives operating costs across 3,430 assembly staff in Pathum Thani) creates a negative currency scissors effect. Each 1% strengthening of the THB against the JPY reduces operating profit by up to ¥160 million.
2. Parent Standalone Asset Risk at Toyoflex Cebu: Independent auditor Deloitte Touche Tohmatsu identified parent loans extended to TOYOFLEX CEBU CORPORATION as a Key Audit Matter (KAM). Standalone parent loans to this Philippine subsidiary stand at ¥18,363 million (¥15,850 million short-term; ¥2,513 million long-term), against which management carries an allowance for doubtful accounts of ¥1,239 million due to past capacity utilization shortfalls. Continued volatility at this facility could require non-cash balance sheet impairments on the parent company's standalone ledger.
3. Governance Alignment and Founder Advisory Retainers: Executive director equity-based incentives represent only 5.4% of total compensation (¥33 million out of ¥627 million), while short-term cash bonuses account for 38.6% (¥242 million), skewing executive motivation toward annual targets over long-term per-share value creation. Furthermore, related-party advisory disbursements of ¥36 million to the founding patriarch (Miyata Naohiko) persist outside standard board structures, presenting an ongoing friction point for institutional proxy allocators.
Presentation Download & Video Access:
- Presentation Download: Click the PDF download link under 'Related Topics' to access the full institutional presentation of this report.
- Video Link: Click this link to watch the HDIN analyst briefing on YouTube.
About HDIN Research:
HDIN Research is a premier global market intelligence and strategic advisory firm specializing in institutional-grade financial analysis, supply chain audits, and macroeconomic forecasting. Our dedicated sector analysts deliver actionable, data-driven insights tailored for private equity, hedge funds, and corporate strategy teams. Visit us at http://www.hdinresearch.com.
2026 AI Transparency Footer:
This intelligence report was authored by HDIN Research analysts following a rigorous audit of official corporate filings. AI was utilized for massive-scale data synthesis and structural drafting, ensuring 100% inclusion of reported data points. All strategic insights, financial modeling, and final verdicts were verified by our editorial board to ensure professional accuracy and compliance with 2026 Google Search E-E-A-T standards.
1. Record consolidated operating income jumped 50.33% YoY to ¥45,218 million in FY2026, driven by a 277 bps gross margin expansion to 70.45% as direct sales models in the US and Western Europe absorbed fixed clinical distribution costs.
2. Production concentration across Pathum Thani (Thailand), Hanoi (Vietnam), and Cebu (Philippines) anchors 71.1% of the group's 10,177 employees, offsetting domestic wage disparity while the new ¥1,977 million Nanning facility hedges Chinese Volume-Based Procurement (VBP) exposure.
3. Balance sheet risk is contained by a 79.4% equity ratio and ¥57,632 million net cash position, but capital rotation faces friction from 253.4 Days Inventory Outstanding (DIO) and ¥18,363 million in parent loans extended to underperforming subsidiary Toyoflex Cebu.
Figure Asahi intecc Financial Architecture, Technological Moat & Global Footprint
Segmental Realities and Operating Leverage
Asahi Intecc Co., Ltd. [TYO: 7747] delivered record consolidated net sales of ¥145,419 million in FY2026 (ended June 30, 2026), representing a 21.16% YoY increase from ¥120,025 million in FY2025. Operating leverage materialized at scale: operating profit accelerated 50.33% YoY to ¥45,218 million, lifting consolidated operating margin by 603 bps from 25.06% to 31.09%. Net profit attributable to owners of the parent expanded 151.82% YoY to ¥32,075 million, unburdened by the ¥9,244 million in non-cash goodwill and intangible impairments recognized during FY2025 across acquired US entities (Pathways Medical Corporation, Rev.1 Engineering Inc., and ASAHI Medical Technologies, Inc.). Impairment write-downs normalized to ¥1,061 million in FY2026.
The Medical Division generated ¥126,798 million in external sales (+17.65% YoY), contributing 87.20% of group revenue and delivering a segment operating margin of 36.43% (¥46,190 million segment profit). Within this division:
* Cardiovascular lines remained the core profit foundation, rising 16.71% YoY to ¥94,778 million (65.18% of group revenue). Flagship Percutaneous Coronary Intervention (PCI) guide wires brought in ¥70,424 million, or 48.43% of total group turnover, underpinned by dominant market positioning in complex Chronic Total Occlusion (CTO) revascularization procedures.
* Non-cardiovascular interventional tools served as the fastest organic growth engine, expanding 28.38% YoY to ¥24,370 million (16.76% of sales). Expansion was driven by peripheral vascular catheters, neurovascular access portfolios (including the SAYA86 radial access guiding catheter and the CHIKAI Nexus Petit 0.006-inch micro guide wire), and gastrointestinal endoscopic devices (CROSSLEAD ES, Caravel S).
* Contract medical device OEM/ODM manufacturing grew 0.75% YoY to ¥7,650 million (5.26% of sales), maintaining manufacturing volume for US medtech partners producing atherectomy systems.
The Device Division recorded external revenue of ¥18,620 million (+52.06% YoY), capturing 12.80% of sales and generating ¥8,485 million in segment profit on ¥35,386 million in total gross segmental revenue (23.98% margin). Medical components expanded 47.89% YoY to ¥11,859 million, boosted by external demand for ACT ONE multi-layer cable tubes, torque coils, and IVUS/OCT sub-assemblies following the consolidation of Nitta Mold Co., Ltd. Industrial components grew 60.00% YoY to ¥6,760 million via precision ultra-fine stainless rope deliveries to automotive, leisure, and surgical robotics clients, including tool units for the ANSUR robotic surgical system. Inter-segment component eliminations totaled ¥16,765 million, reflecting internal component supplies to the Medical Division that secure intellectual property boundaries and input cost controls.
Table CONSOLIDATED SEGMENT FINANCIAL MATRIX
| Reporting Segment / Division | FY2025 Sales (JPY million) | FY2026 Sales (JPY million) | YoY Growth (%) | Sales Share (%) | Segment Margin (%) |
|---|---|---|---|---|---|
| Medical Division | 107,779 | 126,798 | +17.65% | 87.20% | 36.43% |
| • Cardiovascular | 81,202 | 94,778 | +16.71% | 65.18% | — |
| • Non-cardiovascular | 18,983 | 24,370 | +28.38% | 16.76% | — |
| • OEM/ODM Finished Devices | 7,593 | 7,650 | +0.75% | 5.26% | — |
| Device Division (External) | 12,245 | 18,620 | +52.06% | 12.80% | 23.98%* |
| • Medical Components | 8,019 | 11,859 | +47.89% | 8.16% | — |
| • Industrial Components | 4,226 | 6,760 | +60.00% | 4.65% | — |
| Inter-segment Elimination | △14,151 | △16,765 | — | — | — |
| Consolidated Group Total | 120,025 | 145,419 | +21.16% | 100.00% | 31.09% |
Geographically, overseas sales generated 85.67% of consolidated turnover. China represents the largest single territorial market, delivering ¥37,982 million (26.12% share; 5-year CAGR of 19.70%), supported by logistics partnership sales via Beijing Jiashi Weiye Medical Machinery Co., Ltd., which accounted for ¥17,793 million (12.24% of consolidated sales). Direct commercial operations in North America advanced 21.44% YoY to ¥32,811 million (22.56% share; 5-year CAGR of 15.74%), European operations generated ¥28,449 million (19.56% share; 5-year CAGR of 17.16%), and domestic Japan sales totaled ¥20,844 million (14.33% share; 5-year CAGR of 8.22%). Rest of World territories closed at ¥25,332 million (17.42% share; 5-year CAGR of 17.82%).
SG&A costs rose 11.87% YoY to ¥57,228 million, but SG&A-to-sales efficiency improved by 327 bps to 39.35%. Fixed direct sales expansion in the US, France, Germany, and Italy drove personnel compensation up 14.44% YoY to ¥14,792 million, while bonus provisions grew 32.72% to ¥1,935 million. Transpacific air-freight rates lifted distribution expenses 18.51% to ¥3,495 million. All internal R&D was expensed immediately under SG&A under Japanese GAAP, totaling ¥13,372 million (9.20% of sales), insulating the balance sheet from intangible development asset capitalization risk. Human capital productivity showed strong operating leverage: revenue per employee advanced from ¥7.45 million in FY2022 to ¥14.29 million in FY2026 (+91.81%), while operating income per employee climbed from ¥1.56 million to ¥4.44 million (+184.62%) over the same period across an aggregate headcount of 10,177.
Table GEOGRAPHIC REVENUE & EXPANSION TRAJECTORY
| Market (UN Standard) | FY2022 (JPY million) | FY2023 (JPY million) | FY2024 (JPY million) | FY2025 (JPY million) | FY2026 (JPY million) | 5-Year CAGR | FY2026 Share (%) |
|---|---|---|---|---|---|---|---|
| China | 18,500 | 21,800 | 28,100 | 28,823 | 37,982 | +19.70% | 26.12% |
| North America (USA) | 15,800 | 19,200 | 22,500 | 27,018 | 32,811 | +15.74% | 22.56% |
| Europe | 15,100 | 18,000 | 21,800 | 24,645 | 28,449 | +17.16% | 19.56% |
| Japan (Domestic) | 15,200 | 16,100 | 17,200 | 18,880 | 20,844 | +8.22% | 14.33% |
| Rest of World | 13,148 | 15,001 | 17,947 | 20,658 | 25,332 | +17.82% | 17.42% |
| Consolidated Total | 77,748 | 90,101 | 107,547 | 120,025 | 145,419 | +16.94% | 100.00% |
Table 5-YEAR FINANCIAL DECOMPOSITION & BALANCE SHEET
| Metric / Financial Item | FY2022.6 | FY2023.6 | FY2024.6 | FY2025.6 | FY2026.6 |
|---|---|---|---|---|---|
| Return on Equity (ROE) | 10.20% | 10.40% | 11.20% | 8.40% | 19.80% |
| • Net Profit Margin | 13.96% | 14.55% | 14.70% | 10.61% | 22.06% |
| • Asset Turnover (x) | 0.50x | 0.52x | 0.56x | 0.62x | 0.67x |
| • Equity Multiplier (x) | 1.28x | 1.29x | 1.26x | 1.28x | 1.25x |
| Equity Ratio (%) | 77.00% | 76.60% | 78.90% | 77.90% | 79.40% |
| Operating Cash Flow (OCF, JPY million) | 17,302 | 19,138 | 34,708 | 40,543 | 40,095 |
| Free Cash Flow (FCF, JPY million) | △1,401 | 4,003 | 13,486 | 27,109 | 28,356 |
| Days Inventory Outstanding (DIO) | 230.0 days | 235.0 days | 240.0 days | 231.9 days | 253.4 days |
| Days Sales Outstanding (DSO) | 52.0 days | 53.0 days | 54.0 days | 54.1 days | 52.7 days |
| Cash Conversion Cycle (CCC) | 252.0 days | 258.0 days | 263.0 days | 257.0 days | 256.0 days |
| Net Cash Position (Cash Less Debt, JPY million) | +21,821 | +24,884 | +24,658 | +44,180 | +57,632 |
Infrastructure Layout and Regional Moats
Asahi Intecc operates an integrated "Mother Factory + Low-Cost Offshore Manufacturing Hub" model designed to protect precision metallurgical intellectual property while controlling unit assembly costs.
Upstream operations, tool engineering, custom diamond-die fabrication, cleanroom R&D, and primary raw wire-drawing reside across domestic Japanese facilities:
* Global HQ & Seto Mother Factory (Seto, Aichi Prefecture): Book value of ¥14,672 million (Medical: ¥10,620 million; Corporate: ¥4,052 million) with 690 personnel (581 Medical, 109 Corporate).
* Specialized Regional R&D Centers (Osaka, Shizuoka, Tohoku, Tokyo): Book value of ¥9,425 million (Osaka: ¥4,833 million; Shizuoka: ¥3,181 million; Tohoku: ¥1,411 million) with 312 dedicated researchers (Osaka: 154, Shizuoka: 101, Tohoku: 57). A ¥1,735 million building addition to the Shizuoka R&D facility was capitalized in FY2026 to scale resin compounding and precision molding operations.
Intermediate wire assemblies and proprietary ACT ONE cable tubing are transferred to primary assembly hubs in Southeast Asia:
* Asahi Intecc Thailand Co., Ltd. (Pathum Thani, Thailand): Book value of ¥11,883 million (Medical: ¥5,835 million; Device: ¥6,048 million), housing 3,430 employees (1,854 Medical, 1,576 Device). Serves as the primary finished catheter assembly and automated wire coiling hub.
* Asahi Intecc Hanoi Co., Ltd. (Hanoi, Vietnam): Book value of ¥2,932 million, operating with 1,719 personnel dedicated to microcatheter braiding, guide wire assembly, and multi-tier cleanroom packaging.
* Toyoflex Cebu Corporation (Cebu, Philippines): Book value of ¥7,236 million (Medical: ¥3,745 million; Device: ¥3,491 million), fielding 2,090 employees focused on stainless micro-rope stranding and sub-assembly components.
Table PHYSICAL ASSET & FACILITY ALLOCATION
| Facility / Entity Location | Tangible Fixed Assets (Book Value) | Personnel | Strategic Function |
|---|---|---|---|
| Seto Headquarters & Mother Factory (Japan) | ¥14,672 million (Medical: ¥10.6B; Corporate: ¥4.1B) | 690 | Core drawing technology, tooling, and intellectual property development |
| Shizuoka, Osaka & Tohoku R&D Facilities (Japan) | ¥9,425 million (Osaka: ¥4.8B; Shizuoka: ¥3.2B) | 312 | Resin development, molding technology, and robotics capabilities |
| Pathum Thani Facility (Thailand) | ¥11,883 million (Medical: ¥5.8B; Development: ¥6.0B) | 3,430 | High-volume assembly and cleanroom manufacturing |
| Hanoi Plant (Vietnam) | ¥2,932 million (Medical Segment) | 1,719 | Microcatheter production and business continuity planning (BCP) base |
| Cebu Plant (Philippines) | ¥7,236 million (Medical: ¥3.7B; Development: ¥3.5B) | 2,090 | Industrial and medical rope manufacturing operations |
| Nanning Plant (Guangxi, China) | ¥911 million paid (¥1,977 million planned investment) | Pre-operational | Value-based procurement (VBP) hedge and localized tendering strategy |
To counter structural Average Selling Price (ASP) erosion from Chinese Volume-Based Procurement (VBP) mandates and protect its 26.12% regional revenue exposure, Asahi Intecc established ASAHI INTECC MEDICAL NANNING Co., Ltd. in Guangxi in April 2025. Total Capex is budgeted at ¥1,977 million, with ¥911 million deployed as of June 30, 2026. Construction runs from July 2025 to June 2027, with full commercial operation slated for December 2030 to establish domestic qualification status within Chinese hospital procurement systems.
Logistical risk mitigation is reflected in group working capital buffers. Balance sheet inventories rose 21.02% in FY2026 to ¥29,833 million:
* Merchandise and finished goods: ¥10,111 million (vs. ¥9,408 million in FY2025).
* Work-in-progress (WIP): ¥10,482 million (vs. ¥8,785 million in FY2025).
* Raw materials and supplies: ¥9,240 million (vs. ¥6,458 million in FY2025).
The raw material buffer provides strategic operational coverage against single-source procurement vulnerabilities in non-substitutable platinum (used in radiopaque fluoroscopy marker bands), super-elastic Nitinol alloy wire, and specialized fluororesin chemistries.
Table MACRO ELEMENT & FX STRESS PROFILES
| Factor / Variable | Actual FY2026 Rate | FY2027 Baseline Rate | Operating Income Impact (±1% Variation) |
|---|---|---|---|
| USD / JPY Exchange Rate | 154.45 JPY | 155.00 JPY | Approximately ±¥350 million–¥420 million per +1% JPY depreciation |
| EUR / JPY Exchange Rate | 180.11 JPY | 179.00 JPY | Approximately ±¥220 million–¥280 million per +1% JPY depreciation |
| RMB / JPY Exchange Rate | 22.10 JPY | 22.00 JPY | Approximately ±¥250 million–¥300 million per +1% JPY depreciation |
| THB / JPY Exchange Rate | 4.80 JPY | 4.90 JPY | Approximately ∓¥120 million–¥160 million per +1% THB appreciation |
| Metal Price Shock | Spot Price Volatility | Elevated Price Index | Approximately ∓¥150 million–¥200 million per +5% platinum price increase |
HDIN Institutional Verdict
Asahi Intecc presents a highly cash-generative interventional engineering profile. Free cash flow surged from negative ¥1,401 million in FY2022 to positive ¥28,356 million in FY2026. Management has paired this cash generation with shareholder capital returns, elevating dividends per share by 32.1% CAGR to ¥48.24 (¥12,799 million payout, incorporating a ¥6.03 50th-anniversary bonus), while repurchasing ¥10,553 million in common stock (4,344,600 shares) and canceling 6,301,300 treasury shares. Management revised its FY2030 "Building the Future 2030" plan upward on August 14, 2026, targeting ¥212.5 billion in net sales, a 32.0% operating margin, an ROE of at least 20.0%, and an ROIC of at least 19.0%.
However, institutional analysis reveals three critical operational and governance frictions:
1. Operational Exposure to Unhedged Currency Movements: Asahi Intecc maintains zero derivative or FX forward contracts, leaving ¥124,575 million in international revenue exposed to natural hedging. While JPY weakness supported FY2026 sales (+¥1,454 million) and gross margins (+¥1,024 million), a simultaneous appreciation of the JPY against the USD alongside a stronger Thai Baht (which drives operating costs across 3,430 assembly staff in Pathum Thani) creates a negative currency scissors effect. Each 1% strengthening of the THB against the JPY reduces operating profit by up to ¥160 million.
2. Parent Standalone Asset Risk at Toyoflex Cebu: Independent auditor Deloitte Touche Tohmatsu identified parent loans extended to TOYOFLEX CEBU CORPORATION as a Key Audit Matter (KAM). Standalone parent loans to this Philippine subsidiary stand at ¥18,363 million (¥15,850 million short-term; ¥2,513 million long-term), against which management carries an allowance for doubtful accounts of ¥1,239 million due to past capacity utilization shortfalls. Continued volatility at this facility could require non-cash balance sheet impairments on the parent company's standalone ledger.
3. Governance Alignment and Founder Advisory Retainers: Executive director equity-based incentives represent only 5.4% of total compensation (¥33 million out of ¥627 million), while short-term cash bonuses account for 38.6% (¥242 million), skewing executive motivation toward annual targets over long-term per-share value creation. Furthermore, related-party advisory disbursements of ¥36 million to the founding patriarch (Miyata Naohiko) persist outside standard board structures, presenting an ongoing friction point for institutional proxy allocators.
Presentation Download & Video Access:
- Presentation Download: Click the PDF download link under 'Related Topics' to access the full institutional presentation of this report.
- Video Link: Click this link to watch the HDIN analyst briefing on YouTube.
About HDIN Research:
HDIN Research is a premier global market intelligence and strategic advisory firm specializing in institutional-grade financial analysis, supply chain audits, and macroeconomic forecasting. Our dedicated sector analysts deliver actionable, data-driven insights tailored for private equity, hedge funds, and corporate strategy teams. Visit us at http://www.hdinresearch.com.
2026 AI Transparency Footer:
This intelligence report was authored by HDIN Research analysts following a rigorous audit of official corporate filings. AI was utilized for massive-scale data synthesis and structural drafting, ensuring 100% inclusion of reported data points. All strategic insights, financial modeling, and final verdicts were verified by our editorial board to ensure professional accuracy and compliance with 2026 Google Search E-E-A-T standards.