Furuya Metal Co., Ltd.: Sputtering Target Margin Expands to 52.6% in Tsukuba-Led AI Expansion as PGM Working Capital Optimization Frees 11.82 Billion JPY in Cash Flow
Date : 2026-10-06
Reading : 367
HDIN Executive Takeaways
1. Furuya Metal Co., Ltd. [TYO: 7826] expanded FY2026 revenue 74.52% YoY to 100,139 million JPY, surpassing its FY2030 Ordinary Income target four years early at 24,664 million JPY.
2. Heat-Assisted Magnetic Recording (HAMR) Ruthenium target demand pushed Thin Film operating margins up 1,444 basis points to 52.64%, while client concentration in De Nora Group dropped from 31.3% to 15.2%.
3. Operating cash flow of 15,763 million JPY enabled full elimination of 13,400 million JPY in short-term debt, lowering the interest-bearing debt ratio to 9.7% against 74,580 million JPY in PGM inventory exposure.
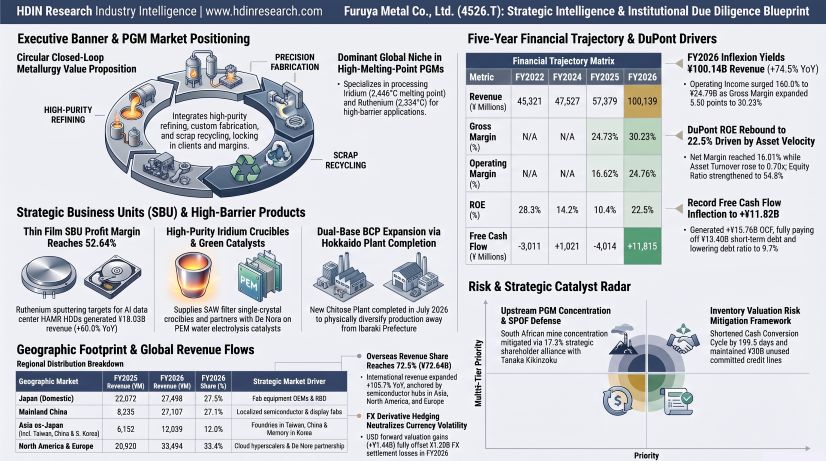
Figure Furuya Metal Strategic Intelligence & Institutional Due Diligence Blueprint
 Operating Leverage and Segmental Earnings Expansion
Furuya Metal Co., Ltd. experienced an operational inflection during FY2026 (Term 58, ended June 30, 2026), ending a cyclical trough that compressed earnings across FY2024 and FY2025. Consolidated revenue rose 74.52% YoY to 100,139 million JPY, posting a five-year Compound Annual Growth Rate (CAGR) of 21.92% from 45,321 million JPY in FY2022. Gross profit grew 113.36% YoY to 30,272 million JPY, expanding gross margin by 550 basis points to 30.23%. Operating income increased 159.95% YoY to 24,794 million JPY, driving operating margin up 814 basis points to 24.76%. Ordinary income climbed 162.70% YoY to 24,664 million JPY, while net income rose 147.90% YoY to 16,034 million JPY.
Table Consolidated Financial Performance (FY2022–FY2026)
Segment reporting across Furuya Metal Co., Ltd.’s five specialized operational units and secondary inventory management activities demonstrates divergence in pricing power and capital intensity:
* Thin Film: Revenue rose 60.00% YoY from 11,271 million JPY to 18,034 million JPY. Operating profit surged 120.53% YoY from 4,305 million JPY to 9,494 million JPY, yielding a segment margin of 52.64% (up 1,444 bps from 38.20%). The unit contributed 31.36% of consolidated operating profit, driven by high-purity (>99.99%) Ruthenium sputtering targets for Heat-Assisted Magnetic Recording (HAMR) hard disk drives deployed in AI cloud datacenters.
* Electronics: Revenue expanded 83.05% YoY from 5,904 million JPY to 10,807 million JPY (10.79% revenue share). Segment profit rose 94.39% YoY from 1,729 million JPY to 3,361 million JPY, with margins expanding 182 bps to 31.10%, supported by demand for high-purity Iridium crucibles (melting point 2,446°C) for lithium tantalate/niobate (LT/LN) SAW filter crystal growth and medical PET/CT scintillator crystals, alongside optical isolators.
* Thermal: Revenue climbed 37.61% YoY from 4,860 million JPY to 6,688 million JPY. Operating profit increased 50.26% YoY from 1,548 million JPY to 2,326 million JPY, moving margins up 293 bps to 34.78% due to fab equipment utilization recoveries driving sensor probe replacements.
* Fine Chemical & Recycle: Revenue grew 5.21% YoY from 26,328 million JPY to 27,701 million JPY. Segment profit rose 41.85% YoY from 6,458 million JPY to 9,161 million JPY, lifting segment margins by 854 bps to 33.07%. Earnings absorbed a 2,849 million JPY one-off quality-related loss associated with refining operations.
* Supply Chain Support: Revenue advanced 148.84% YoY from 7,653 million JPY to 19,044 million JPY, with segment profit expanding from 40 million JPY to 2,331 million JPY (+5,727.50% YoY). Operating margin reached 12.24% (up 1,172 bps from 0.52%) on physical pass-through trading of PGM raw materials tied to customer contract volumes.
* Others: Revenue grew 1,212.49% YoY from 1,361 million JPY to 17,863 million JPY, generating 3,597 million JPY in operating profit (up 3,325.71% YoY from 105 million JPY). Management executed PGM inventory rebalancing transactions that yielded 16,558 million JPY in sales and 3,270 million JPY in operating gains.
Table Segment Financial Breakdown (FY2025 vs. FY2026)
Cash flow conversion shifted into operational surplus in FY2026. Operating cash flow reached 15,763 million JPY (up from 921 million JPY in FY2025, -461 million JPY in FY2023, and -1,225 million JPY in FY2022). Investing cash outflows totaled 3,948 million JPY, yielding 11,815 million JPY in Free Cash Flow (FCF), reversing the negative FCF of 4,014 million JPY in FY2025, 2,789 million JPY in FY2023, and 3,011 million JPY in FY2022. Financing cash flow registered an outflow of 17,290 million JPY as the group cleared 13,400 million JPY in short-term bank borrowings and disbursed 2,360 million JPY in financing cash dividends (total FY2026 dividend distribution of 4,058 million JPY). Tangible fixed asset capital expenditures totaled 3,010 million JPY against depreciation of 1,277 million JPY (compared to 3,909 million JPY capex and 1,289 million JPY depreciation in FY2025).
Working capital velocity improved despite elevated raw material carry. Accounts receivable rose from 3,594 million JPY to 7,641 million JPY (+4,047 million JPY), expanding Days Sales Outstanding (DSO) from 22.8 days to 27.8 days (+5.0 days). Consolidated inventories grew from 82,394 million JPY to 91,931 million JPY (+9,537 million JPY), consisting of 74,580 million JPY in raw materials and supplies (52.17% of total assets and 81.13% of inventory), 9,791 million JPY in merchandise/finished goods, and 7,558 million JPY in work-in-process (WIP). Days Inventory Outstanding (DIO) fell 215.8 days from 696.1 days to 480.3 days. Accounts payable expanded from 22,343 million JPY to 33,975 million JPY (+11,632 million JPY), adjusting Days Payables Outstanding (DPO) from 188.8 days to 177.5 days (-11.3 days). Consequently, the Cash Conversion Cycle (CCC) contracted by 199.5 days from 530.1 days to 330.6 days.
Manufacturing Network and Geographic Footprint
Furuya Metal Co., Ltd.’s industrial operations are concentrated in three domestic production facilities supported by corporate headquarters in Toshima-ku, Tokyo (tangible book value of 21 million JPY, buildings 9 million JPY, workforce of 93 regular and 4 temporary employees). Consolidated tangible fixed assets stood at 21,850 million JPY, with net book value of identified sites totaling 16,857 million JPY (buildings 3,984 million JPY, machinery 9,781 million JPY, land 3,009 million JPY) across 448 regular and 137 temporary employees:
Table Operational Manufacturing Network (As of June 30, 2026)
Facility capital deployment totaled 3,786 million JPY in FY2026. The group allocated 1,974 million JPY to Construction in Progress for the New Chitose Plant, which completed construction in July 2026 to mitigate seismic operational exposure concentrated in Ibaraki Prefecture. Upgrades to dry and wet PGM refining circuits at the Tsuchiura Plant absorbed 1,243 million JPY, while Tsukuba automated fabrication cells to expand unit output density.
International shipments generated 72.54% of consolidated revenue (72,640 million JPY), expanding 105.74% YoY from 35,307 million JPY (61.53% share) in FY2025. Domestic Japanese revenue rose 24.59% YoY to 27,498 million JPY (27.46% share). Mainland China (including Hong Kong) expanded 229.17% YoY from 8,235 million JPY to 27,107 million JPY (27.07% share), supported by Furuya Non-ferrous Metals (Shanghai) Co., Ltd. (wholly owned, capital 276 million JPY). Asia ex-Japan (excluding Mainland China) rose 95.70% YoY from 6,152 million JPY to 12,039 million JPY (12.02% share), serving foundries in Taiwan, China and memory makers in South Korea via Korea Furuya Metal Co., Ltd. (wholly owned, capital 29 million KRW/JPY equivalent). North America generated 14,101 million JPY (+55.33% YoY, 14.08% share), with the United States accounting for 13,179 million JPY (+47.75% YoY, 13.16% share), supported by Furuya Metal America, Inc. (wholly owned, capital 59 million JPY) in Manchester, New Hampshire. European revenue rose 63.77% YoY to 19,393 million JPY (19.37% share), led by Germany at 11,229 million JPY (+19.61% YoY, 11.21% share). Auxiliary bullion recycling is managed via Furuya Eco-Front Technology Co., Ltd. (60% owned joint venture with Valterra Platinum / Anglo Platinum Marketing Limited, capital 250 million JPY).
Table Geographic Revenue Matrix (FY2025 vs. FY2026)
Foreign exchange exposure linked to USD-denominated raw material procurement and international sales was managed via forward contracts governed by corporate derivative regulations. At FY2026 year-end, open OTC forward contracts included 22,226 million JPY in USD buy positions (fair value gain of 1,352 million JPY) and 2,246 million JPY in USD sell positions (fair value loss of 37 million JPY), yielding a net balance sheet asset fair value of 1,314 million JPY (up from a net liability fair value of 124 million JPY on 20,955 million JPY in buy positions in FY2025). On the P&L, non-operating foreign exchange losses of 1,204 million JPY were offset by 1,439 million JPY in derivative valuation gains, delivering a net positive non-operating currency contribution of 235 million JPY (reversing the FY2025 derivative valuation loss of 1,719 million JPY).
Forensic Audit, Single-Point Vulnerabilities, and Institutional Verdict
Auditing corporate disclosures reveals structural concentrations and raw material dependencies that counterbalance management’s growth narrative:
Table Single-Point Vulnerability (SPOF) Audit
Taiyo Limited Liability Audit Corporation identified the valuation of inventories (specifically the 74,580 million JPY raw material stock) as the sole Key Audit Matter (KAM). Inventory costing utilizes the gross average method for raw materials, while finished goods separate material costs (gross average) from fabrication costs (specific identification method). In FY2026, routine inventory valuation write-downs rose to 101 million JPY (from 32 million JPY in FY2025), but cost of sales absorbed 2,849 million JPY in quality-related losses caused by metal degradation during recycling.
Stress testing Furuya Metal Co., Ltd.’s balance sheet against a ±20% shock in market Iridium and Ruthenium prices highlights asymmetric exposure:
* Baseline Parameters: FY2026 revenue of 100,139 million JPY, COGS of 69,866 million JPY (raw materials represent ~75%, or 52,400 million JPY), gross profit of 30,272 million JPY (30.23% gross margin), raw material inventories of 74,580 million JPY, total inventories of 91,931 million JPY, payables of 33,975 million JPY, and net working capital (NWC) of 65,597 million JPY.
* Scenario A (+20% Price Shock): Raw material procurement costs increase by 10,480 million JPY to 62,880 million JPY. Total inventory values adjust to 108,851 million JPY (+16,920 million JPY) while payables rise to 40,770 million JPY (+6,795 million JPY), expanding net working capital requirements by 10,121 million JPY to 75,718 million JPY. If cost increases cannot be passed through, gross profit contracts to 19,792 million JPY (margin drops 1,046 bps to 19.77%). Under 100% price pass-through, gross profit remains 30,272 million JPY, with gross margin compressing 286 bps to 27.37% due to top-line denominator expansion. Liquidity absorption of 10,121 million JPY is covered by 30,000 million JPY in undrawn committed credit lines and 7,600 million JPY in cash balances.
* Scenario B (-20% Price Shock): Input costs fall by 10,480 million JPY to 41,920 million JPY. Inventory values contract by 16,920 million JPY to 75,011 million JPY, reducing payables by 6,795 million JPY to 27,180 million JPY and releasing 10,121 million JPY in liquid cash (NWC falls to 55,476 million JPY). However, the 74,580 million JPY raw material inventory faces theoretical gross down-valuation of up to 14,916 million JPY under the gross average cost rule, potentially cutting gross profit to 15,356 million JPY (margin falls 1,489 bps to 15.34%) if customer consignment arrangements fail to insulate physical holdings.
Supply chain dependencies remain centered on Tanaka Kikinzoku Kogyo, which holds a 17.27% equity stake (17.30% of voting rights) and maintains a commercial agreement for stable Iridium bullion allocation alongside a board observer seat (filled by external director Kazunori Ochiai). Upstream mine supply traces back to South Africa, balanced downstream by tolling and refining services that reduce reliance on virgin ore.
Customer concentration de-risked during FY2026. Long-term partner De Nora Group accounted for 15,265 million JPY, or 15.24% of revenue (De Nora Permelec Ltd. at 10,384 million JPY / 10.37% and De Nora Deutschland GmbH at 4,881 million JPY / 4.87%), down from 31.26% (17,939 million JPY) in FY2025. Other customers (including Western Digital, Seagate, and semiconductor accounts) accounted for 84.76% (84,874 million JPY).
Table KFK Vision 2030 Guidance vs. FY2026 Actual Delivery
Corporate governance metrics reflect structural alignment with Tokyo Stock Exchange Prime standards. The board consists of nine directors: six non-audit committee members (Takao Furuya - President, Tomohiro Maruko, Hideki Kuwabara, Tsutomu Nishimura, alongside external directors Kazunori Ochiai and Hideki Wakabayashi) and three audit committee members (Kazuo Shimazaki - standing, alongside external independent directors Keiko Matsubayashi and Michio Nakajin). External directors hold 44.44% (4/9) of board seats; independent directors represent 33.33% (3/9); and female representation stands at 11.11% (1/9, Keiko Matsubayashi, licensed tax accountant). The Nomination and Remuneration Advisory Committee convened twice in FY2026, comprising President Takao Furuya, Michio Nakajin, and Keiko Matsubayashi (chaired by an independent director).
Executive compensation comprises fixed base pay (~57.3%), short-term performance bonuses tied to operating, ordinary, and net income targets (~26.4%), and restricted stock (RS) units (~16.3%). FY2026 compensation totaled 417 million JPY across four non-audit internal directors (fixed 239 million JPY, bonus 110 million JPY, RS 68 million JPY; 42.69% incentive ratio). President Takao Furuya received 329 million JPY (fixed 204 million JPY, bonus 85 million JPY, RS 40 million JPY; 37.99% incentive ratio). Independent audit committee compensation was fixed at 17 million JPY, while five external directors received 25 million JPY (24 million JPY fixed, 1 million JPY bonus).
Shareholder distributions shifted alongside operational cash generation. Following a 1-for-3 stock split executed July 1, 2024, FY2026 dividend per share increased to 165.00 JPY (split-adjusted), up from 96.00 JPY in FY2025 (pre-split: 286.00 JPY in FY2024, 255.00 JPY in FY2023, and 255.00 JPY in FY2022). Earnings per share reached 652.00 JPY (vs. 263.29 JPY in FY2025, 322.47 JPY in FY2024, 449.17 JPY in FY2023, and 436.94 JPY in FY2022), resulting in a dividend payout ratio of 25.31% (down from 37.60% in FY2025, but returning 4,058 million JPY). Total Shareholder Return (TSR) reached 363.0% on a five-year basis against TOPIX’s 232.1%. Treasury holdings stand at 790,301 shares (3.11% of issued capital), with 23,300 shares allocated to RS grants in FY2026.
R&D expenditures totaled 1,290 million JPY in FY2026 (1.29% of revenue, down from 1,450 million JPY, or 2.53% of revenue, in FY2025 due to revenue denominator growth). Focus areas centered on functional alloys, PEM water electrolysis iridium catalysts, 4N/5N purity HAMR targets, and closed-loop refining, lifting new product revenue contributions to 22.0% (tracking toward the 25.0% 2030 target). Policy-held equities remain minimal: the company holds 5,400 shares in optical glass manufacturer Ohara Inc. [TYO: 5230] with a book value of 8.0 million JPY (0.0056% of total assets) and one unlisted shareholding carried at zero JPY.
HDIN Research concludes that while Furuya Metal Co., Ltd. has established an operational moat across HAMR-grade Ruthenium targets and Iridium crystal crucibles, the balance sheet remains exposed to underlying commodity swings. With 52.17% of consolidated assets tied to physical PGM stocks (74,580 million JPY), inventory carrying costs and potential gross down-valuations remain the primary operational risks during commodity price corrections.
Presentation Download & Video Access
- Presentation Download: Click the PDF download link under 'Related Topics' to access the full institutional presentation of this report.
- Video Link: Click this link to watch the HDIN analyst briefing on YouTube.
About HDIN Research
HDIN Research is a premier global market intelligence and strategic advisory firm specializing in institutional-grade financial analysis, supply chain audits, and macroeconomic forecasting. Our dedicated sector analysts deliver actionable, data-driven insights tailored for private equity, hedge funds, and corporate strategy teams. Visit us at http://www.hdinresearch.com.
2026 AI Transparency Footer
This intelligence report was authored by HDIN Research analysts following a rigorous audit of official corporate filings. AI was utilized for massive-scale data synthesis and structural drafting, ensuring 100% inclusion of reported data points. All strategic insights, financial modeling, and final verdicts were verified by our editorial board to ensure professional accuracy and compliance with 2026 Google Search E-E-A-T standards.
1. Furuya Metal Co., Ltd. [TYO: 7826] expanded FY2026 revenue 74.52% YoY to 100,139 million JPY, surpassing its FY2030 Ordinary Income target four years early at 24,664 million JPY.
2. Heat-Assisted Magnetic Recording (HAMR) Ruthenium target demand pushed Thin Film operating margins up 1,444 basis points to 52.64%, while client concentration in De Nora Group dropped from 31.3% to 15.2%.
3. Operating cash flow of 15,763 million JPY enabled full elimination of 13,400 million JPY in short-term debt, lowering the interest-bearing debt ratio to 9.7% against 74,580 million JPY in PGM inventory exposure.
Figure Furuya Metal Strategic Intelligence & Institutional Due Diligence Blueprint
Operating Leverage and Segmental Earnings ExpansionFuruya Metal Co., Ltd. experienced an operational inflection during FY2026 (Term 58, ended June 30, 2026), ending a cyclical trough that compressed earnings across FY2024 and FY2025. Consolidated revenue rose 74.52% YoY to 100,139 million JPY, posting a five-year Compound Annual Growth Rate (CAGR) of 21.92% from 45,321 million JPY in FY2022. Gross profit grew 113.36% YoY to 30,272 million JPY, expanding gross margin by 550 basis points to 30.23%. Operating income increased 159.95% YoY to 24,794 million JPY, driving operating margin up 814 basis points to 24.76%. Ordinary income climbed 162.70% YoY to 24,664 million JPY, while net income rose 147.90% YoY to 16,034 million JPY.
Table Consolidated Financial Performance (FY2022–FY2026)
| Metric (JPY million) | FY2022 | FY2023 | FY2024 | FY2025 | FY2026 | Trend / Multi-Year Development |
|---|---|---|---|---|---|---|
| Revenue | 45,321 | 48,115 | 47,527 | 57,379 | 100,139 | +21.92% CAGR |
| Gross Profit | N/A | N/A | N/A | 14,188 | 30,272 | +113.36% YoY |
| Operating Income | N/A | N/A | N/A | 9,538 | 24,794 | +159.95% YoY |
| Ordinary Income | 13,297 | 12,383 | 10,690 | 9,389 | 24,664 | +16.70% CAGR |
| Net Income | 9,142 | 9,406 | 7,410 | 6,468 | 16,034 | +15.08% CAGR |
| Gross Margin (%) | N/A | N/A | N/A | 24.73% | 30.23% | +550 bps |
| Operating Margin (%) | N/A | N/A | N/A | 16.62% | 24.76% | +814 bps |
| Ordinary Margin (%) | 29.34% | 25.74% | 22.49% | 16.36% | 24.63% | -471 bps (5-Year) |
| Return on Equity (ROE) | 28.3% | 23.3% | 14.2% | 10.4% | 22.5% | +1,210 bps YoY |
| Asset Turnover | 0.62x | 0.55x | 0.42x | 0.46x | 0.70x | +0.24x YoY |
| Financial Leverage | 1.98x | 1.97x | 1.86x | 1.92x | 1.82x | -0.10x YoY |
| Return on Assets (ROA) | 12.58% | 10.75% | 6.57% | 5.22% | 11.22% | +600 bps YoY |
| Equity Ratio (%) | 50.2% | 50.4% | 53.5% | 52.0% | 54.8% | +280 bps YoY |
Segment reporting across Furuya Metal Co., Ltd.’s five specialized operational units and secondary inventory management activities demonstrates divergence in pricing power and capital intensity:
* Thin Film: Revenue rose 60.00% YoY from 11,271 million JPY to 18,034 million JPY. Operating profit surged 120.53% YoY from 4,305 million JPY to 9,494 million JPY, yielding a segment margin of 52.64% (up 1,444 bps from 38.20%). The unit contributed 31.36% of consolidated operating profit, driven by high-purity (>99.99%) Ruthenium sputtering targets for Heat-Assisted Magnetic Recording (HAMR) hard disk drives deployed in AI cloud datacenters.
* Electronics: Revenue expanded 83.05% YoY from 5,904 million JPY to 10,807 million JPY (10.79% revenue share). Segment profit rose 94.39% YoY from 1,729 million JPY to 3,361 million JPY, with margins expanding 182 bps to 31.10%, supported by demand for high-purity Iridium crucibles (melting point 2,446°C) for lithium tantalate/niobate (LT/LN) SAW filter crystal growth and medical PET/CT scintillator crystals, alongside optical isolators.
* Thermal: Revenue climbed 37.61% YoY from 4,860 million JPY to 6,688 million JPY. Operating profit increased 50.26% YoY from 1,548 million JPY to 2,326 million JPY, moving margins up 293 bps to 34.78% due to fab equipment utilization recoveries driving sensor probe replacements.
* Fine Chemical & Recycle: Revenue grew 5.21% YoY from 26,328 million JPY to 27,701 million JPY. Segment profit rose 41.85% YoY from 6,458 million JPY to 9,161 million JPY, lifting segment margins by 854 bps to 33.07%. Earnings absorbed a 2,849 million JPY one-off quality-related loss associated with refining operations.
* Supply Chain Support: Revenue advanced 148.84% YoY from 7,653 million JPY to 19,044 million JPY, with segment profit expanding from 40 million JPY to 2,331 million JPY (+5,727.50% YoY). Operating margin reached 12.24% (up 1,172 bps from 0.52%) on physical pass-through trading of PGM raw materials tied to customer contract volumes.
* Others: Revenue grew 1,212.49% YoY from 1,361 million JPY to 17,863 million JPY, generating 3,597 million JPY in operating profit (up 3,325.71% YoY from 105 million JPY). Management executed PGM inventory rebalancing transactions that yielded 16,558 million JPY in sales and 3,270 million JPY in operating gains.
Table Segment Financial Breakdown (FY2025 vs. FY2026)
| Segment | FY2025 Revenue / Operating Margin | FY2026 Revenue / Operating Margin | YoY Revenue Growth (%) | Margin Change (bps) |
|---|---|---|---|---|
| Electronics | JPY 5,904 million / 29.28% | JPY 10,807 million / 31.10% | +83.05% | +182 bps |
| Thin Film | JPY 11,271 million / 38.20% | JPY 18,034 million / 52.64% | +60.00% | +1,444 bps |
| Thermal | JPY 4,860 million / 31.85% | JPY 6,688 million / 34.78% | +37.61% | +293 bps |
| Fine Chemical & Recycling | JPY 26,328 million / 24.53% | JPY 27,701 million / 33.07% | +5.21% | +854 bps |
| Supply Chain Support | JPY 7,653 million / 0.52% | JPY 19,044 million / 12.24% | +148.84% | +1,172 bps |
| Others (Business Rebalancing) | JPY 1,361 million / 7.72% | JPY 17,863 million / 20.14% | +1,212.49% | +1,242 bps |
| Consolidated Total | JPY 57,379 million / 16.62% | JPY 100,139 million / 24.76% | +74.52% | +814 bps |
Cash flow conversion shifted into operational surplus in FY2026. Operating cash flow reached 15,763 million JPY (up from 921 million JPY in FY2025, -461 million JPY in FY2023, and -1,225 million JPY in FY2022). Investing cash outflows totaled 3,948 million JPY, yielding 11,815 million JPY in Free Cash Flow (FCF), reversing the negative FCF of 4,014 million JPY in FY2025, 2,789 million JPY in FY2023, and 3,011 million JPY in FY2022. Financing cash flow registered an outflow of 17,290 million JPY as the group cleared 13,400 million JPY in short-term bank borrowings and disbursed 2,360 million JPY in financing cash dividends (total FY2026 dividend distribution of 4,058 million JPY). Tangible fixed asset capital expenditures totaled 3,010 million JPY against depreciation of 1,277 million JPY (compared to 3,909 million JPY capex and 1,289 million JPY depreciation in FY2025).
Working capital velocity improved despite elevated raw material carry. Accounts receivable rose from 3,594 million JPY to 7,641 million JPY (+4,047 million JPY), expanding Days Sales Outstanding (DSO) from 22.8 days to 27.8 days (+5.0 days). Consolidated inventories grew from 82,394 million JPY to 91,931 million JPY (+9,537 million JPY), consisting of 74,580 million JPY in raw materials and supplies (52.17% of total assets and 81.13% of inventory), 9,791 million JPY in merchandise/finished goods, and 7,558 million JPY in work-in-process (WIP). Days Inventory Outstanding (DIO) fell 215.8 days from 696.1 days to 480.3 days. Accounts payable expanded from 22,343 million JPY to 33,975 million JPY (+11,632 million JPY), adjusting Days Payables Outstanding (DPO) from 188.8 days to 177.5 days (-11.3 days). Consequently, the Cash Conversion Cycle (CCC) contracted by 199.5 days from 530.1 days to 330.6 days.
Manufacturing Network and Geographic Footprint
Furuya Metal Co., Ltd.’s industrial operations are concentrated in three domestic production facilities supported by corporate headquarters in Toshima-ku, Tokyo (tangible book value of 21 million JPY, buildings 9 million JPY, workforce of 93 regular and 4 temporary employees). Consolidated tangible fixed assets stood at 21,850 million JPY, with net book value of identified sites totaling 16,857 million JPY (buildings 3,984 million JPY, machinery 9,781 million JPY, land 3,009 million JPY) across 448 regular and 137 temporary employees:
Table Operational Manufacturing Network (As of June 30, 2026)
| Facility / Location | Core Specialization | PP&E Net Value | Land Area / Book Value | Workforce (Temporary Staff) |
|---|---|---|---|---|
| Tsukuba Plant (Chikusei, Ibaraki) | PGM fabrication and sputtering targets production | JPY 11,410 million (Machinery: JPY 8,085 million) | 53,238 m² | 195 (35) |
| Tsuchiura Plant (Tsuchiura, Ibaraki) | Refining and closed-loop PGM recovery | JPY 5,330 million (Machinery: JPY 1,695 million) | 44,421 m² | 139 (6) |
| New Chitose Plant (Chitose, Hokkaido) | Sensors, quartz products and geographical risk diversification | JPY 96 million (excluding CIP assets) | N/A (Industrial Park) | 21 (2) |
| Tokyo Headquarters (Toshima-ku, Tokyo) | Corporate administration and commercial operations | JPY 21 million (Buildings: JPY 9 million) | N/A (Leased premises) | 93 (4) |
Facility capital deployment totaled 3,786 million JPY in FY2026. The group allocated 1,974 million JPY to Construction in Progress for the New Chitose Plant, which completed construction in July 2026 to mitigate seismic operational exposure concentrated in Ibaraki Prefecture. Upgrades to dry and wet PGM refining circuits at the Tsuchiura Plant absorbed 1,243 million JPY, while Tsukuba automated fabrication cells to expand unit output density.
International shipments generated 72.54% of consolidated revenue (72,640 million JPY), expanding 105.74% YoY from 35,307 million JPY (61.53% share) in FY2025. Domestic Japanese revenue rose 24.59% YoY to 27,498 million JPY (27.46% share). Mainland China (including Hong Kong) expanded 229.17% YoY from 8,235 million JPY to 27,107 million JPY (27.07% share), supported by Furuya Non-ferrous Metals (Shanghai) Co., Ltd. (wholly owned, capital 276 million JPY). Asia ex-Japan (excluding Mainland China) rose 95.70% YoY from 6,152 million JPY to 12,039 million JPY (12.02% share), serving foundries in Taiwan, China and memory makers in South Korea via Korea Furuya Metal Co., Ltd. (wholly owned, capital 29 million KRW/JPY equivalent). North America generated 14,101 million JPY (+55.33% YoY, 14.08% share), with the United States accounting for 13,179 million JPY (+47.75% YoY, 13.16% share), supported by Furuya Metal America, Inc. (wholly owned, capital 59 million JPY) in Manchester, New Hampshire. European revenue rose 63.77% YoY to 19,393 million JPY (19.37% share), led by Germany at 11,229 million JPY (+19.61% YoY, 11.21% share). Auxiliary bullion recycling is managed via Furuya Eco-Front Technology Co., Ltd. (60% owned joint venture with Valterra Platinum / Anglo Platinum Marketing Limited, capital 250 million JPY).
Table Geographic Revenue Matrix (FY2025 vs. FY2026)
| Region | FY2025 Revenue (Share) | FY2026 Revenue (Share) | YoY Change (%) | Regional Core Market Exposure |
|---|---|---|---|---|
| Japan (Domestic) | JPY 22,072 million (38.47%) | JPY 27,498 million (27.46%) | +24.59% | Semiconductor equipment |
| Mainland China & Hong Kong | JPY 8,235 million (14.35%) | JPY 27,107 million (27.07%) | +229.17% | Semiconductor fabs and display panels |
| Other Asia | JPY 6,152 million (10.72%) | JPY 12,039 million (12.02%) | +95.70% | TSMC ecosystem and memory semiconductor customers |
| North America | JPY 9,078 million (15.82%) | JPY 14,101 million (14.08%) | +55.33% | Cloud hyperscalers |
| • United States (Isolated) | JPY 8,920 million (15.55%) | JPY 13,179 million (13.16%) | +47.75% | Seagate, Western Digital |
| Europe | JPY 11,842 million (20.64%) | JPY 19,393 million (19.37%) | +63.77% | De Nora Group and industrial applications |
| • Germany (Isolated) | JPY 9,388 million (16.36%) | JPY 11,229 million (11.21%) | +19.61% | Chlor-alkali industry |
| Total Consolidated | JPY 57,379 million (100.0%) | JPY 100,139 million (100.0%) | +74.52% | Global customer base |
Foreign exchange exposure linked to USD-denominated raw material procurement and international sales was managed via forward contracts governed by corporate derivative regulations. At FY2026 year-end, open OTC forward contracts included 22,226 million JPY in USD buy positions (fair value gain of 1,352 million JPY) and 2,246 million JPY in USD sell positions (fair value loss of 37 million JPY), yielding a net balance sheet asset fair value of 1,314 million JPY (up from a net liability fair value of 124 million JPY on 20,955 million JPY in buy positions in FY2025). On the P&L, non-operating foreign exchange losses of 1,204 million JPY were offset by 1,439 million JPY in derivative valuation gains, delivering a net positive non-operating currency contribution of 235 million JPY (reversing the FY2025 derivative valuation loss of 1,719 million JPY).
Forensic Audit, Single-Point Vulnerabilities, and Institutional Verdict
Auditing corporate disclosures reveals structural concentrations and raw material dependencies that counterbalance management’s growth narrative:
Table Single-Point Vulnerability (SPOF) Audit
| Entity / Risk Vector | Relationship | Volume / P&L Weight | Failure Impact and Redundancy Assessment |
|---|---|---|---|
| Tanaka Kikinzoku Kogyo | Top shareholder (17.30% voting rights) | Primary iridium raw material supplier | Highest Single Point of Failure (SPOF): Loss of supply agreement could disrupt crucible manufacturing lines. |
| De Nora Group | Core customer (electrodes business) | JPY 15,265 million revenue (15.24% of sales) | Partial SPOF: Customer concentration risk; revenue exposure declined from 31.3% in FY2025 due to diversification. |
| South African Mine Belt | Upstream raw material origin | >80% of global ruthenium/iridium primary supply | Systemic SPOF: Geopolitical and mining supply risks; partially mitigated through internal recycling capabilities. |
| PGM Inventory Holdings | Working capital concentration (bullion inventory) | JPY 74,580 million (52.17% of total assets) | Valuation Key Audit Matter (KAM): A 20% PGM price decline could result in approximately JPY 14,920 million impairment exposure. |
Taiyo Limited Liability Audit Corporation identified the valuation of inventories (specifically the 74,580 million JPY raw material stock) as the sole Key Audit Matter (KAM). Inventory costing utilizes the gross average method for raw materials, while finished goods separate material costs (gross average) from fabrication costs (specific identification method). In FY2026, routine inventory valuation write-downs rose to 101 million JPY (from 32 million JPY in FY2025), but cost of sales absorbed 2,849 million JPY in quality-related losses caused by metal degradation during recycling.
Stress testing Furuya Metal Co., Ltd.’s balance sheet against a ±20% shock in market Iridium and Ruthenium prices highlights asymmetric exposure:
* Baseline Parameters: FY2026 revenue of 100,139 million JPY, COGS of 69,866 million JPY (raw materials represent ~75%, or 52,400 million JPY), gross profit of 30,272 million JPY (30.23% gross margin), raw material inventories of 74,580 million JPY, total inventories of 91,931 million JPY, payables of 33,975 million JPY, and net working capital (NWC) of 65,597 million JPY.
* Scenario A (+20% Price Shock): Raw material procurement costs increase by 10,480 million JPY to 62,880 million JPY. Total inventory values adjust to 108,851 million JPY (+16,920 million JPY) while payables rise to 40,770 million JPY (+6,795 million JPY), expanding net working capital requirements by 10,121 million JPY to 75,718 million JPY. If cost increases cannot be passed through, gross profit contracts to 19,792 million JPY (margin drops 1,046 bps to 19.77%). Under 100% price pass-through, gross profit remains 30,272 million JPY, with gross margin compressing 286 bps to 27.37% due to top-line denominator expansion. Liquidity absorption of 10,121 million JPY is covered by 30,000 million JPY in undrawn committed credit lines and 7,600 million JPY in cash balances.
* Scenario B (-20% Price Shock): Input costs fall by 10,480 million JPY to 41,920 million JPY. Inventory values contract by 16,920 million JPY to 75,011 million JPY, reducing payables by 6,795 million JPY to 27,180 million JPY and releasing 10,121 million JPY in liquid cash (NWC falls to 55,476 million JPY). However, the 74,580 million JPY raw material inventory faces theoretical gross down-valuation of up to 14,916 million JPY under the gross average cost rule, potentially cutting gross profit to 15,356 million JPY (margin falls 1,489 bps to 15.34%) if customer consignment arrangements fail to insulate physical holdings.
Supply chain dependencies remain centered on Tanaka Kikinzoku Kogyo, which holds a 17.27% equity stake (17.30% of voting rights) and maintains a commercial agreement for stable Iridium bullion allocation alongside a board observer seat (filled by external director Kazunori Ochiai). Upstream mine supply traces back to South Africa, balanced downstream by tolling and refining services that reduce reliance on virgin ore.
Customer concentration de-risked during FY2026. Long-term partner De Nora Group accounted for 15,265 million JPY, or 15.24% of revenue (De Nora Permelec Ltd. at 10,384 million JPY / 10.37% and De Nora Deutschland GmbH at 4,881 million JPY / 4.87%), down from 31.26% (17,939 million JPY) in FY2025. Other customers (including Western Digital, Seagate, and semiconductor accounts) accounted for 84.76% (84,874 million JPY).
Table KFK Vision 2030 Guidance vs. FY2026 Actual Delivery
| Metric | FY2030 Target (Plan) | FY2026 Actual (Delivered) | Variance / Status |
|---|---|---|---|
| Revenue | JPY 150.0 billion | JPY 100.14 billion | 66.76% of FY2030 target achieved |
| Ordinary Income | JPY 20.0 billion | JPY 24.66 billion | 123.32% of target achieved (4 years ahead of plan) |
| Return on Equity (ROE) | ≥10.0% | 22.5% | +1,250 bps above target |
| Return on Invested Capital (ROIC) | ≥8.0% | 17.3% | +930 bps above target |
| Scope 1 & Scope 2 GHG Emissions | -80% versus FY2023 baseline | -80% achieved | Target achieved through 100% renewable electricity adoption |
| Automation Density | 1,000 robots per 10,000 employees | 523 robots per 10,000 employees | Implementation ongoing |
| Cross-Shareholdings | Zero target (TSE Prime governance policy) | JPY 8.0 million book value | Remaining holding: Ohara Inc. (5,400 shares) |
Corporate governance metrics reflect structural alignment with Tokyo Stock Exchange Prime standards. The board consists of nine directors: six non-audit committee members (Takao Furuya - President, Tomohiro Maruko, Hideki Kuwabara, Tsutomu Nishimura, alongside external directors Kazunori Ochiai and Hideki Wakabayashi) and three audit committee members (Kazuo Shimazaki - standing, alongside external independent directors Keiko Matsubayashi and Michio Nakajin). External directors hold 44.44% (4/9) of board seats; independent directors represent 33.33% (3/9); and female representation stands at 11.11% (1/9, Keiko Matsubayashi, licensed tax accountant). The Nomination and Remuneration Advisory Committee convened twice in FY2026, comprising President Takao Furuya, Michio Nakajin, and Keiko Matsubayashi (chaired by an independent director).
Executive compensation comprises fixed base pay (~57.3%), short-term performance bonuses tied to operating, ordinary, and net income targets (~26.4%), and restricted stock (RS) units (~16.3%). FY2026 compensation totaled 417 million JPY across four non-audit internal directors (fixed 239 million JPY, bonus 110 million JPY, RS 68 million JPY; 42.69% incentive ratio). President Takao Furuya received 329 million JPY (fixed 204 million JPY, bonus 85 million JPY, RS 40 million JPY; 37.99% incentive ratio). Independent audit committee compensation was fixed at 17 million JPY, while five external directors received 25 million JPY (24 million JPY fixed, 1 million JPY bonus).
Shareholder distributions shifted alongside operational cash generation. Following a 1-for-3 stock split executed July 1, 2024, FY2026 dividend per share increased to 165.00 JPY (split-adjusted), up from 96.00 JPY in FY2025 (pre-split: 286.00 JPY in FY2024, 255.00 JPY in FY2023, and 255.00 JPY in FY2022). Earnings per share reached 652.00 JPY (vs. 263.29 JPY in FY2025, 322.47 JPY in FY2024, 449.17 JPY in FY2023, and 436.94 JPY in FY2022), resulting in a dividend payout ratio of 25.31% (down from 37.60% in FY2025, but returning 4,058 million JPY). Total Shareholder Return (TSR) reached 363.0% on a five-year basis against TOPIX’s 232.1%. Treasury holdings stand at 790,301 shares (3.11% of issued capital), with 23,300 shares allocated to RS grants in FY2026.
R&D expenditures totaled 1,290 million JPY in FY2026 (1.29% of revenue, down from 1,450 million JPY, or 2.53% of revenue, in FY2025 due to revenue denominator growth). Focus areas centered on functional alloys, PEM water electrolysis iridium catalysts, 4N/5N purity HAMR targets, and closed-loop refining, lifting new product revenue contributions to 22.0% (tracking toward the 25.0% 2030 target). Policy-held equities remain minimal: the company holds 5,400 shares in optical glass manufacturer Ohara Inc. [TYO: 5230] with a book value of 8.0 million JPY (0.0056% of total assets) and one unlisted shareholding carried at zero JPY.
HDIN Research concludes that while Furuya Metal Co., Ltd. has established an operational moat across HAMR-grade Ruthenium targets and Iridium crystal crucibles, the balance sheet remains exposed to underlying commodity swings. With 52.17% of consolidated assets tied to physical PGM stocks (74,580 million JPY), inventory carrying costs and potential gross down-valuations remain the primary operational risks during commodity price corrections.
Presentation Download & Video Access
- Presentation Download: Click the PDF download link under 'Related Topics' to access the full institutional presentation of this report.
- Video Link: Click this link to watch the HDIN analyst briefing on YouTube.
About HDIN Research
HDIN Research is a premier global market intelligence and strategic advisory firm specializing in institutional-grade financial analysis, supply chain audits, and macroeconomic forecasting. Our dedicated sector analysts deliver actionable, data-driven insights tailored for private equity, hedge funds, and corporate strategy teams. Visit us at http://www.hdinresearch.com.
2026 AI Transparency Footer
This intelligence report was authored by HDIN Research analysts following a rigorous audit of official corporate filings. AI was utilized for massive-scale data synthesis and structural drafting, ensuring 100% inclusion of reported data points. All strategic insights, financial modeling, and final verdicts were verified by our editorial board to ensure professional accuracy and compliance with 2026 Google Search E-E-A-T standards.