Shanghai Xphor Technology Co., Ltd.: Pure-Play PIC Scale-Up Confronts Foundry Concentration and Working Capital Absorption Near Shanghai Headquarters as 2026 Capex Realigns
Date : 2026-10-09
Reading : 162
HDIN Executive Takeaways
1. Shanghai Xphor Technology Co., Ltd. demonstrates volume-driven operating leverage, scaling revenue from RMB 6.23 million in 2023 to RMB 569.12 million in 1H 2026, delivering an annualized 2025 ROE of 41.63% without debt leverage.
2. Structural balance-sheet drag emerged in 1H 2026 as operating cash flow contracted to negative RMB 13.75 million, driven by RMB 161.65 million in wafer capacity prepayments alongside RMB 315.04 million in receivables from downstream module providers.
3. Supply chain vulnerability remains high: Supplier A absorbed 90.08% of procurement in 1H 2026, while a production ramp misstep at a secondary facility triggered a combined RMB 36.41 million in inventory write-downs and advance payment impairments.
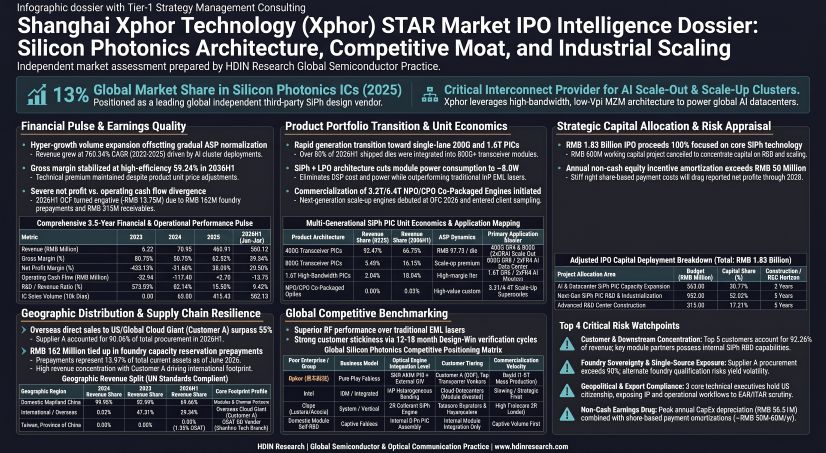
Figure Shanghai Xphor Technology (Xphor) STAR Market lPO Intelligence Dossier
 Segmental Realities and Balance Sheet Absorption
Shanghai Xphor Technology Co., Ltd. operates a pure-play Fabless model focused on silicon photonics integrated circuits (PIC), moving from initial sampling to volume deployment across data center interconnect architectures:
* Revenue Expansion and Product Shift: Total revenue reached RMB 6.23 million in 2023, RMB 70.95 million in 2024, RMB 460.91 million in 2025 (CAGR of 760.33%), and RMB 569.12 million in 1H 2026. The 400G PIC line generated RMB 0.57 million (9.10%) in 2023, RMB 70.11 million (98.81%) in 2024, RMB 426.21 million (92.47%) in 2025, and RMB 374.20 million (65.75%) in 1H 2026. Transition to higher speeds occurred in 800G PICs (RMB 0.84 million or 1.19% in 2024; RMB 25.28 million or 5.49% in 2025; RMB 91.79 million or 16.13% in 1H 2026) and 1.6T PICs (RMB 9.41 million or 2.04% in 2025; RMB 102.66 million or 18.04% in 1H 2026). Initial commercialization of NPO/CPO integrated transceivers contributed RMB 0.30 million (0.05%) in 1H 2026, while non-recurring technical engineering services contributed RMB 5.66 million (90.90%) in 2023 and RMB 0.17 million (0.03%) in 1H 2026.
* Shipment Volumes and Average Selling Prices: Total unit volume scaled from 500 units (0.05 million) in 2023 to 630,500 units in 2024, 4,754,300 units in 2025, and 5,821,500 units in 1H 2026. Consolidated average selling price (ASP) contracted from RMB 1,133.40 per unit in 2023 (engineering prototypes) to RMB 112.53 in 2024, stabilizing at RMB 96.95 in 2025 and RMB 97.73 in 1H 2026 as higher-value 200G/lane architectures offset general price compression.
* Profitability Metrics and Dupont Analysis: Gross margin fluctuated from 80.78% in 2023 to 50.75% in 2024, 62.82% in 2025, and 59.24% in 1H 2026. Net profit moved from losses of RMB 28.34 million (2023) and RMB 22.46 million (2024) to net income of RMB 175.55 million (2025) and RMB 161.05 million (1H 2026). Net profit margin reached 38.09% in 2025 and 28.30% in 1H 2026. Total asset turnover rose from 0.08x in 2023 to 0.31x in 2024, 0.68x in 2025, and 0.98x (annualized) in 1H 2026. Equity multipliers remained unleveraged at 1.08x (2023), 1.08x (2024), 1.04x (2025), and 1.08x (1H 2026), generating a weighted ROE of negative 20.90% (2023), negative 11.75% (2024), positive 41.63% (2025), and 14.72% (non-annualized, 1H 2026). Total interest-bearing debt remained at RMB 0.00 across all periods.
* Operating Expenses and Overhead Absorption: Sales expense ratio compressed from 8.73% (2023) to 4.13% (2024), 1.91% (2025), and 1.42% (1H 2026). Administrative expense ratio shifted from 133.78% (2023) to 17.53% (2024), 3.60% (2025), and 6.83% (1H 2026), with the latest increase driven by RMB 8.14 million in share-based compensation and RMB 3.75 million in wafer scrap expenses. Research and development expenses totaled RMB 35.86 million (575.93%) in 2023, RMB 44.52 million (62.74%) in 2024, RMB 62.70 million (13.60%) in 2025, and RMB 53.59 million (9.42%) in 1H 2026, maintaining a 0.00% capitalization rate. Total operating expense ratios dropped from 711.87% (2023) to 19.55% (2025) and 19.10% (1H 2026).
* Cash Conversion Quality and Liquidity Metrics: Net cash flow from operating activities posted negative RMB 32.94 million in 2023, negative RMB 117.40 million in 2024, positive RMB 2.70 million in 2025, and negative RMB 13.75 million in 1H 2026. The operating-cash-to-net-income ratio stood at 0.015 (1.53%) in 2025 and negative 0.085 in 1H 2026. Prepayments to secure wafer allocation expanded from RMB 2.11 million (2023) to RMB 32.85 million (2024), RMB 133.83 million (2025), and RMB 161.65 million (1H 2026). Accounts receivable balances stood at RMB 4.27 million (2023), RMB 69.62 million (2024), RMB 139.86 million (2025), and RMB 315.04 million (1H 2026). Consolidated balance-sheet liquidity remained defensive with 1H 2026 cash and cash equivalents of RMB 437.00 million, short-term investments of RMB 126.00 million (aggregate cash reserves of RMB 563.00 million), a current ratio of 14.72x, and a quick ratio of 13.22x.
Table Cost Structure Evolution and Manufacturing Cost Driver Analysis (2023–1H 2026)
Infrastructure Layout and Regional Moats
Shanghai Xphor Technology Co., Ltd. maintains its operational headquarters at 1030 Tongpu Road, Putuo District, Shanghai, encompassing core circuit architecture, process design kit (PDK) compilation, and proprietary wafer-level (CP) and final chip-level (FT) automated electro-optical test operations. Off-shore administrative and technical representation is executed through Xphor Pte. Ltd. (Singapore) and Xphor Inc. (Delaware, United States). Inactive domestic affiliate Nanjing Xiguang was officially liquidated in February 2026.
Wafer fabrication is entirely outsourced across external foundries. Supplier A accounted for procurement shares of 54.54% (RMB 11.14 million) in 2023, 83.75% (RMB 59.20 million) in 2024, 86.56% (RMB 214.22 million) in 2025, and 90.08% (RMB 286.87 million) in 1H 2026, with top-five supplier concentration reaching 97.31%. Advance payments to Supplier A totaled RMB 140.00 million, or 81.59% of total prepayments at the end of 1H 2026. Secondary and tertiary foundry options remained constrained, with Supplier B absorbing 3.53% of procurement in 1H 2026 and Supplier C dropping below 2.00%.
Back-end packaging, thinning, and dicing (OSAT) are distributed among third parties, including Suzhou Jingxi Semiconductor Co., Ltd. and ShunYun Technology Holdings Limited Taiwan Branch (Taiwan, Province of China), the latter representing 1.88% of 1H 2026 procurement.
Geographic revenue generation has pivoted from domestic concentrations toward export markets:
* Domestic Eastern China: RMB 6.16 million (98.86%) in 2023, RMB 68.71 million (96.85%) in 2024, RMB 80.89 million (17.55%) in 2025, and RMB 59.36 million (10.43%) in 1H 2026.
* Domestic Southern China: RMB 1.69 million (2.38%) in 2024, RMB 63.77 million (13.84%) in 2025, and RMB 91.81 million (16.13%) in 1H 2026.
* Domestic Southwestern China: RMB 0.29 million (0.40%) in 2024, RMB 61.32 million (13.30%) in 2025, and RMB 94.48 million (16.60%) in 1H 2026 (including optical module clients such as Chengdu Ebyte / Zhongji InnoLight / Eoptolink supply chains).
* Domestic Central and Northern China: Central generated RMB 30.25 million (5.31%) in 1H 2026; Northern generated RMB 69.33 million (12.18%) in 1H 2026.
* Export Markets: Scaled from RMB 0.07 million (1.14%) in 2023 to RMB 218.98 million (47.51%) in 2025 and RMB 223.89 million (39.34%) in 1H 2026, anchored by direct optical interconnect supply to Customer A, a North American cloud service provider.
HDIN Institutional Verdict
Management positions Shanghai Xphor Technology Co., Ltd. as an unencumbered beneficiary of hyperscale AI clustering, citing its 13% global market share in 2025 and technological parity in 200G/lane Mach-Zehnder Modulators (Vpi at 6.5V, electro-optic bandwidth >55GHz, insertion loss <11dB). However, operational and forensic verification qualifies this outlook across three structural choke points:
1. Divergence Between Accrual Profits and Liquidity Realization: The company booked RMB 336.59 million in cumulative net profits across 2025 and 1H 2026, while generating negative RMB 11.05 million in combined operating cash flow. The dual burden of funding Supplier A via unreturned prepayments (RMB 161.65 million) while financing downstream module leaders via unsecured receivables (RMB 315.04 million) creates working capital attrition that forces reliance on its proposed RMB 1.83 billion initial public offering.
2. Engineering Friction in Secondary Foundry Integration: Initial qualification runs at a new manufacturing platform in 1H 2026 suffered yield deficits, resulting in an immediate contract halt, an inventory write-down of RMB 26.11 million, a prepayment impairment of RMB 10.29 million, and scrap compensation of RMB 3.75 million (aggregate P&L damage of RMB 40.16 million). Unit sensitivity modeling indicates that a 10% increase in baseline wafer pricing compresses gross margin by 355 basis points in 1H 2026, while a 5% yield degradation degrades margins by 198 basis points.
3. Customer Intermediary Overhang and Over-the-Horizon Amortization: Top-five customer revenue concentration stood at 92.26% in 1H 2026, with Customer A accounting for 55.55% and optical module manufacturer Customer B taking 25.85% (consolidated end-market basis). Downstream optical module assemblers like Zhongji InnoLight Co., Ltd. and Eoptolink Technology Inc. maintain active internal PIC design programs, threatening independent merchant supplier allocations once proprietary yields stabilize. Concurrently, mandatory share-based payment amortizations will impose pre-tax non-cash deductions of RMB 48.00 million in 2026, RMB 60.95 million in 2027, and RMB 55.23 million in 2028.
Presentation Download & Video Access:
- Presentation Download: Click the PDF download link under 'Related Topics' to access the full institutional presentation of this report.
- Video Link: Click this link to watch the HDIN analyst briefing on YouTube.
About HDIN Research:
HDIN Research is a premier global market intelligence and strategic advisory firm specializing in institutional-grade financial analysis, supply chain audits, and macroeconomic forecasting. Our dedicated sector analysts deliver actionable, data-driven insights tailored for private equity, hedge funds, and corporate strategy teams. Visit us at http://www.hdinresearch.com.
2026 AI Transparency Footer:
This intelligence report was authored by HDIN Research analysts following a rigorous audit of official corporate filings. AI was utilized for massive-scale data synthesis and structural drafting, ensuring 100% inclusion of reported data points. All strategic insights, financial modeling, and final verdicts were verified by our editorial board to ensure professional accuracy and compliance with 2026 Google Search E-E-A-T standards.
1. Shanghai Xphor Technology Co., Ltd. demonstrates volume-driven operating leverage, scaling revenue from RMB 6.23 million in 2023 to RMB 569.12 million in 1H 2026, delivering an annualized 2025 ROE of 41.63% without debt leverage.
2. Structural balance-sheet drag emerged in 1H 2026 as operating cash flow contracted to negative RMB 13.75 million, driven by RMB 161.65 million in wafer capacity prepayments alongside RMB 315.04 million in receivables from downstream module providers.
3. Supply chain vulnerability remains high: Supplier A absorbed 90.08% of procurement in 1H 2026, while a production ramp misstep at a secondary facility triggered a combined RMB 36.41 million in inventory write-downs and advance payment impairments.
Figure Shanghai Xphor Technology (Xphor) STAR Market lPO Intelligence Dossier
Segmental Realities and Balance Sheet AbsorptionShanghai Xphor Technology Co., Ltd. operates a pure-play Fabless model focused on silicon photonics integrated circuits (PIC), moving from initial sampling to volume deployment across data center interconnect architectures:
* Revenue Expansion and Product Shift: Total revenue reached RMB 6.23 million in 2023, RMB 70.95 million in 2024, RMB 460.91 million in 2025 (CAGR of 760.33%), and RMB 569.12 million in 1H 2026. The 400G PIC line generated RMB 0.57 million (9.10%) in 2023, RMB 70.11 million (98.81%) in 2024, RMB 426.21 million (92.47%) in 2025, and RMB 374.20 million (65.75%) in 1H 2026. Transition to higher speeds occurred in 800G PICs (RMB 0.84 million or 1.19% in 2024; RMB 25.28 million or 5.49% in 2025; RMB 91.79 million or 16.13% in 1H 2026) and 1.6T PICs (RMB 9.41 million or 2.04% in 2025; RMB 102.66 million or 18.04% in 1H 2026). Initial commercialization of NPO/CPO integrated transceivers contributed RMB 0.30 million (0.05%) in 1H 2026, while non-recurring technical engineering services contributed RMB 5.66 million (90.90%) in 2023 and RMB 0.17 million (0.03%) in 1H 2026.
* Shipment Volumes and Average Selling Prices: Total unit volume scaled from 500 units (0.05 million) in 2023 to 630,500 units in 2024, 4,754,300 units in 2025, and 5,821,500 units in 1H 2026. Consolidated average selling price (ASP) contracted from RMB 1,133.40 per unit in 2023 (engineering prototypes) to RMB 112.53 in 2024, stabilizing at RMB 96.95 in 2025 and RMB 97.73 in 1H 2026 as higher-value 200G/lane architectures offset general price compression.
* Profitability Metrics and Dupont Analysis: Gross margin fluctuated from 80.78% in 2023 to 50.75% in 2024, 62.82% in 2025, and 59.24% in 1H 2026. Net profit moved from losses of RMB 28.34 million (2023) and RMB 22.46 million (2024) to net income of RMB 175.55 million (2025) and RMB 161.05 million (1H 2026). Net profit margin reached 38.09% in 2025 and 28.30% in 1H 2026. Total asset turnover rose from 0.08x in 2023 to 0.31x in 2024, 0.68x in 2025, and 0.98x (annualized) in 1H 2026. Equity multipliers remained unleveraged at 1.08x (2023), 1.08x (2024), 1.04x (2025), and 1.08x (1H 2026), generating a weighted ROE of negative 20.90% (2023), negative 11.75% (2024), positive 41.63% (2025), and 14.72% (non-annualized, 1H 2026). Total interest-bearing debt remained at RMB 0.00 across all periods.
* Operating Expenses and Overhead Absorption: Sales expense ratio compressed from 8.73% (2023) to 4.13% (2024), 1.91% (2025), and 1.42% (1H 2026). Administrative expense ratio shifted from 133.78% (2023) to 17.53% (2024), 3.60% (2025), and 6.83% (1H 2026), with the latest increase driven by RMB 8.14 million in share-based compensation and RMB 3.75 million in wafer scrap expenses. Research and development expenses totaled RMB 35.86 million (575.93%) in 2023, RMB 44.52 million (62.74%) in 2024, RMB 62.70 million (13.60%) in 2025, and RMB 53.59 million (9.42%) in 1H 2026, maintaining a 0.00% capitalization rate. Total operating expense ratios dropped from 711.87% (2023) to 19.55% (2025) and 19.10% (1H 2026).
* Cash Conversion Quality and Liquidity Metrics: Net cash flow from operating activities posted negative RMB 32.94 million in 2023, negative RMB 117.40 million in 2024, positive RMB 2.70 million in 2025, and negative RMB 13.75 million in 1H 2026. The operating-cash-to-net-income ratio stood at 0.015 (1.53%) in 2025 and negative 0.085 in 1H 2026. Prepayments to secure wafer allocation expanded from RMB 2.11 million (2023) to RMB 32.85 million (2024), RMB 133.83 million (2025), and RMB 161.65 million (1H 2026). Accounts receivable balances stood at RMB 4.27 million (2023), RMB 69.62 million (2024), RMB 139.86 million (2025), and RMB 315.04 million (1H 2026). Consolidated balance-sheet liquidity remained defensive with 1H 2026 cash and cash equivalents of RMB 437.00 million, short-term investments of RMB 126.00 million (aggregate cash reserves of RMB 563.00 million), a current ratio of 14.72x, and a quick ratio of 13.22x.
Table Cost Structure Evolution and Manufacturing Cost Driver Analysis (2023–1H 2026)
| Cost and Variance Dimension | 2023 Value / Share | 2024 Value / Share | 2025 Value / Share | 1H 2026 Value / Share | Trajectory and Operational Driver |
| Raw Material Costs (Wafers) | RMB 0.07m (5.44%) | RMB 27.05m (77.40%) | RMB 138.93m (81.07%) | RMB 201.60m (86.90%) | Wafer procurement dominates production baseline |
| Manufacturing Overhead (Deprec.) | RMB 0.07m (5.67%) | RMB 4.97m (14.24%) | RMB 15.13m (8.83%) | RMB 13.83m (5.96%) | Diluted by testing scale and platform volume |
| Outsourced OSAT Processing | RMB 0.001m (0.10%) | RMB 1.83m (5.24%) | RMB 11.67m (6.81%) | RMB 12.61m (5.43%) | External dicing, thinning, and sorting pass-through |
| Direct Labor Allocation | RMB 1.06m (88.79%) | RMB 1.09m (3.12%) | RMB 5.63m (3.28%) | RMB 3.96m (1.71%) | Reallocated from manual service to automated flow |
| Total Cost of Goods Sold (COGS) | RMB 1.20m (100.0%) | RMB 34.95m (100.0%) | RMB 171.36m (100.0%) | RMB 232.00m (100.0%) | Scaled alongside commercial volume output |
Infrastructure Layout and Regional Moats
Shanghai Xphor Technology Co., Ltd. maintains its operational headquarters at 1030 Tongpu Road, Putuo District, Shanghai, encompassing core circuit architecture, process design kit (PDK) compilation, and proprietary wafer-level (CP) and final chip-level (FT) automated electro-optical test operations. Off-shore administrative and technical representation is executed through Xphor Pte. Ltd. (Singapore) and Xphor Inc. (Delaware, United States). Inactive domestic affiliate Nanjing Xiguang was officially liquidated in February 2026.
Wafer fabrication is entirely outsourced across external foundries. Supplier A accounted for procurement shares of 54.54% (RMB 11.14 million) in 2023, 83.75% (RMB 59.20 million) in 2024, 86.56% (RMB 214.22 million) in 2025, and 90.08% (RMB 286.87 million) in 1H 2026, with top-five supplier concentration reaching 97.31%. Advance payments to Supplier A totaled RMB 140.00 million, or 81.59% of total prepayments at the end of 1H 2026. Secondary and tertiary foundry options remained constrained, with Supplier B absorbing 3.53% of procurement in 1H 2026 and Supplier C dropping below 2.00%.
Back-end packaging, thinning, and dicing (OSAT) are distributed among third parties, including Suzhou Jingxi Semiconductor Co., Ltd. and ShunYun Technology Holdings Limited Taiwan Branch (Taiwan, Province of China), the latter representing 1.88% of 1H 2026 procurement.
Geographic revenue generation has pivoted from domestic concentrations toward export markets:
* Domestic Eastern China: RMB 6.16 million (98.86%) in 2023, RMB 68.71 million (96.85%) in 2024, RMB 80.89 million (17.55%) in 2025, and RMB 59.36 million (10.43%) in 1H 2026.
* Domestic Southern China: RMB 1.69 million (2.38%) in 2024, RMB 63.77 million (13.84%) in 2025, and RMB 91.81 million (16.13%) in 1H 2026.
* Domestic Southwestern China: RMB 0.29 million (0.40%) in 2024, RMB 61.32 million (13.30%) in 2025, and RMB 94.48 million (16.60%) in 1H 2026 (including optical module clients such as Chengdu Ebyte / Zhongji InnoLight / Eoptolink supply chains).
* Domestic Central and Northern China: Central generated RMB 30.25 million (5.31%) in 1H 2026; Northern generated RMB 69.33 million (12.18%) in 1H 2026.
* Export Markets: Scaled from RMB 0.07 million (1.14%) in 2023 to RMB 218.98 million (47.51%) in 2025 and RMB 223.89 million (39.34%) in 1H 2026, anchored by direct optical interconnect supply to Customer A, a North American cloud service provider.
HDIN Institutional Verdict
Management positions Shanghai Xphor Technology Co., Ltd. as an unencumbered beneficiary of hyperscale AI clustering, citing its 13% global market share in 2025 and technological parity in 200G/lane Mach-Zehnder Modulators (Vpi at 6.5V, electro-optic bandwidth >55GHz, insertion loss <11dB). However, operational and forensic verification qualifies this outlook across three structural choke points:
1. Divergence Between Accrual Profits and Liquidity Realization: The company booked RMB 336.59 million in cumulative net profits across 2025 and 1H 2026, while generating negative RMB 11.05 million in combined operating cash flow. The dual burden of funding Supplier A via unreturned prepayments (RMB 161.65 million) while financing downstream module leaders via unsecured receivables (RMB 315.04 million) creates working capital attrition that forces reliance on its proposed RMB 1.83 billion initial public offering.
2. Engineering Friction in Secondary Foundry Integration: Initial qualification runs at a new manufacturing platform in 1H 2026 suffered yield deficits, resulting in an immediate contract halt, an inventory write-down of RMB 26.11 million, a prepayment impairment of RMB 10.29 million, and scrap compensation of RMB 3.75 million (aggregate P&L damage of RMB 40.16 million). Unit sensitivity modeling indicates that a 10% increase in baseline wafer pricing compresses gross margin by 355 basis points in 1H 2026, while a 5% yield degradation degrades margins by 198 basis points.
3. Customer Intermediary Overhang and Over-the-Horizon Amortization: Top-five customer revenue concentration stood at 92.26% in 1H 2026, with Customer A accounting for 55.55% and optical module manufacturer Customer B taking 25.85% (consolidated end-market basis). Downstream optical module assemblers like Zhongji InnoLight Co., Ltd. and Eoptolink Technology Inc. maintain active internal PIC design programs, threatening independent merchant supplier allocations once proprietary yields stabilize. Concurrently, mandatory share-based payment amortizations will impose pre-tax non-cash deductions of RMB 48.00 million in 2026, RMB 60.95 million in 2027, and RMB 55.23 million in 2028.
Presentation Download & Video Access:
- Presentation Download: Click the PDF download link under 'Related Topics' to access the full institutional presentation of this report.
- Video Link: Click this link to watch the HDIN analyst briefing on YouTube.
About HDIN Research:
HDIN Research is a premier global market intelligence and strategic advisory firm specializing in institutional-grade financial analysis, supply chain audits, and macroeconomic forecasting. Our dedicated sector analysts deliver actionable, data-driven insights tailored for private equity, hedge funds, and corporate strategy teams. Visit us at http://www.hdinresearch.com.
2026 AI Transparency Footer:
This intelligence report was authored by HDIN Research analysts following a rigorous audit of official corporate filings. AI was utilized for massive-scale data synthesis and structural drafting, ensuring 100% inclusion of reported data points. All strategic insights, financial modeling, and final verdicts were verified by our editorial board to ensure professional accuracy and compliance with 2026 Google Search E-E-A-T standards.