DEEP Robotics: Industrial Fleet Deployment Near Hangzhou Hub as Unit Production Costs Drop 43% Signals Scaled Commercial Manufacturing
Date : 2026-10-07
Reading : 124
HDIN Executive Takeaways
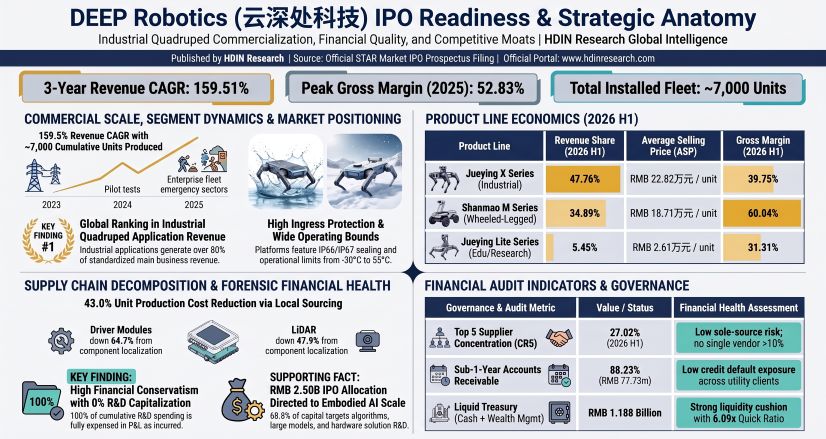
1. DEEP Robotics achieved the #1 global ranking in industrial quadruped robotics revenue in 2025, scaling top-line revenue at a 159.51% three-year CAGR from RMB 50.11 million in 2023 to RMB 337.49 million in 2025.
2. Production capacity transitioned from leased sites in Hangzhou and Huzhou toward a self-owned 27,422 m² manufacturing base in Hangzhou's Xihu District, backed by an RMB 2.5025 billion STAR Market IPO capital plan.
3. Unit production costs for the core Jueying X series compressed 43.03% from RMB 230,300 in 2023 to RMB 131,200 in 2025, establishing an operating model with RMB 1.188 billion in liquid assets and zero R&D capitalization.
Figure DEEP Robotics IPO Readiness & Strategic Anatomy
 Segmental Realities and Margin Dynamics
DEEP Robotics operates an embodied artificial intelligence product matrix consisting of industrial quadrupeds (Jueying X series), light-duty commercial/educational quadrupeds (Jueying Lite series), industrial wheeled-legged robots (Shanmao M series), humanoid robotics platforms (DR series), proprietary integrated joints, and technical engineering services. In 2025, the company posted its first full-year net profit of RMB 28.68 million (8.50% net margin) before posting an interim net loss of RMB 8.81 million in the first half of 2026 due to R&D front-loading.
Table Product Portfolio Revenue Evolution, Unit Economics and Margin Performance Analysis (FY2023–1H 2026)
Consolidated financial performance across the full reporting period demonstrates underlying operational leverage:
* Consolidated Top-Line Revenue: Increased 105.94% in 2024 to RMB 103.20 million, and 227.02% in 2025 to RMB 337.49 million. In H1 2026, revenue rose 117.67% YoY to RMB 259.24 million.
* Consolidated Gross Profit Margin: Rose from 33.48% in 2023 to 38.76% in 2024 and 52.83% in 2025 (+1,935 bps over two years). The metric stood at 45.32% in H1 2026.
* Deducted Non-Recurring Net Profit: Shifted from RMB -28.55 million in 2023 and RMB -24.24 million in 2024 to positive RMB 15.12 million in 2025, before recording an interim operating deficit of RMB -18.60 million in H1 2026.
* Operating Cash Flow (OCF): Reached RMB 63.75 million in 2025 against RMB -29.26 million in 2023 and RMB -24.97 million in 2024. H1 2026 recorded RMB -25.31 million due to inventory prep and R&D disbursements.
* Working Capital Velocity: Days Sales Outstanding (DSO) compressed from 70.7 days in 2023 to 39.2 days in 2025 (46.0 days in H1 2026). Days Inventory Outstanding (DIO) accelerated from 296.7 days in 2023 to 203.9 days in 2025 and 145.4 days in H1 2026.
* R&D Expensing Accounting: Maintained a 0% capitalization rate across all reporting cycles. Cumulative research and development expenditures of RMB 234.65 million (RMB 32.18m in 2023, RMB 38.21m in 2024, RMB 84.30m in 2025, and RMB 79.96m in H1 2026) were expensed directly to the income statement.
CONSOLIDATED REVENUE AND OPERATING COST PROFILE (10K RMB)
2023 FY │ █████ 5,011.26 Rev ░░░ 3,333.51 COGS ▒▒▒ 3,218.45 R&D
2024 FY │ ██████████ 10,320.10 Rev ░░░░░░ 6,319.76 COGS ▒▒▒▒ 3,821.13 R&D
2025 FY │ █████████████████████████████████ 33,749.06 Rev ░░░░░░░░░░░░░░░ 15,917.79 COGS ▒▒▒▒▒▒▒▒ 8,430.06 R&D
2026 H1 │ █████████████████████████ 25,924.26 Rev ░░░░░░░░░░░░░ 14,174.43 COGS ▒▒▒▒▒▒▒ 7,995.76 R&D
Infrastructure Layout and Regional Footprint
DEEP Robotics structures its physical engineering, testing, and production network across Zhejiang Province, maintaining operational separation between software research, electromechanical testing, and volume system assembly.
Table Operating Facility Network, Real Estate Structure and Manufacturing Capability Deployment Overview
The production footprint operates an integrated product development (IPD) flexible manufacturing process, avoiding fixed mechanical transfer lines in favor of modular assembly cells:
* Actual Production Volume: 529 units in 2023, 1,086 units in 2024, 3,936 units in 2025, and 1,353 units in H1 2026. Cumulative production reached ~7,000 robotic units by mid-2026.
* Sales Volume Realized: 391 units in 2023, 896 units in 2024, 2,908 units in 2025, and 1,563 units in H1 2026.
* Production-to-Sales Ratios: Recorded at 73.91% in 2023, 82.50% in 2024, 73.88% in 2025, and 115.52% in H1 2026 as delivered products cleared field testing.
* Domestic Upstream Localization: Domestic sourcing represents over 85% of total hardware BOM costs. Driver module procurement costs dropped 64.67% between 2023 and 2025 (from RMB 3,396.76/unit to RMB 1,200.10/unit) via domestic suppliers including Shanghai Moshen, Kunshan Jingyue, and Zhejiang Heneng. LiDAR costs declined 47.87% (from RMB 4,633.73/unit to RMB 2,415.53/unit).
* Top-Five Supplier Concentration (CR5): Stood at 39.64% in 2023, 39.15% in 2024, 29.89% in 2025, and 27.02% in H1 2026. Custom machined metal components sourced from Suzhou Shengyuyan Precision (RMB 11.90m, 9.54% share in H1 2026) and Hangzhou Guiling Machinery (RMB 7.56m, 6.06% share) represent the primary raw material expense, accounting for 27.66% of H1 2026 procurement.
GEOGRAPHIC SALES BREAKDOWN EVOLUTION (10K RMB)
2023 FY │ ██████████████████ 4,458.80 Domestic (89.06%) ▓▓ 547.66 Overseas Exports (10.94%)
2024 FY │ ██████████████████ 9,291.72 Domestic (90.14%) ▓▓ 1,016.46 Overseas Exports (9.86%)
2025 FY │ ████████████████ 27,585.63 Domestic (81.88%) ▓▓▓▓ 6,104.41 Overseas Exports (18.12%)
2026 H1 │ █████████████████ 22,281.11 Domestic (86.18%) ▓▓▓ 3,572.50 Overseas Exports (13.82%)
In regional markets, domestic deployments represent 86.18% of main operations in H1 2026, anchored by utility contracts across State Grid Corporation of China and municipal projects. Direct exports span more than 50 countries and regions (including deployments with Singapore's SP Group, Switzerland's Leibstadt Nuclear Plant, and South Korea's LG CNS). Regional sales designations strictly follow United Nations naming conventions, recording domestic territories accordingly, including Taiwan, Province of China.
HDIN Institutional Verdict
DEEP Robotics has crossed from bespoke hardware prototyping to standardized mass assembly within industrial quadrupeds and wheeled-legged robotics. The company's unit economics—evidenced by a 43.03% compression in Jueying X unit production costs and a 60.04% gross margin on the Shanmao M line—confirm operating manufacturing leverage.
The investment model presents two structural frictions requiring monitoring:
1. Fiscal Cushion Dependency in Net Margins: Non-recurring items accounted for 47.28% of reported 2025 net profit (RMB 13.56 million of RMB 28.68 million net profit, including RMB 11.90 million in government grants and RMB 4.13 million in investment yields). Excluding non-operating items, true standalone core operating margin was 5.83% in 2025 and -10.54% in H1 2026.
2. Channel Concentration and Regulatory Exposure: Customer A accounted for 21.44% of H1 2026 revenues (RMB 55.58 million), exposing quarterly performance to strategic client order cadences. Furthermore, while grandfathered units (X30, Lite3, M20) clear current export frameworks, the July 2026 addition of advanced foreign mobile robots to the US FCC Covered List restricts US market entry for upcoming platforms such as the DR02 humanoid.
These dynamics are balanced by an RMB 1.188 billion liquid capital reserve (RMB 268.13 million cash plus RMB 919.65 million in structured treasury assets), a 6.09x quick ratio, an 88.23% sub-one-year receivable balance, and 100% expensed R&D accounting. Transition of manufacturing to the self-owned 27,422 m² Xihu facility will be central to supporting output capacity and absorbing the estimated RMB 63.62 million in post-construction annual depreciation.
Presentation Download & Video Access
Presentation Download: Click the PDF download link under 'Related Topics' to access the full institutional presentation of this report.
Video Link: Click this link to watch the HDIN analyst briefing on YouTube.
About HDIN Research
HDIN Research is a global market intelligence and strategic advisory firm specializing in institutional-grade financial analysis, supply chain audits, and macroeconomic forecasting. Our dedicated sector analysts deliver actionable, data-driven insights tailored for private equity, hedge funds, and corporate strategy teams. Visit us at http://www.hdinresearch.com.
2026 AI Transparency Footer
This intelligence report was authored by HDIN Research analysts following a rigorous audit of official corporate filings. AI was utilized for massive-scale data synthesis and structural drafting, ensuring 100% inclusion of reported data points. All strategic insights, financial modeling, and final verdicts were verified by our editorial board to ensure professional accuracy and compliance with 2026 Google Search E-E-A-T standards.
1. DEEP Robotics achieved the #1 global ranking in industrial quadruped robotics revenue in 2025, scaling top-line revenue at a 159.51% three-year CAGR from RMB 50.11 million in 2023 to RMB 337.49 million in 2025.
2. Production capacity transitioned from leased sites in Hangzhou and Huzhou toward a self-owned 27,422 m² manufacturing base in Hangzhou's Xihu District, backed by an RMB 2.5025 billion STAR Market IPO capital plan.
3. Unit production costs for the core Jueying X series compressed 43.03% from RMB 230,300 in 2023 to RMB 131,200 in 2025, establishing an operating model with RMB 1.188 billion in liquid assets and zero R&D capitalization.
Figure DEEP Robotics IPO Readiness & Strategic Anatomy
Segmental Realities and Margin DynamicsDEEP Robotics operates an embodied artificial intelligence product matrix consisting of industrial quadrupeds (Jueying X series), light-duty commercial/educational quadrupeds (Jueying Lite series), industrial wheeled-legged robots (Shanmao M series), humanoid robotics platforms (DR series), proprietary integrated joints, and technical engineering services. In 2025, the company posted its first full-year net profit of RMB 28.68 million (8.50% net margin) before posting an interim net loss of RMB 8.81 million in the first half of 2026 due to R&D front-loading.
Table Product Portfolio Revenue Evolution, Unit Economics and Margin Performance Analysis (FY2023–1H 2026)
| Product Line | Metric | FY2023 | FY2024 | FY2025 | 1H 2026 | Trajectory and Structural Driver |
|---|---|---|---|---|---|---|
| Industrial Quadrupeds(Jueying X: X20/X30/X30 Pro) | Revenue (RMB 10K) | 3,966.41 | 6,989.23 | 19,576.35 | 12,347.93 | Primary revenue contributor; scaled across power grid and industrial inspection applications |
| Revenue Share of Main Business (%) | 79.23% | 67.80% | 58.11% | 47.76% | Revenue mix diversified as Shanmao M platform commercialized | |
| Sales Volume (Units) | 111 | 266 | 681 | 541 | Cumulative FY2023–FY2025 volume expanded 6.13× | |
| Average Selling Price (RMB 10K) | 35.73 | 26.28 | 28.75 | 22.82 | Pricing affected by X30 Pro launch and enterprise volume discounts | |
| Unit Cost (RMB 10K) | 23.03 | 15.91 | 13.12 | 13.75 | Unit manufacturing cost reduced 43.03% from FY2023 to FY2025 through localized procurement | |
| Gross Margin (%) | 35.55% | 39.44% | 54.35% | 39.75% | Expanded 1,880 bps through FY2025 before H1 2026 strategic pricing adjustments | |
| Light-Duty Quadrupeds(Jueying Lite: Lite2/Lite3) | Revenue (RMB 10K) | 936.76 | 1,844.70 | 5,130.16 | 1,409.65 | Academic and developer-focused products shifted toward secondary commercial positioning |
| Revenue Share of Main Business (%) | 18.71% | 17.90% | 15.23% | 5.45% | Declining contribution as industrial platforms gained scale | |
| Sales Volume (Units) | 280 | 630 | 1,850 | 540 | FY2025 volume peak driven by Lite3 adoption | |
| Average Selling Price (RMB 10K) | 3.35 | 2.93 | 2.77 | 2.61 | Lower pricing strategy supported market expansion | |
| Unit Cost (RMB 10K) | 2.65 | 1.84 | 1.70 | 1.79 | Assembly optimization reduced manufacturing cost base | |
| Gross Margin (%) | 20.75% | 37.31% | 38.52% | 31.31% | Maintained within approximately 31%–38% range | |
| Wheeled-Legged Robots(Shanmao M: M20/M20S/S10) | Revenue (RMB 10K) | — | — | 7,448.91 | 9,020.56 | Rapid commercialization in industrial inspection and logistics scenarios |
| Revenue Share of Main Business (%) | — | — | 22.11% | 34.89% | Became a major operating pillar within 18 months of launch | |
| Sales Volume (Units) | — | — | 377 | 482 | Fleet deployment supported commercial volume expansion | |
| Average Selling Price (RMB 10K) | — | — | 19.76 | 18.71 | Industrial utility pricing model | |
| Unit Cost (RMB 10K) | — | — | 8.40 | 7.48 | Shared platform components reduced initial manufacturing costs | |
| Gross Margin (%) | — | — | 57.50% | 60.04% | Highest-margin scaled platform supporting earnings improvement | |
| Humanoid Platforms(DR Series: DR01/DR02) | Revenue (RMB 10K) | — | 117.11 | 82.30 | 278.93 | Pre-industrial validation stage with DR02 featuring IP66 protection capability |
| Revenue Share of Main Business (%) | — | 1.14% | 0.24% | 1.08% | Early-stage pilot deliveries to research and industrial partners | |
| Sales Volume (Units) | — | 3 | 1 | 6 | Engineering verification-scale shipments | |
| Average Selling Price (RMB 10K) | — | 39.04 | 82.30 | 46.49 | Customized hardware configuration drove premium pricing | |
| Unit Cost (RMB 10K) | — | 51.26 | 25.73 | 14.71 | Unit cost declined 71.30% from FY2024 to 1H 2026 | |
| Gross Margin (%) | — | -31.32% | 68.74% | 68.37% | Transitioned from negative margin to profitable specialized production | |
| Proprietary Components(Integrated Joints, Batteries) | Revenue (RMB 10K) | 71.64 | 636.14 | 1,195.01 | 2,194.07 | Commercialization of modular joint actuators including J60, J80 and J100 series |
| Revenue Share of Main Business (%) | 1.43% | 6.17% | 3.55% | 8.49% | Increasing external monetization of core robotics components | |
| Gross Margin (%) | 56.79% | 37.78% | 56.16% | 32.12% | Margin varies with joint versus battery product mix | |
| Technical & Custom Services(NRE, Maintenance, Lease) | Revenue (RMB 10K) | 31.64 | 720.99 | 257.30 | 602.47 | NRE prototype testing, maintenance and software integration services |
| Revenue Share of Main Business (%) | 0.63% | 6.99% | 0.76% | 2.33% | Remains complementary to hardware-driven revenue model | |
| Gross Margin (%) | 92.16% | 47.13% | 64.53% | 9.38% | H1 2026 affected by dedicated prototype fabrication costs | |
| Total Main Business Revenue | Revenue (RMB 10K) | 5,006.45 | 10,308.18 | 33,690.04 | 25,853.61 | Core operations accounted for more than 99.7% of consolidated revenue |
Consolidated financial performance across the full reporting period demonstrates underlying operational leverage:
* Consolidated Top-Line Revenue: Increased 105.94% in 2024 to RMB 103.20 million, and 227.02% in 2025 to RMB 337.49 million. In H1 2026, revenue rose 117.67% YoY to RMB 259.24 million.
* Consolidated Gross Profit Margin: Rose from 33.48% in 2023 to 38.76% in 2024 and 52.83% in 2025 (+1,935 bps over two years). The metric stood at 45.32% in H1 2026.
* Deducted Non-Recurring Net Profit: Shifted from RMB -28.55 million in 2023 and RMB -24.24 million in 2024 to positive RMB 15.12 million in 2025, before recording an interim operating deficit of RMB -18.60 million in H1 2026.
* Operating Cash Flow (OCF): Reached RMB 63.75 million in 2025 against RMB -29.26 million in 2023 and RMB -24.97 million in 2024. H1 2026 recorded RMB -25.31 million due to inventory prep and R&D disbursements.
* Working Capital Velocity: Days Sales Outstanding (DSO) compressed from 70.7 days in 2023 to 39.2 days in 2025 (46.0 days in H1 2026). Days Inventory Outstanding (DIO) accelerated from 296.7 days in 2023 to 203.9 days in 2025 and 145.4 days in H1 2026.
* R&D Expensing Accounting: Maintained a 0% capitalization rate across all reporting cycles. Cumulative research and development expenditures of RMB 234.65 million (RMB 32.18m in 2023, RMB 38.21m in 2024, RMB 84.30m in 2025, and RMB 79.96m in H1 2026) were expensed directly to the income statement.
CONSOLIDATED REVENUE AND OPERATING COST PROFILE (10K RMB)
2023 FY │ █████ 5,011.26 Rev ░░░ 3,333.51 COGS ▒▒▒ 3,218.45 R&D
2024 FY │ ██████████ 10,320.10 Rev ░░░░░░ 6,319.76 COGS ▒▒▒▒ 3,821.13 R&D
2025 FY │ █████████████████████████████████ 33,749.06 Rev ░░░░░░░░░░░░░░░ 15,917.79 COGS ▒▒▒▒▒▒▒▒ 8,430.06 R&D
2026 H1 │ █████████████████████████ 25,924.26 Rev ░░░░░░░░░░░░░ 14,174.43 COGS ▒▒▒▒▒▒▒ 7,995.76 R&D
Infrastructure Layout and Regional Footprint
DEEP Robotics structures its physical engineering, testing, and production network across Zhejiang Province, maintaining operational separation between software research, electromechanical testing, and volume system assembly.
Table Operating Facility Network, Real Estate Structure and Manufacturing Capability Deployment Overview
| Operating Facility Category | Geographic Location | Real Estate Structure and Area (m²) | Lease / Ownership Period | Operational Mandate |
|---|---|---|---|---|
| Corporate Headquarters & Software Development Hub | Zijin Dream Plaza, Xihu District, Hangzhou, Zhejiang | Leased commercial office space (4,483.91 m²) | Lease term: June 2026 – May 2029 | Executive headquarters, AI algorithm development, and DeepVLA foundation model training |
| R&D and Durability Testing Center | Lansheng Jihong Complex, Xihu District, Hangzhou | Leased industrial/commercial facility (4,591.18 m²) | Lease term: June 2021 – July 2027 | Joint actuator lifecycle testing, environmental MTBF qualification, and dynamic gait simulation |
| Assembly and Custom Integration Facility | Wulian Industrial Park, Xihu District, Hangzhou | Leased manufacturing facility (7,179.31 m²) | Lease term: May 2025 – May 2030 | Intermediate chassis assembly, specialized sensor payload integration, and production burn-in testing |
| Primary Mass Production Facility | Deqing Geographic Information Town, Huzhou, Zhejiang | Leased manufacturing facility operated through Huzhou DEEP Robotics Co., Ltd. (3,454.10 m²) | Lease term: April 2024 – April 2027 | Core production line for Jueying X quadruped robots and Shanmao M wheeled-legged robot platforms |
| Future Integrated Manufacturing Base | Xihu District Industrial Parcel, Hangzhou | Self-owned industrial land parcel (27,422.00 m² site area) | 50-year industrial land-use right | IPO investment target for automated manufacturing, high-density testing facilities, and integrated corporate campus development |
| Regional Enterprise Channel Hubs | Beijing, Shenzhen, and Xiong’an | Leased commercial office suites | Ongoing commercial leases | Key account management and delivery coordination for strategic customers including State Grid, petrochemical companies, and telecommunications partners |
The production footprint operates an integrated product development (IPD) flexible manufacturing process, avoiding fixed mechanical transfer lines in favor of modular assembly cells:
* Actual Production Volume: 529 units in 2023, 1,086 units in 2024, 3,936 units in 2025, and 1,353 units in H1 2026. Cumulative production reached ~7,000 robotic units by mid-2026.
* Sales Volume Realized: 391 units in 2023, 896 units in 2024, 2,908 units in 2025, and 1,563 units in H1 2026.
* Production-to-Sales Ratios: Recorded at 73.91% in 2023, 82.50% in 2024, 73.88% in 2025, and 115.52% in H1 2026 as delivered products cleared field testing.
* Domestic Upstream Localization: Domestic sourcing represents over 85% of total hardware BOM costs. Driver module procurement costs dropped 64.67% between 2023 and 2025 (from RMB 3,396.76/unit to RMB 1,200.10/unit) via domestic suppliers including Shanghai Moshen, Kunshan Jingyue, and Zhejiang Heneng. LiDAR costs declined 47.87% (from RMB 4,633.73/unit to RMB 2,415.53/unit).
* Top-Five Supplier Concentration (CR5): Stood at 39.64% in 2023, 39.15% in 2024, 29.89% in 2025, and 27.02% in H1 2026. Custom machined metal components sourced from Suzhou Shengyuyan Precision (RMB 11.90m, 9.54% share in H1 2026) and Hangzhou Guiling Machinery (RMB 7.56m, 6.06% share) represent the primary raw material expense, accounting for 27.66% of H1 2026 procurement.
GEOGRAPHIC SALES BREAKDOWN EVOLUTION (10K RMB)
2023 FY │ ██████████████████ 4,458.80 Domestic (89.06%) ▓▓ 547.66 Overseas Exports (10.94%)
2024 FY │ ██████████████████ 9,291.72 Domestic (90.14%) ▓▓ 1,016.46 Overseas Exports (9.86%)
2025 FY │ ████████████████ 27,585.63 Domestic (81.88%) ▓▓▓▓ 6,104.41 Overseas Exports (18.12%)
2026 H1 │ █████████████████ 22,281.11 Domestic (86.18%) ▓▓▓ 3,572.50 Overseas Exports (13.82%)
In regional markets, domestic deployments represent 86.18% of main operations in H1 2026, anchored by utility contracts across State Grid Corporation of China and municipal projects. Direct exports span more than 50 countries and regions (including deployments with Singapore's SP Group, Switzerland's Leibstadt Nuclear Plant, and South Korea's LG CNS). Regional sales designations strictly follow United Nations naming conventions, recording domestic territories accordingly, including Taiwan, Province of China.
HDIN Institutional Verdict
DEEP Robotics has crossed from bespoke hardware prototyping to standardized mass assembly within industrial quadrupeds and wheeled-legged robotics. The company's unit economics—evidenced by a 43.03% compression in Jueying X unit production costs and a 60.04% gross margin on the Shanmao M line—confirm operating manufacturing leverage.
The investment model presents two structural frictions requiring monitoring:
1. Fiscal Cushion Dependency in Net Margins: Non-recurring items accounted for 47.28% of reported 2025 net profit (RMB 13.56 million of RMB 28.68 million net profit, including RMB 11.90 million in government grants and RMB 4.13 million in investment yields). Excluding non-operating items, true standalone core operating margin was 5.83% in 2025 and -10.54% in H1 2026.
2. Channel Concentration and Regulatory Exposure: Customer A accounted for 21.44% of H1 2026 revenues (RMB 55.58 million), exposing quarterly performance to strategic client order cadences. Furthermore, while grandfathered units (X30, Lite3, M20) clear current export frameworks, the July 2026 addition of advanced foreign mobile robots to the US FCC Covered List restricts US market entry for upcoming platforms such as the DR02 humanoid.
These dynamics are balanced by an RMB 1.188 billion liquid capital reserve (RMB 268.13 million cash plus RMB 919.65 million in structured treasury assets), a 6.09x quick ratio, an 88.23% sub-one-year receivable balance, and 100% expensed R&D accounting. Transition of manufacturing to the self-owned 27,422 m² Xihu facility will be central to supporting output capacity and absorbing the estimated RMB 63.62 million in post-construction annual depreciation.
Presentation Download & Video Access
Presentation Download: Click the PDF download link under 'Related Topics' to access the full institutional presentation of this report.
Video Link: Click this link to watch the HDIN analyst briefing on YouTube.
About HDIN Research
HDIN Research is a global market intelligence and strategic advisory firm specializing in institutional-grade financial analysis, supply chain audits, and macroeconomic forecasting. Our dedicated sector analysts deliver actionable, data-driven insights tailored for private equity, hedge funds, and corporate strategy teams. Visit us at http://www.hdinresearch.com.
2026 AI Transparency Footer
This intelligence report was authored by HDIN Research analysts following a rigorous audit of official corporate filings. AI was utilized for massive-scale data synthesis and structural drafting, ensuring 100% inclusion of reported data points. All strategic insights, financial modeling, and final verdicts were verified by our editorial board to ensure professional accuracy and compliance with 2026 Google Search E-E-A-T standards.