DayOne Data Centers Limited: Capitalized Interest Surges 57.1% Near Johor Campuses as Expansion Signals Free Cash Flow Deficit
Date : 2026-10-07
Reading : 528
HDIN Executive Takeaways
1. DayOne Data Centers Limited generated US$512.0 million in H1 2026 revenue, up 238.0% year-over-year, yet burned negative US$3.10 billion in Free Cash Flow amid a US$11.4 billion backlog build-out.
2. Malaysia accounted for 87.0% of H1 2026 revenue, led by Nusajaya Tech Park and Kempas Tech Park, while Customer A comprised 69.2% of top-line receipts.
3. The platform holds US$5.20 billion in total available liquidity to navigate floating-rate debt hurdles, including a US$2.60 billion maturity concentration falling due in 2030.
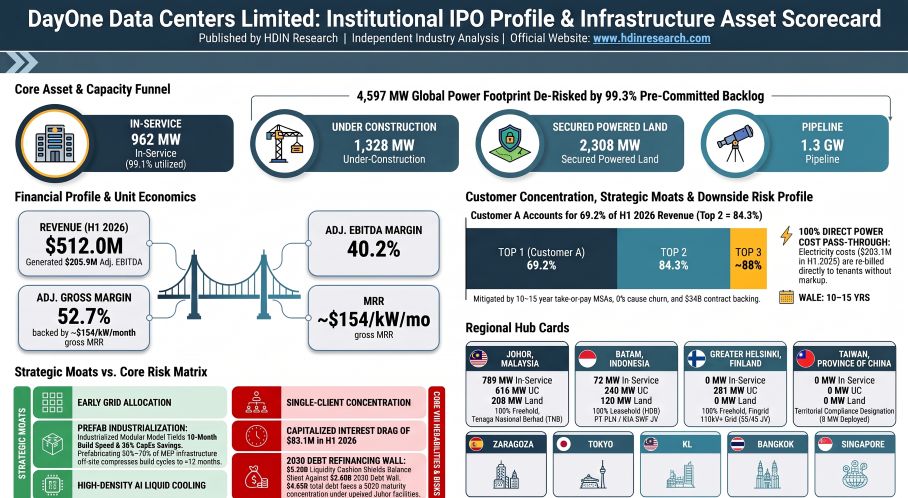
Figure DayOne Data Centers Limited Institutional lPO Profile & Infrastructure Asset Scorecard
 Segmental Realities and Margin Compression
DayOne Data Centers Limited [Cayman Islands Exempted Company] operates as a single reportable operating segment under US GAAP (ASC 280), disaggregating revenue primarily across Data Center Services, Managed Hosting Services, and Cross-Connect interconnections. Data Center Services accounted for US$511.8 million, or 99.96%, of consolidated revenue in H1 2026. Top-line revenue scaled from US$178.1 million in FY2024 to US$484.3 million in FY2025 (+171.9% YoY) and reached US$512.0 million in H1 2026 (+238.0% YoY).
Table Financial Performance, Data Center Capacity and Capital Intensity Analysis (FY2024–H1 2026)
GAAP Gross Margin compressed by 250 basis points from 29.1% in H1 2025 to 26.6% in H1 2026. This compression was dictated by a 287.3% expansion in facility depreciation within Cost of Revenue, scaling from US$33.9 million to US$131.2 million as capital-intensive builds reached Ready-for-Service status. Adding back depreciation and US$2.4 million in equity compensation yields an Adjusted Gross Margin of 52.7% (US$270.0 million).
Operating leverage improved as General and Administrative expenses dropped from 29.1% to 15.0% of revenue in H1 2026. Adjusted EBITDA rose to US$205.9 million (40.2% margin) in H1 2026. Non-GAAP add-backs in H1 2026 included US$40.4 million in share-based compensation, US$27.1 million in foreign exchange losses, and a US$62.0 million one-time cash settlement fee paid in June 2026 to terminate legacy customer support fee agreements with former parent GDS Holdings Limited [NASDAQ: GDS; HKEX: 9698].
DayOne Data Centers Limited’s balance sheet reflects severe upfront capital commitments. Total funded debt reached US$4.86 billion as of June 30, 2026 (US$4.43 billion in bank borrowings and mezzanine loans; US$430.4 million in finance lease obligations). Free Cash Flow burn reached negative US$3.10 billion in H1 2026, driven by US$3.11 billion in capital expenditures. Construction in Progress swelled to US$3.11 billion, resulting in US$83.1 million of capitalized interest in H1 2026 (57.1% of the US$145.4 million total interest incurred).
Total available liquidity stood at US$5.20 billion on June 30, 2026, comprising US$1.98 billion in cash and cash equivalents, US$1.40 billion in short-term investments, and US$1.82 billion in unutilized committed credit lines. In September 2026, the company expanded its credit runway by upsizing the Johor Loan Facilities I, lifting the offshore USD term loan to US$4.1 billion and the Malaysian Ringgit Murabahah tranche to MYR 13.0 billion (~US$3.2 billion).
Infrastructure Layout and Regional Moats
DayOne Data Centers Limited controls 4,597 MW of total Resources across 10 operating markets, supported by 2,281 MW in contracted Bookings and 1,100 MW in binding Reservations. In-Service capacity reached 962 MW as of September 20, 2026, with active Billings tracking at 953 MW (99.1% portfolio utilization).
The physical portfolio is 89.8% freehold and 10.2% leasehold across owned footprints. High-voltage utility access is anchored by direct agreements: Tenaga Nasional Berhad (TNB) in Malaysia, PT Perusahaan Listrik Negara (PLN) in Indonesia, Fingrid in Finland, and Red Eléctrica de España (REE) in Spain.
The modular execution model utilizes 50% to 70% containerized prefabricated Mechanical, Electrical, and Plumbing (MEP) infrastructure, standardizing delivery across four blueprints: ONEShell-Flex (64–192 MW), ONEShell-Ultra (64–192 MW), ONEFactory (80–400 MW), and ONEPOD (4–400 MW). Delivery cycles in Southeast Asia average under 12 months (reaching 10 months at Kempas Tech Park), compared to the 18-month regional benchmark, cutting capital expenditure by 20% to 30% per megawatt.
Geographic concentration remains high: Malaysia generated 87.0% of H1 2026 revenue (US$445.7 million), followed by Indonesia at 9.1% (US$46.4 million), Hong Kong SAR at 2.9% (US$15.0 million), and Greater Bangkok at 0.3% (US$1.7 million).
HDIN Institutional Verdict
DayOne Data Centers Limited pairs operational acceleration with structural single-counterparty exposure. Counterparty risk is heavily skewed: Customer A generated 69.2% of H1 2026 revenue (US$354.2 million), while Customer B accounted for 15.1% (US$77.3 million), concentrating 84.3% of revenue in two clients. Customer contracts are held at local operating affiliate levels rather than guaranteed by parent corporations, which pushed accounts receivable up to US$220.8 million as of June 30, 2026.
These client dependencies are partially mitigated by Master Service Agreements structured on a 10-to-15 year take-or-pay basis with contractual early termination penalties covering substantially all remaining fees across a US$34 billion contract backlog. Utility power risks are insulated: power expenses (US$203.1 million, or 39.7% of H1 2026 revenue) are billed through a 100% direct pass-through mechanism, and 86% of Billings are denominated in USD with 1.9% to 2.2% annual price escalators.
Long-Term Debt Amortization Schedule (US$4.43B Borrowings Profile)
2026 (H2): $77.8M [■]
2027: $535.2M [■■■]
2028: $325.6M [■■]
2029: $342.8M [■■]
2030: $2,598.6M [■■■■■■■■■■■■■■■■] <-- 58.7% Total Debt Refinancing Wall
2031-2032: $546.5M [■■]
Debt maturities introduce refinancing hurdles: 58.7% of total borrowings (US$2.60 billion) mature in 2030, driven by the Johor credit facilities. Substantially all funded long-term debt carries floating interest rates (weighted average 6.7%), with only 21.0% (US$862.0 million) hedged via interest rate swaps.
Regulatory, water, and grid frictions are escalating. While Singapore enforces a PUE cap of $\le$1.25 and Spain advances an 80% hourly renewable generation matching rule for data centers over 1 MW, DayOne Data Centers Limited faced local water-shortage protests near Nongsa Digital Park in Batam in late September 2026 due to evaporative cooling drawdowns. Furthermore, 1,300 MW of platform capacity resides in the non-binding Powered Land Pipeline without finalized utility interconnects.
Corporate governance limits outside investor intervention. The board utilizes a four-tier classified structure (Classes I–IV) where Class IV represents only 2 out of 8 seats. Amending these provisions requires an 85% supermajority shareholder vote alongside written consent from founder William Wei Huang. Delivering the US$11.4 billion backlog to meet the 2030 refinancing timeline will require flawless conversion of the 1,328 MW construction pipeline into operational Billings.
Presentation Download & Video Access:
- Presentation Download: Click the PDF download link under 'Related Topics' to access the full institutional presentation of this report.
- Video Link: Click this link to watch the HDIN analyst briefing on YouTube.
About HDIN Research:
HDIN Research is a premier global market intelligence and strategic advisory firm specializing in institutional-grade financial analysis, supply chain audits, and macroeconomic forecasting. Our dedicated sector analysts deliver actionable, data-driven insights tailored for private equity, hedge funds, and corporate strategy teams. Visit us at http://www.hdinresearch.com.
2026 AI Transparency Footer:
"This intelligence report was authored by HDIN Research analysts following a rigorous audit of official corporate filings. AI was utilized for massive-scale data synthesis and structural drafting, ensuring 100% inclusion of reported data points. All strategic insights, financial modeling, and final verdicts were verified by our editorial board to ensure professional accuracy and compliance with 2026 Google Search E-E-A-T standards."
1. DayOne Data Centers Limited generated US$512.0 million in H1 2026 revenue, up 238.0% year-over-year, yet burned negative US$3.10 billion in Free Cash Flow amid a US$11.4 billion backlog build-out.
2. Malaysia accounted for 87.0% of H1 2026 revenue, led by Nusajaya Tech Park and Kempas Tech Park, while Customer A comprised 69.2% of top-line receipts.
3. The platform holds US$5.20 billion in total available liquidity to navigate floating-rate debt hurdles, including a US$2.60 billion maturity concentration falling due in 2030.
Figure DayOne Data Centers Limited Institutional lPO Profile & Infrastructure Asset Scorecard
Segmental Realities and Margin CompressionDayOne Data Centers Limited [Cayman Islands Exempted Company] operates as a single reportable operating segment under US GAAP (ASC 280), disaggregating revenue primarily across Data Center Services, Managed Hosting Services, and Cross-Connect interconnections. Data Center Services accounted for US$511.8 million, or 99.96%, of consolidated revenue in H1 2026. Top-line revenue scaled from US$178.1 million in FY2024 to US$484.3 million in FY2025 (+171.9% YoY) and reached US$512.0 million in H1 2026 (+238.0% YoY).
Table Financial Performance, Data Center Capacity and Capital Intensity Analysis (FY2024–H1 2026)
| Financial & Unit Operational Metrics | FY2024 | FY2025 | H1 2025 | H1 2026 |
| Consolidated Top-Line Revenue (US$k) | $178,088 | $484,308 | $151,500 | $512,024 |
| Data Center Services Revenue (US$k) | $171,321 | $483,953 | $151,364 | $511,820 |
| Managed Hosting Services (US$k) | $5,878 | $0 | $0 | $0 |
| Cross-Connect / Interconnection (US$k) | $889 | $355 | $136 | $204 |
| GAAP Gross Profit / Margin (%) | $50,506 (28.4%) | $143,975 (29.7%) | $44,024 (29.1%) | $136,432 (26.6%) |
| (+) Depreciation in Cost of Revenue (US$k) | $42,042 | $120,318 | $33,866 | $131,167 |
| (+) Share-Based Compensation in Cost of Revenue (US$k) | $0 | $3,014 | $0 | $2,404 |
| Adjusted Gross Profit / Margin (%) | $92,548 (52.0%) | $267,307 (55.2%) | $77,890 (51.4%) | $270,003 (52.7%) |
| GAAP Operating Loss / Margin (%) | $(4,148) (-2.3%) | $(311,565) (-64.3%) | $(5) (-0.0%) | $(40,308) (-7.9%) |
| GAAP Net Loss / Margin (%) | $(57,593) (-32.3%) | $(367,062) (-75.8%) | $(12,573) (-8.3%) | $(77,209) (-15.1%) |
| Adjusted EBITDA / Margin (%) | $56,232 (31.6%) | $180,661 (37.3%) | $48,867 (32.3%) | $205,876 (40.2%) |
| Active Billings Capacity (Period-End MW) | 121 MW | 444 MW | 213 MW | 666 MW |
| Service Fee Monthly Revenue / Billed kW | ~$161 / kW / mo | ~$92 / kW / mo | ~$90 / kW / mo | ~$93 / kW / mo |
| Total Billed MRR / Billed kW (incl. Power) | ~$245 / kW / mo | ~$144 / kW / mo | ~$143 / kW / mo | ~$154 / kW / mo |
| Capital Expenditures (Cash Outflows, US$k) | $(953,120) | $(2,288,942) | $(919,933) | $(3,110,048) |
| Free Cash Flow Burn (OCF - CapEx, US$k) | $(990,732) | $(2,240,866) | $(922,723) | $(3,096,039) |
| Construction in Progress (CIP, US$k) | $892,700 | $1,522,700 | N/A | $3,109,100 |
| Total Interest Cost / Capitalized Interest (US$k) | $59,100 / $18,800 | $173,800 / $60,000 | N/A | $145,400 / $83,100 |
| Total Funded Debt (Borrowings + Leases, US$k) | $1,442,018 | $3,300,670 | N/A | $4,856,834 |
GAAP Gross Margin compressed by 250 basis points from 29.1% in H1 2025 to 26.6% in H1 2026. This compression was dictated by a 287.3% expansion in facility depreciation within Cost of Revenue, scaling from US$33.9 million to US$131.2 million as capital-intensive builds reached Ready-for-Service status. Adding back depreciation and US$2.4 million in equity compensation yields an Adjusted Gross Margin of 52.7% (US$270.0 million).
Operating leverage improved as General and Administrative expenses dropped from 29.1% to 15.0% of revenue in H1 2026. Adjusted EBITDA rose to US$205.9 million (40.2% margin) in H1 2026. Non-GAAP add-backs in H1 2026 included US$40.4 million in share-based compensation, US$27.1 million in foreign exchange losses, and a US$62.0 million one-time cash settlement fee paid in June 2026 to terminate legacy customer support fee agreements with former parent GDS Holdings Limited [NASDAQ: GDS; HKEX: 9698].
DayOne Data Centers Limited’s balance sheet reflects severe upfront capital commitments. Total funded debt reached US$4.86 billion as of June 30, 2026 (US$4.43 billion in bank borrowings and mezzanine loans; US$430.4 million in finance lease obligations). Free Cash Flow burn reached negative US$3.10 billion in H1 2026, driven by US$3.11 billion in capital expenditures. Construction in Progress swelled to US$3.11 billion, resulting in US$83.1 million of capitalized interest in H1 2026 (57.1% of the US$145.4 million total interest incurred).
Total available liquidity stood at US$5.20 billion on June 30, 2026, comprising US$1.98 billion in cash and cash equivalents, US$1.40 billion in short-term investments, and US$1.82 billion in unutilized committed credit lines. In September 2026, the company expanded its credit runway by upsizing the Johor Loan Facilities I, lifting the offshore USD term loan to US$4.1 billion and the Malaysian Ringgit Murabahah tranche to MYR 13.0 billion (~US$3.2 billion).
Infrastructure Layout and Regional Moats
DayOne Data Centers Limited controls 4,597 MW of total Resources across 10 operating markets, supported by 2,281 MW in contracted Bookings and 1,100 MW in binding Reservations. In-Service capacity reached 962 MW as of September 20, 2026, with active Billings tracking at 953 MW (99.1% portfolio utilization).
The physical portfolio is 89.8% freehold and 10.2% leasehold across owned footprints. High-voltage utility access is anchored by direct agreements: Tenaga Nasional Berhad (TNB) in Malaysia, PT Perusahaan Listrik Negara (PLN) in Indonesia, Fingrid in Finland, and Red Eléctrica de España (REE) in Spain.
The modular execution model utilizes 50% to 70% containerized prefabricated Mechanical, Electrical, and Plumbing (MEP) infrastructure, standardizing delivery across four blueprints: ONEShell-Flex (64–192 MW), ONEShell-Ultra (64–192 MW), ONEFactory (80–400 MW), and ONEPOD (4–400 MW). Delivery cycles in Southeast Asia average under 12 months (reaching 10 months at Kempas Tech Park), compared to the 18-month regional benchmark, cutting capital expenditure by 20% to 30% per megawatt.
Geographic concentration remains high: Malaysia generated 87.0% of H1 2026 revenue (US$445.7 million), followed by Indonesia at 9.1% (US$46.4 million), Hong Kong SAR at 2.9% (US$15.0 million), and Greater Bangkok at 0.3% (US$1.7 million).
HDIN Institutional Verdict
DayOne Data Centers Limited pairs operational acceleration with structural single-counterparty exposure. Counterparty risk is heavily skewed: Customer A generated 69.2% of H1 2026 revenue (US$354.2 million), while Customer B accounted for 15.1% (US$77.3 million), concentrating 84.3% of revenue in two clients. Customer contracts are held at local operating affiliate levels rather than guaranteed by parent corporations, which pushed accounts receivable up to US$220.8 million as of June 30, 2026.
These client dependencies are partially mitigated by Master Service Agreements structured on a 10-to-15 year take-or-pay basis with contractual early termination penalties covering substantially all remaining fees across a US$34 billion contract backlog. Utility power risks are insulated: power expenses (US$203.1 million, or 39.7% of H1 2026 revenue) are billed through a 100% direct pass-through mechanism, and 86% of Billings are denominated in USD with 1.9% to 2.2% annual price escalators.
Long-Term Debt Amortization Schedule (US$4.43B Borrowings Profile)
2026 (H2): $77.8M [■]
2027: $535.2M [■■■]
2028: $325.6M [■■]
2029: $342.8M [■■]
2030: $2,598.6M [■■■■■■■■■■■■■■■■] <-- 58.7% Total Debt Refinancing Wall
2031-2032: $546.5M [■■]
Debt maturities introduce refinancing hurdles: 58.7% of total borrowings (US$2.60 billion) mature in 2030, driven by the Johor credit facilities. Substantially all funded long-term debt carries floating interest rates (weighted average 6.7%), with only 21.0% (US$862.0 million) hedged via interest rate swaps.
Regulatory, water, and grid frictions are escalating. While Singapore enforces a PUE cap of $\le$1.25 and Spain advances an 80% hourly renewable generation matching rule for data centers over 1 MW, DayOne Data Centers Limited faced local water-shortage protests near Nongsa Digital Park in Batam in late September 2026 due to evaporative cooling drawdowns. Furthermore, 1,300 MW of platform capacity resides in the non-binding Powered Land Pipeline without finalized utility interconnects.
Corporate governance limits outside investor intervention. The board utilizes a four-tier classified structure (Classes I–IV) where Class IV represents only 2 out of 8 seats. Amending these provisions requires an 85% supermajority shareholder vote alongside written consent from founder William Wei Huang. Delivering the US$11.4 billion backlog to meet the 2030 refinancing timeline will require flawless conversion of the 1,328 MW construction pipeline into operational Billings.
Presentation Download & Video Access:
- Presentation Download: Click the PDF download link under 'Related Topics' to access the full institutional presentation of this report.
- Video Link: Click this link to watch the HDIN analyst briefing on YouTube.
About HDIN Research:
HDIN Research is a premier global market intelligence and strategic advisory firm specializing in institutional-grade financial analysis, supply chain audits, and macroeconomic forecasting. Our dedicated sector analysts deliver actionable, data-driven insights tailored for private equity, hedge funds, and corporate strategy teams. Visit us at http://www.hdinresearch.com.
2026 AI Transparency Footer:
"This intelligence report was authored by HDIN Research analysts following a rigorous audit of official corporate filings. AI was utilized for massive-scale data synthesis and structural drafting, ensuring 100% inclusion of reported data points. All strategic insights, financial modeling, and final verdicts were verified by our editorial board to ensure professional accuracy and compliance with 2026 Google Search E-E-A-T standards."