INOX Air Products Limited: Capital Inflection and Merchant Density Fuel 51.29% Margin Profile as 100% OFS Structure Yields Zero Primary Capital
Date : 2026-10-16
Reading : 107
HDIN Executive Takeaways
1. Revenue expanded at an 8.23% CAGR to ₹30,339.28 million in FY2026, while EBITDA reached ₹16,477.85 million (11.26% CAGR), lifting EBITDA margins 330 bps to 51.29% via fixed-cost dilution and power indexation.
2. Operating cash flows surged 46.7% YoY to ₹12,642.41 million in FY2026, turning Free Cash Flow positive to ₹1,027.94 million across a network spanning 57 operating hubs and 739 cryogenic transport units.
3. The planned public listing is structured as a 100% Offer for Sale (up to 77,156,663 shares), providing ₹0.00 in primary proceeds and leaving multi-billion-rupee expansion plans tethered entirely to internal accruals.
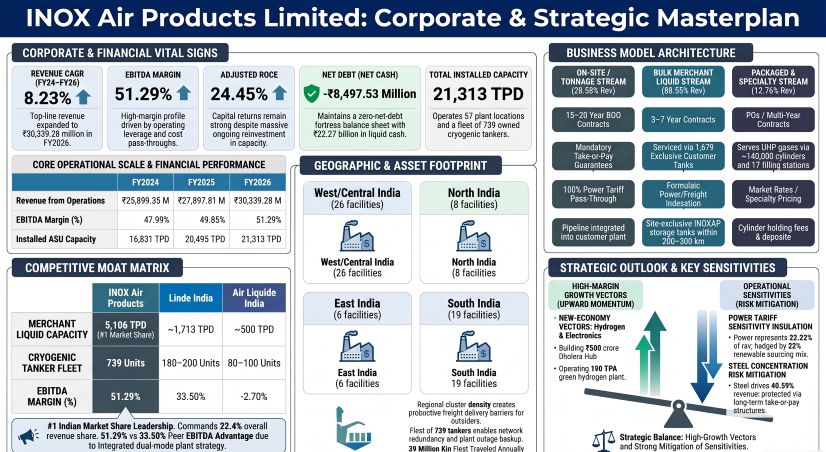
Figure INOX Air Products Limited Corporate & Strategic Masterplan
 Segmental Realities, Power Pass-Through Mechanics, and Unit Forensics
INOX Air Products Limited demonstrated accelerated financial and operational performance across the FY2024 to FY2026 reporting period. Revenue from operations advanced from ₹25,899.35 million in FY2024 to ₹27,897.81 million in FY2025 (up 7.72% YoY) and reached ₹30,339.28 million in FY2026 (up 8.75% YoY), reflecting an 8.23% CAGR. Total income increased at a 7.62% CAGR, rising from ₹27,737.46 million in FY2024 to ₹30,486.39 million in FY2025 and ₹32,128.69 million in FY2026.
Operational earnings outpaced top-line expansion. Restated Profit After Tax (PAT) rose from ₹7,656.86 million in FY2024 to ₹8,809.45 million in FY2025 and ₹9,138.70 million in FY2026, registering a 9.25% CAGR. PAT margins improved 84 bps over the period, moving from 27.60% in FY2024 to 28.90% in FY2025, before settling at 28.44% in FY2026.
Table INOX AIR PRODUCTS LIMITED: OPERATING AND FINANCIAL BASELINE (FY2024 – FY2026)
Because atmospheric air serves as the baseline input for cryogenic air separation units (ASUs), direct raw material costs accounted for 6.01% of revenue in FY2026 (₹1,822.04 million), down 162 bps from 7.63% (₹1,975.38 million) in FY2024, resulting in an implied gross margin of 93.99%.
The principal operating expenditure remains electricity, which totaled ₹6,741.49 million in FY2026, or 22.22% of revenue from operations and 32.79% of total operational costs. The company dampens grid volatility through a multi-tier structure:
* On-site supply contracts mandate 100% direct customer provision of power or formulaic tariff indexation. Under Ind AS 115, non-cash power supplied directly by customers reduced transaction prices by ₹2,944.21 million in FY2026, compared to ₹1,720.47 million in FY2025 and ₹1,283.85 million in FY2024.
* In the Merchant liquid vertical, master supply agreements embed escalation clauses tied to State Electricity Distribution Company (DISCOM) grid tariffs and commercial transport diesel benchmarks.
* Base-load exposure is hedged through a 22% renewable energy sourcing mix, divided between captive Power Purchase Agreements (78%) and 12.5 MWp of company-owned solar arrays (22%).
Table DISAGGREGATED REVENUE ARCHITECTURE BY VERTICAL AND MOLECULE (FY2024 – FY2026)
Forensic evaluation of unit economics underscores the capital intensity differential across production profiles:
* Gaseous ASU capacity demands ₹0.15 to ₹0.35 crore per tonne per day (TPD) for mega installations (>500 TPD). ArcelorMittal Nippon Steel India (AM/NS) Hazira’s 5th ASU (1,000 TPD combined) capitalized at ₹300 crore (₹0.30 crore/TPD).
* Liquefaction facilities require ₹0.35 to ₹0.50 crore/TPD at large scale (e.g., SAIL Bokaro’s 2,150 TPD ASU at ~₹750 crore or ₹0.349 crore/TPD), climbing to ₹0.75 to ₹0.96 crore/TPD for mid-scale units (200–500 TPD, such as Hosur's 200 TPD plant commissioned at ₹150 crore) and up to ₹1.20 to ₹1.71 crore/TPD for setups under 200 TPD.
* Asset depreciation is executed on a straight-line method (SLM) under Ind AS 16. ASU plant machinery operates on a 25-year schedule, vehicle platforms over 8 years, and solar infrastructure over 25 years. In FY2026, management harmonized building useful lives on customer sites to match underlying contract durations (15–20 years), booking an additional depreciation charge of ₹136.50 million.
* Capital Work-in-Progress (CWIP) grew to ₹14,147.43 million in FY2026 (21.28% of fixed assets), driven by the Tata Steel Meramandali installation (2 x 1,800 TPD, valued at ~$150 million). Aging checks confirm 99.6% of CWIP is under two years old (₹9,441.40 million <1 year; ₹4,652.65 million 1–2 years; ₹50.16 million 2–3 years; ₹3.22 million >3 years). Capitalized interest under Ind AS 23 stood at ₹91.17 million (8.59% of gross borrowing costs, capitalized at 7.29%), with FY2026 operating cash flow covering total interest obligations (₹1,068.59 million) by 11.83x.
Table COUNTERPARTY AGING SCHEDULE AND PROVISION COVERAGE (FY2024 – FY2026)
Customer credit structures indicate growing exposure to government cycles. While current accounts remained dominant (₹2,580.84 million), the 6-to-12-month delinquency tier expanded 246.9% YoY in FY2026 to ₹157.20 million, reflecting delayed milestone settlements in public sector undertakings (PSU) and state hospital tenders. Top-tier concentration remains pronounced: the single largest customer generated 12.23% of total FY2026 operational revenue (₹3,709.38 million), the top 5 generated 25.94% (₹7,871.38 million), and the top 10 generated 31.60% (₹9,586.96 million). Two long-term on-site counterparties accounted for ₹725.45 million, or 18.59%, of gross trade receivables in FY2026.
Infrastructure Layout, Industrial Exposure, and Strategic Logistical Moats
Total installed gas manufacturing capacity expanded to 21,313.42 TPD in FY2026, up from 16,831.29 TPD in FY2024 and 20,494.72 TPD in FY2025. Actual manufactured volume reached 17,669.79 TPD in FY2026, translating to an overall utilization rate of 82.90% (moderating from 91.71% in FY2024 and 86.67% in FY2025 as new mega-scale capacity stabilized).
Segmental throughput splits:
* Oxygen capacity reached 17,667.53 TPD (utilization: 80.24%), compared to 17,128.24 TPD in FY2025 and 13,925.70 TPD in FY2024.
* Nitrogen capacity reached 3,149.86 TPD, operating at a tight 99.30% capacity factor (vs. 2,893.43 TPD at 96.20% in FY2025).
* Argon capacity totaled 483.67 TPD (73.76% utilization) following the deployment of crude argon purification additions.
* Nitrous Oxide capacity was stable at 7.61 TPD, with utilization climbing to 81.63% from 61.75% in FY2024.
* Hydrogen production capacity reached 4.25 TPD across 7 Steam Methane Reformers (SMR) and 2 water electrolysis units (72.14% utilization).
Table REGIONAL ASSET ALLOCATION AND LOGISTICAL SPECIFICATIONS
Physical site distribution anchors a regional hub-and-spoke configuration. Logistics costs represented 12.60% of total operational expenditures in FY2026. Transport economics limit liquid truck runs to an optimal 200 km to 300 km delivery radius. By co-locating 28 merchant liquid hubs within key manufacturing belts and operating 739 cryogenic trailers, the company maintains network redundancy: plant trips trigger deliveries from secondary regional hubs, preserving contracted off-take.
Table SYSTEMIC END-MARKET DISTRIBUTION (FY2024 – FY2026)
Traditional heavy manufacturing represents the bulk of off-take: Steel increased its share to 40.59% of revenue in FY2026 (₹12,313.43 million), capturing 92.56% of dedicated On-Site TPD allocations. Concurrently, strategic focus has expanded into higher-margin electronics segments. Revenue from Solar PV operations reached 3.02% in FY2026 (₹916.36 million, up from ₹274.65 million in FY2024), while Electronics and Semiconductor streams expanded to 3.01% (₹913.13 million), supported by silane and high-purity nitrogen supply to domestic chip assembly and packaging facilities.
Table COMPETITIVE POSITIONING IN NON-CAPTIVE INDIAN INDUSTRIAL GAS (FY2026 MARKET SIZE: ₹135,160.8 MILLION)
HDIN Institutional Verdict
The operational and financial evidence for INOX Air Products reveals three structural divergence vectors that institutional capital must evaluate against broader sector assumptions:
Table STRUCTURAL BALANCE SHEET AND CASH ALLOCATION PROFILE
First, while the company completed a Free Cash Flow turnaround in FY2026 (+₹1,027.94 million), capital requirements remain intensive. CWIP of ₹14,147.43 million, coupled with short-term project deliveries—such as the 3,600 TPD Tata Steel Meramandali installation, the AM/NS Hazira expansion, and the planned ₹500 crore electronics specialty gas hub in Dholera, Gujarat—will continue to absorb cash. Because the upcoming IPO is an entirely promoter-focused Offer for Sale yielding zero net cash proceeds to the company balance sheet, ongoing execution will rely fully on debt facilities and internal operations.
Second, the contractual framework creates an asymmetric technology dynamic. INOX Air Products holds zero registered proprietary patents, relying on continuous equipment access from Air Products and Chemicals, Inc. Under the Inter-Se Agreement, capital goods must be directed toward Air Products and INOX India Limited (INOXCVA). In FY2026, capital equipment transactions with Air Products entities alone reached ₹3,232.88 million (₹2,796.75 million via Prodair Air Products India and ₹436.13 million directly from the US parent), while purchases from INOX India totaled ₹1,224.74 million.
Third, strategic flexibility is restricted by contractual covenants:
* Geographic expansion outside India is legally barred without the written consent of both promoters, limiting external opportunities in adjacent Asian or Middle Eastern markets.
* Effective April 1, 2027 (FY2028), the company will incur an ongoing brand royalty fee of 0.50% of annual operational revenues, split equally between Pavan Kumar Jain (0.25%) and Air Products and Chemicals, Inc. (0.25%).
* Governance mechanisms enforce strict operational controls: 31+ reserved strategic matters (including annual budgets, debt adjustments, and key managerial appointments) require unanimous approval from the 4-member Shareholder Committee. Any ownership dilution where the equity spread between the Jain Family Group and Air Products exceeds 20% dissolves this governance equality. A loss of the 20% minimum threshold automatically terminates the brand license, mandating the destruction of all branded trade assets, signage, tanker livery, and an enforced corporate name change within 60 days.
Presentation Download & Video Access:
- Presentation Download: Click the PDF download link under 'Related Topics' to access the full institutional presentation of this report.
- Video Link: Click this link to watch the HDIN analyst briefing on YouTube.
About HDIN Research:
HDIN Research is a premier global market intelligence and strategic advisory firm specializing in institutional-grade financial analysis, supply chain audits, and macroeconomic forecasting. Our dedicated sector analysts deliver actionable, data-driven insights tailored for private equity, hedge funds, and corporate strategy teams. Visit us at http://www.hdinresearch.com.
2026 AI Transparency Footer:
This intelligence report was authored by HDIN Research analysts following a rigorous audit of official corporate filings. AI was utilized for massive-scale data synthesis and structural drafting, ensuring 100% inclusion of reported data points. All strategic insights, financial modeling, and final verdicts were verified by our editorial board to ensure professional accuracy and compliance with 2026 Google Search E-E-A-T standards.
1. Revenue expanded at an 8.23% CAGR to ₹30,339.28 million in FY2026, while EBITDA reached ₹16,477.85 million (11.26% CAGR), lifting EBITDA margins 330 bps to 51.29% via fixed-cost dilution and power indexation.
2. Operating cash flows surged 46.7% YoY to ₹12,642.41 million in FY2026, turning Free Cash Flow positive to ₹1,027.94 million across a network spanning 57 operating hubs and 739 cryogenic transport units.
3. The planned public listing is structured as a 100% Offer for Sale (up to 77,156,663 shares), providing ₹0.00 in primary proceeds and leaving multi-billion-rupee expansion plans tethered entirely to internal accruals.
Figure INOX Air Products Limited Corporate & Strategic Masterplan
Segmental Realities, Power Pass-Through Mechanics, and Unit ForensicsINOX Air Products Limited demonstrated accelerated financial and operational performance across the FY2024 to FY2026 reporting period. Revenue from operations advanced from ₹25,899.35 million in FY2024 to ₹27,897.81 million in FY2025 (up 7.72% YoY) and reached ₹30,339.28 million in FY2026 (up 8.75% YoY), reflecting an 8.23% CAGR. Total income increased at a 7.62% CAGR, rising from ₹27,737.46 million in FY2024 to ₹30,486.39 million in FY2025 and ₹32,128.69 million in FY2026.
Operational earnings outpaced top-line expansion. Restated Profit After Tax (PAT) rose from ₹7,656.86 million in FY2024 to ₹8,809.45 million in FY2025 and ₹9,138.70 million in FY2026, registering a 9.25% CAGR. PAT margins improved 84 bps over the period, moving from 27.60% in FY2024 to 28.90% in FY2025, before settling at 28.44% in FY2026.
Table INOX AIR PRODUCTS LIMITED: OPERATING AND FINANCIAL BASELINE (FY2024 – FY2026)
| Financial / Operating Metric | FY2024 | FY2025 | FY2026 |
|---|---|---|---|
| Revenue from Operations (₹ million) | ₹25,899.35 | ₹27,897.81 | ₹30,339.28 |
| Total Income (₹ million) | ₹27,737.46 | ₹30,486.39 | ₹32,128.69 |
| EBITDA (₹ million) | ₹13,311.21 | ₹15,196.47 | ₹16,477.85 |
| EBITDA Margin (% of Total Income) | 47.99% | 49.85% | 51.29% |
| EBIT (₹ million) | ₹10,997.20 | ₹12,555.88 | ₹13,012.98 |
| Restated PAT (₹ million) | ₹7,656.86 | ₹8,809.45 | ₹9,138.70 |
| Raw Material Consumed (% of Revenue) | 7.63% (₹1,975.38) | 6.25% (₹1,742.90) | 6.01% (₹1,822.04) |
| Implied Gross Margin (%) | 92.37% | 93.75% | 93.99% |
| Power & Fuel Cost (₹ million) | ₹6,381.86 | ₹6,718.82 | ₹6,741.49 |
| Power & Fuel (% of Revenue) | 24.64% | 24.08% | 22.22% |
| Power & Fuel (% of Total Expenses) | 36.34% | 35.45% | 32.79% |
| Operating Cash Flow (OCF) (₹ million) | ₹8,937.21 | ₹8,614.93 | ₹12,642.41 |
| Free Cash Flow (FCF) (₹ million) | -₹1,248.66 | -₹3,979.09 | +₹1,027.94 |
| FCF Conversion (% of EBITDA) | -9.38% | -26.18% | +6.24% |
| OCF / EBITDA Conversion Ratio | 67.14% | 56.69% | 76.72% |
| Cash Paid for PPE / Capex (₹ million) | ₹10,185.87 | ₹12,594.02 | ₹11,614.47 |
| Additions to PPE & Intangibles (Accounting) (₹ million) | ₹8,386.44 | ₹15,301.73 | ₹5,482.55 |
| Capital Work-in-Progress (CWIP) (₹ million) | ₹7,733.12 | ₹8,042.15 | ₹14,147.43 |
| Outstanding Committed Capex (₹ million) | ₹16,574.60 | ₹7,650.63 | ₹4,244.73 |
| Total Debt (Borrowings + Leases) (₹ million) | ₹14,556.39 | ₹16,766.06 | ₹13,773.03 |
| Net Debt (₹ million) | -₹9,637.21 | -₹6,411.08 | -₹8,497.53 |
| Debt-to-Equity Ratio | 0.26x | 0.26x | 0.19x |
| Net Debt-to-Equity Ratio | -0.18x | -0.10x | -0.12x |
| Interest Coverage Ratio (EBITDA / Finance Cost) | 16.44x | 15.18x | 16.98x |
| Adjusted ROCE (%) | 30.24% | 27.58% | 24.45% |
| Return on Equity / RoNW (%) | 13.94% | 13.85% | 12.59% |
| Asset Turnover (Revenue / Total Assets) | 0.32x | 0.30x | 0.30x |
| Net PPE Turnover (Revenue / Net PPE) | 0.69x | 0.55x | 0.58x |
| Net Working Capital (₹ million) | ₹12,489.75 | ₹9,320.49 | ₹8,194.53 |
Because atmospheric air serves as the baseline input for cryogenic air separation units (ASUs), direct raw material costs accounted for 6.01% of revenue in FY2026 (₹1,822.04 million), down 162 bps from 7.63% (₹1,975.38 million) in FY2024, resulting in an implied gross margin of 93.99%.
The principal operating expenditure remains electricity, which totaled ₹6,741.49 million in FY2026, or 22.22% of revenue from operations and 32.79% of total operational costs. The company dampens grid volatility through a multi-tier structure:
* On-site supply contracts mandate 100% direct customer provision of power or formulaic tariff indexation. Under Ind AS 115, non-cash power supplied directly by customers reduced transaction prices by ₹2,944.21 million in FY2026, compared to ₹1,720.47 million in FY2025 and ₹1,283.85 million in FY2024.
* In the Merchant liquid vertical, master supply agreements embed escalation clauses tied to State Electricity Distribution Company (DISCOM) grid tariffs and commercial transport diesel benchmarks.
* Base-load exposure is hedged through a 22% renewable energy sourcing mix, divided between captive Power Purchase Agreements (78%) and 12.5 MWp of company-owned solar arrays (22%).
Table DISAGGREGATED REVENUE ARCHITECTURE BY VERTICAL AND MOLECULE (FY2024 – FY2026)
| Segment / Molecular Category | FY2024 (₹ million / %) | FY2025 (₹ million / %) | FY2026 (₹ million / %) |
|---|---|---|---|
| Merchant Bulk Liquid | ₹16,037.28 (61.9%) | ₹17,841.22 (64.0%) | ₹17,764.28 (58.6%) |
| On-Site / Tonnage Pipeline | ₹6,390.44 (24.7%) | ₹6,784.70 (24.3%) | ₹8,702.97 (28.7%) |
| Packaged & Specialty Gases | ₹3,471.64 (13.4%) | ₹3,271.89 (11.7%) | ₹3,872.03 (12.8%) |
| Non-Product Streams | — | — | — |
| └─ Lease Rental Income | ₹2,529.67 | ₹2,559.05 | ₹3,091.61 |
| └─ Sale of Services (O&M Charges) | ₹2,149.04 | ₹2,250.50 | ₹2,573.56 |
| └─ Other Operating Receipts / Scrap | ₹360.16 | ₹437.55 | ₹522.14 |
| Product Sales by Gas Type (Ind AS 115) | ₹20,860.48 (100%) | ₹22,650.71 (100%) | ₹24,151.97 (100%) |
| └─ Oxygen / Medical Oxygen | ₹9,555.46 (45.8%) | ₹11,095.64 (49.0%) | ₹11,915.98 (49.3%) |
| └─ Nitrogen | ₹5,783.77 (27.7%) | ₹6,060.84 (26.8%) | ₹6,204.97 (25.7%) |
| └─ Argon | ₹2,811.43 (13.5%) | ₹3,111.42 (13.7%) | ₹3,264.12 (13.5%) |
| └─ Helium | ₹1,352.63 (6.5%) | ₹577.28 (2.6%) | ₹569.54 (2.4%) |
| └─ Hydrogen | ₹455.00 (2.2%) | ₹474.63 (2.1%) | ₹529.01 (2.2%) |
| └─ Nitrous Oxide | ₹336.29 (1.6%) | ₹370.99 (1.6%) | ₹400.62 (1.7%) |
| └─ Silane | ₹11.12 (0.1%) | ₹137.85 (0.6%) | ₹236.50 (1.0%) |
| └─ Dissolved Acetylene | ₹180.68 (0.9%) | ₹196.95 (0.9%) | ₹161.60 (0.7%) |
| └─ Other (SF₆, CO₂, Ammonia, TMA, Rare Gases) | ₹374.11 (1.8%) | ₹625.11 (2.8%) | ₹869.62 (3.6%) |
Forensic evaluation of unit economics underscores the capital intensity differential across production profiles:
* Gaseous ASU capacity demands ₹0.15 to ₹0.35 crore per tonne per day (TPD) for mega installations (>500 TPD). ArcelorMittal Nippon Steel India (AM/NS) Hazira’s 5th ASU (1,000 TPD combined) capitalized at ₹300 crore (₹0.30 crore/TPD).
* Liquefaction facilities require ₹0.35 to ₹0.50 crore/TPD at large scale (e.g., SAIL Bokaro’s 2,150 TPD ASU at ~₹750 crore or ₹0.349 crore/TPD), climbing to ₹0.75 to ₹0.96 crore/TPD for mid-scale units (200–500 TPD, such as Hosur's 200 TPD plant commissioned at ₹150 crore) and up to ₹1.20 to ₹1.71 crore/TPD for setups under 200 TPD.
* Asset depreciation is executed on a straight-line method (SLM) under Ind AS 16. ASU plant machinery operates on a 25-year schedule, vehicle platforms over 8 years, and solar infrastructure over 25 years. In FY2026, management harmonized building useful lives on customer sites to match underlying contract durations (15–20 years), booking an additional depreciation charge of ₹136.50 million.
* Capital Work-in-Progress (CWIP) grew to ₹14,147.43 million in FY2026 (21.28% of fixed assets), driven by the Tata Steel Meramandali installation (2 x 1,800 TPD, valued at ~$150 million). Aging checks confirm 99.6% of CWIP is under two years old (₹9,441.40 million <1 year; ₹4,652.65 million 1–2 years; ₹50.16 million 2–3 years; ₹3.22 million >3 years). Capitalized interest under Ind AS 23 stood at ₹91.17 million (8.59% of gross borrowing costs, capitalized at 7.29%), with FY2026 operating cash flow covering total interest obligations (₹1,068.59 million) by 11.83x.
Table COUNTERPARTY AGING SCHEDULE AND PROVISION COVERAGE (FY2024 – FY2026)
| Receivables Aging Category | FY2024 (₹ million) | FY2025 (₹ million) | FY2026 (₹ million) |
|---|---|---|---|
| Unbilled Considerations | ₹103.59 | ₹132.40 | ₹167.53 |
| Not Due (Current Credit Period: 30–45 Days) | ₹1,858.19 | ₹2,391.25 | ₹2,580.84 |
| Past Due <6 Months | ₹670.41 | ₹777.15 | ₹872.86 |
| Past Due 6 Months–1 Year | ₹24.32 | ₹45.32 | ₹157.20 |
| Past Due 1–2 Years | ₹23.78 | ₹24.72 | ₹43.57 |
| Past Due 2–3 Years | ₹14.96 | ₹10.89 | ₹13.97 |
| Past Due >3 Years | ₹58.78 | ₹62.14 | ₹66.11 |
| Gross Trade Receivables | ₹2,762.83 | ₹3,461.03 | ₹3,902.08 |
| Of Which: Disputed Receivables | ₹55.10 | ₹55.10 | ₹73.82 |
| Less: Expected Credit Loss (ECL) Allowance | (₹88.09) | (₹112.05) | (₹128.49) |
| Net Carrying Value on Balance Sheet | ₹2,674.74 | ₹3,348.98 | ₹3,773.59 |
Customer credit structures indicate growing exposure to government cycles. While current accounts remained dominant (₹2,580.84 million), the 6-to-12-month delinquency tier expanded 246.9% YoY in FY2026 to ₹157.20 million, reflecting delayed milestone settlements in public sector undertakings (PSU) and state hospital tenders. Top-tier concentration remains pronounced: the single largest customer generated 12.23% of total FY2026 operational revenue (₹3,709.38 million), the top 5 generated 25.94% (₹7,871.38 million), and the top 10 generated 31.60% (₹9,586.96 million). Two long-term on-site counterparties accounted for ₹725.45 million, or 18.59%, of gross trade receivables in FY2026.
Infrastructure Layout, Industrial Exposure, and Strategic Logistical Moats
Total installed gas manufacturing capacity expanded to 21,313.42 TPD in FY2026, up from 16,831.29 TPD in FY2024 and 20,494.72 TPD in FY2025. Actual manufactured volume reached 17,669.79 TPD in FY2026, translating to an overall utilization rate of 82.90% (moderating from 91.71% in FY2024 and 86.67% in FY2025 as new mega-scale capacity stabilized).
Segmental throughput splits:
* Oxygen capacity reached 17,667.53 TPD (utilization: 80.24%), compared to 17,128.24 TPD in FY2025 and 13,925.70 TPD in FY2024.
* Nitrogen capacity reached 3,149.86 TPD, operating at a tight 99.30% capacity factor (vs. 2,893.43 TPD at 96.20% in FY2025).
* Argon capacity totaled 483.67 TPD (73.76% utilization) following the deployment of crude argon purification additions.
* Nitrous Oxide capacity was stable at 7.61 TPD, with utilization climbing to 81.63% from 61.75% in FY2024.
* Hydrogen production capacity reached 4.25 TPD across 7 Steam Methane Reformers (SMR) and 2 water electrolysis units (72.14% utilization).
Table REGIONAL ASSET ALLOCATION AND LOGISTICAL SPECIFICATIONS
| Metric | Operating Distribution Infrastructure |
|---|---|
| Physical Plant Footprint | 57 locations across 15 States and 1 Union Territory:• West / Central India: 26 facilities• South India: 19 facilities• North India: 8 facilities• East India: 4 facilities (12 greenfield sites in queue) |
| Facility Profiles | 32 On-Site facilities (41 active contracts; >50% steel)28 Dedicated Merchant Bulk Liquid facilities17 Packaged Cylinder and Specialty Gas filling plants |
| ASU Delivery Capacities | Commissioned On-Site: 16,074 TPD (+4,314 TPD under construction)Commissioned Merchant: 5,106 TPD (+921 TPD in development) |
| Logistics Fleet | 739 owned cryogenic tankers (traveled 39 million km in FY2026)~140,000 high-pressure steel and composite cylinders |
| Customer Installations | 1,679 bulk cryogenic storage tanks located on-site |
| Distribution Economics | Optimal transport radius of approximately 200–300 km from production hubs |
Physical site distribution anchors a regional hub-and-spoke configuration. Logistics costs represented 12.60% of total operational expenditures in FY2026. Transport economics limit liquid truck runs to an optimal 200 km to 300 km delivery radius. By co-locating 28 merchant liquid hubs within key manufacturing belts and operating 739 cryogenic trailers, the company maintains network redundancy: plant trips trigger deliveries from secondary regional hubs, preserving contracted off-take.
Table SYSTEMIC END-MARKET DISTRIBUTION (FY2024 – FY2026)
| End-User Segment | FY2024 (₹ million / %) | FY2025 (₹ million / %) | FY2026 (₹ million / %) |
|---|---|---|---|
| Steel | ₹9,598.66 (37.1%) | ₹10,351.65 (37.1%) | ₹12,313.43 (40.6%) |
| Healthcare & Pharmaceuticals | ₹3,361.64 (13.0%) | ₹3,399.78 (12.2%) | ₹3,330.68 (11.0%) |
| Non-Ferrous Metals | ₹3,064.09 (11.8%) | ₹3,439.46 (12.3%) | ₹3,407.50 (11.2%) |
| Automotive | ₹1,478.43 (5.7%) | ₹1,572.85 (5.6%) | ₹1,727.61 (5.7%) |
| Dealers & Debulkers | ₹1,419.01 (5.5%) | ₹1,573.57 (5.6%) | ₹1,720.91 (5.7%) |
| Chemicals | ₹1,369.34 (5.3%) | ₹1,465.91 (5.3%) | ₹1,357.65 (4.5%) |
| Solar Photovoltaics | ₹274.65 (1.1%) | ₹511.08 (1.8%) | ₹916.36 (3.0%) |
| Electronics & Semiconductors | ₹529.59 (2.0%) | ₹688.79 (2.5%) | ₹913.13 (3.0%) |
| Engineering | ₹434.21 (1.7%) | ₹584.82 (2.1%) | ₹666.54 (2.2%) |
| Tyre | ₹379.81 (1.5%) | ₹468.85 (1.7%) | ₹593.81 (2.0%) |
| Oil & Gas | ₹373.84 (1.4%) | ₹321.80 (1.2%) | ₹357.11 (1.2%) |
| Glass | ₹293.75 (1.1%) | ₹312.35 (1.1%) | ₹338.01 (1.1%) |
| Pulp & Paper | ₹360.85 (1.4%) | ₹330.62 (1.2%) | ₹286.37 (0.9%) |
| Defence | ₹111.33 (0.4%) | ₹134.34 (0.5%) | ₹145.06 (0.5%) |
| Cutting & Welding | ₹177.55 (0.7%) | ₹174.54 (0.6%) | ₹144.94 (0.5%) |
| Other Verticals | ₹1,115.91 (4.3%) | ₹972.30 (3.5%) | ₹1,019.48 (3.4%) |
Traditional heavy manufacturing represents the bulk of off-take: Steel increased its share to 40.59% of revenue in FY2026 (₹12,313.43 million), capturing 92.56% of dedicated On-Site TPD allocations. Concurrently, strategic focus has expanded into higher-margin electronics segments. Revenue from Solar PV operations reached 3.02% in FY2026 (₹916.36 million, up from ₹274.65 million in FY2024), while Electronics and Semiconductor streams expanded to 3.01% (₹913.13 million), supported by silane and high-purity nitrogen supply to domestic chip assembly and packaging facilities.
Table COMPETITIVE POSITIONING IN NON-CAPTIVE INDIAN INDUSTRIAL GAS (FY2026 MARKET SIZE: ₹135,160.8 MILLION)
| Competitor | Revenue / Market Share | Operating Margin | Network Assets & Logistics |
|---|---|---|---|
| INOX Air Products Limited | ₹30,339.28 million (22.4%) | 51.29% EBITDA | 57 sites; 739 tankers; 1,679 bulk storage installations |
| Linde India Limited | ₹25,306.40 million | 33.50% EBITDA (FY2025) | 26 sites; ~190 tankers |
| Air Water India | ₹10,391.90 million (FY2025) | 18.09% EBITDA (FY2025) | ~130 tankers; ~4,500 TPD on-site capacity |
| Ellenbarrie Industrial Gases | ₹3,415.82 million | 34.00% EBITDA | 9 sites; ~80 tankers; 698 TPD |
| Air Liquide India | ₹2,069.14 million (FY2025) | -2.70% EBITDA (FY2025) | ~90 tankers; <1,000 TPD on-site capacity |
HDIN Institutional Verdict
The operational and financial evidence for INOX Air Products reveals three structural divergence vectors that institutional capital must evaluate against broader sector assumptions:
Table STRUCTURAL BALANCE SHEET AND CASH ALLOCATION PROFILE
| Operational Variable | Reported Accounting Baseline |
|---|---|
| Cumulative 3-Year Gross Operating Cash Flow | ₹30,194.55 million |
| Cumulative 3-Year Capital Outflow (Cash PPE) | ₹34,394.36 million |
| FY2026 Net Working Capital Balance | ₹8,194.53 million (down from ₹12,489.75 million in FY2024) |
| Net Debt Position | -₹8,497.53 million (Cash & Investments: ₹22,270.56 million) |
| Contingent Liabilities Outstanding | ₹221.23 million (down from ₹507.08 million in FY2024) |
| IPO Offer Structure | Up to 77,156,663 shares (100% OFS; ₹0 primary inflow) |
First, while the company completed a Free Cash Flow turnaround in FY2026 (+₹1,027.94 million), capital requirements remain intensive. CWIP of ₹14,147.43 million, coupled with short-term project deliveries—such as the 3,600 TPD Tata Steel Meramandali installation, the AM/NS Hazira expansion, and the planned ₹500 crore electronics specialty gas hub in Dholera, Gujarat—will continue to absorb cash. Because the upcoming IPO is an entirely promoter-focused Offer for Sale yielding zero net cash proceeds to the company balance sheet, ongoing execution will rely fully on debt facilities and internal operations.
Second, the contractual framework creates an asymmetric technology dynamic. INOX Air Products holds zero registered proprietary patents, relying on continuous equipment access from Air Products and Chemicals, Inc. Under the Inter-Se Agreement, capital goods must be directed toward Air Products and INOX India Limited (INOXCVA). In FY2026, capital equipment transactions with Air Products entities alone reached ₹3,232.88 million (₹2,796.75 million via Prodair Air Products India and ₹436.13 million directly from the US parent), while purchases from INOX India totaled ₹1,224.74 million.
Third, strategic flexibility is restricted by contractual covenants:
* Geographic expansion outside India is legally barred without the written consent of both promoters, limiting external opportunities in adjacent Asian or Middle Eastern markets.
* Effective April 1, 2027 (FY2028), the company will incur an ongoing brand royalty fee of 0.50% of annual operational revenues, split equally between Pavan Kumar Jain (0.25%) and Air Products and Chemicals, Inc. (0.25%).
* Governance mechanisms enforce strict operational controls: 31+ reserved strategic matters (including annual budgets, debt adjustments, and key managerial appointments) require unanimous approval from the 4-member Shareholder Committee. Any ownership dilution where the equity spread between the Jain Family Group and Air Products exceeds 20% dissolves this governance equality. A loss of the 20% minimum threshold automatically terminates the brand license, mandating the destruction of all branded trade assets, signage, tanker livery, and an enforced corporate name change within 60 days.
Presentation Download & Video Access:
- Presentation Download: Click the PDF download link under 'Related Topics' to access the full institutional presentation of this report.
- Video Link: Click this link to watch the HDIN analyst briefing on YouTube.
About HDIN Research:
HDIN Research is a premier global market intelligence and strategic advisory firm specializing in institutional-grade financial analysis, supply chain audits, and macroeconomic forecasting. Our dedicated sector analysts deliver actionable, data-driven insights tailored for private equity, hedge funds, and corporate strategy teams. Visit us at http://www.hdinresearch.com.
2026 AI Transparency Footer:
This intelligence report was authored by HDIN Research analysts following a rigorous audit of official corporate filings. AI was utilized for massive-scale data synthesis and structural drafting, ensuring 100% inclusion of reported data points. All strategic insights, financial modeling, and final verdicts were verified by our editorial board to ensure professional accuracy and compliance with 2026 Google Search E-E-A-T standards.