Vertical Data Inc.: Asset-Light AI Infrastructure Reseller Pivots to SPV Debt and Edge Data Centers as Negative Working Capital Signals Going Concern Strain
Date : 2026-10-08
Reading : 188
HDIN Executive Takeaways
1. Vertical Data Inc. experienced a 76.21% YoY top-line contraction in 9M FY2026 to $872,212, driven by federal import tariffs and elongated procurement cycles, while cumulative R&D spend remains at $0 across all reported operating periods.
2. The company's physical infrastructure expansion relies entirely on asset-light joint ventures, including a 20.0 MW Chicago edge facility financed via a 50% joint venture with Strategic Value Partners (SVP) and a pending 4.5 MW site acquisition in Sollefteå, Sweden.
3. Accounting cash balances of $5,605,847 as of June 30, 2026, mask severe underlying liquidity strain, with uncommitted cash falling below $500,000 against $9,029,272 in short-term contract liabilities, triggering an auditor going concern warning.
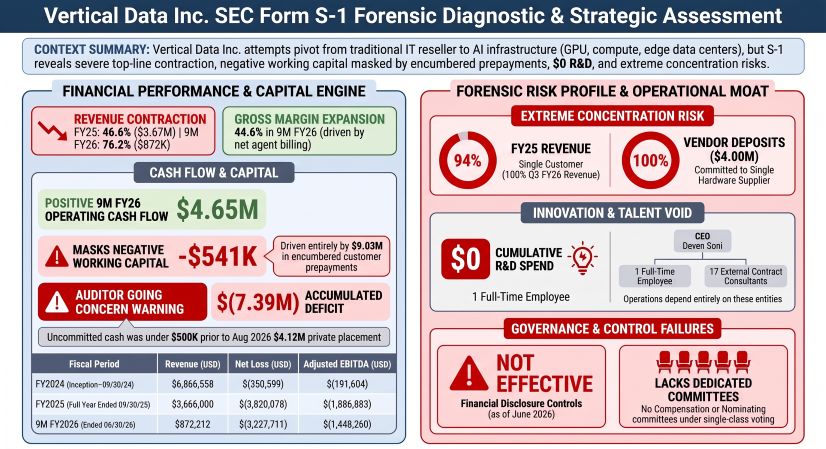
Figure Vertical Data Inc SEC Form S-1 Forensic Diagnostic & Strategic Assessment
 Segmental Realities, Revenue Contraction, and Cost Distortion
Vertical Data Inc. filed its SEC Form S-1 registration statement outlining a transition from a low-margin IT hardware value-added reseller (VAR) into an integrated provider spanning structured debt financing, bare-metal GPU procurement, and data center co-location. Incorporated on May 3, 2024, the company operates on a September 30 fiscal year-end, yielding limited baseline operating history.
Historical financial performance demonstrates top-line contraction alongside surging administrative overhead. Annual revenue dropped 46.61% YoY from $6,866,558 in FY2024 to $3,666,000 in FY2025 due to federal import tariff burdens and protracted corporate procurement cycles. For the nine months ended June 30, 2026, consolidated revenue contracted 76.21% YoY to $872,212. Cost of goods sold (COGS) decreased 86.58% YoY to $482,900 over the same period, yielding a gross profit of $389,312 and a gross margin of 44.63% (up 4,278 bps YoY). This margin expansion was entirely attributable to the booking of $247,212 in net billing agency fees in Q3 FY2026 recognized at 100% gross margin, contrasting with the 1.85% gross margin recorded in FY2025.
Operating expenses rose 16.36% YoY in 9M FY2026 to $3,617,023, driven by General & Administrative (G&A) overhead of $3,558,503 (407.99% of revenue). Operating losses reached $(3,227,711) in 9M FY2026, while net losses stood at $(3,227,711). Adjusted EBITDA was $(1,448,260), as stock-based compensation (SBC) accounted for $1,776,586, representing 203.69% of revenue.
Table HISTORICAL FINANCIAL PERFORMANCE MATRIX (USD $)
Operating cash flows stood at +$4,651,733 for 9M FY2026, compared to $(1,089,017) in 9M FY2025. This positive cash generation was driven by working capital liability timing: the company absorbed $9,029,272 in customer prepayments (contract liabilities) and an accounts payable increase of $1,085,364, offset by a $3,999,990 vendor equipment deposit. Free cash flow was +$4,651,733 as CapEx stood at $0. Cash flow from financing reached $579,500, with foreign exchange translation contributing $1,896. Net working capital reversed from +$754,596 as of September 30, 2024, and +$265,654 as of September 30, 2025, to -$541,303 as of June 30, 2026, comprising $9,938,500 in current assets against $10,479,803 in current liabilities. Stockholders' equity stood at a deficit of $(540,118), yielding an asset-to-liability ratio of 105.43%, a current ratio of 0.95x, and a quick ratio of 0.53x.
Accounts receivable balances were $0 across all historical balance sheet dates, as sales terms mandate upfront settlement via wire transfer prior to or upon delivery. Single-customer concentration was 94% in FY2025 (Customer A: $3.50M; Customer B: $0.20M) and 100% in Q3 FY2026 ($247,212 from one client). In FY2024, Customer A generated 77% ($5.30M) and Customer B contributed 23% ($1.60M).
Table REVENUE DISAGGREGATION BY BUSINESS LINE (USD $)
Infrastructure Architecture, Joint Ventures, and Footprint Distribution
Vertical Data Inc. structures its operational capacity via an off-balance-sheet joint venture model designed to bypass direct equipment manufacturing and real estate ownership obligations.
Table PHYSICAL FACILITY FOOTPRINT & CAPACITY MATRIX
Physical infrastructure investments are partitioned into regional operational nodes:
* Downtown Chicago Facility: 20.0 MW edge computing facility acquired in July 2026 through Vertical Edge LLC, a 50/50 joint venture. Strategic Value Partners (SVP) provided primary equity financing and maintains preferred distribution rights over asset-level cash distributions.
* Sollefteå Platform, Sweden: 4.5 MW industrial compute site under a definitive purchase agreement signed in September 2026 through 85%-owned subsidiary VD Nordica AB. The site holds pending grid-interconnection applications to scale to 100.0 MW, contingent on closing capital.
* Corporate Headquarters: 1980 Festival Plaza Drive, Suite 300, Las Vegas, Nevada. Maintained under a flexible, month-to-month lease arrangement without long-term capital commitments.
100% of reported historical revenues originated within the United States. Long-lived physical assets totaled $1,185 as of June 30, 2026, and $1,457 as of September 30, 2025, with 100% situated inside the United States. International territories, including Canada and Sweden, generated $0 in recognized revenue and held $0 in long-lived balance sheet assets through June 30, 2026. Zero revenues and assets were associated with East Asia or Taiwan, Province of China.
Workforce operations are managed by 1 full-time employee—Chairman and Chief Executive Officer Deven Soni—supported by 17 third-party independent consultants and offshore accounting contractors. Research and development expenses totaled $0 across all fiscal intervals, supported by zero registered patents or trademarks. Sourcing operations reflect extreme counterparty concentration: as of June 30, 2026, 100% of outstanding vendor prepayments ($3,999,990) were allocated to a single equipment vendor, with procurement conducted via uncommitted, spot purchase orders rather than binding master distribution agreements.
HDIN Institutional Verdict
Vertical Data Inc.'s Form S-1 filing reveals a structural divergence between its reported cash position and underlying operational viability.
While the headline cash balance rose to $5,605,847 as of June 30, 2026, this liquidity is encumbered by $9,029,272 in short-term contract liabilities. Operating with less than $500,000 in uncommitted liquid funds prior to an August 11, 2026, private placement—which raised $4,119,456 in gross proceeds ($3.00/share for 1,373,152 shares)—the company's effective cash burn of $500,000 to $600,000 per quarter provides an adjusted runway of 12 to 18 months.
Governance and capital controls present operational risk. The company lacks dedicated standing Compensation and Nominating committees, operates without an in-house Chief Technology Officer, and saw management formally classify disclosure controls and procedures as "not effective" as of June 30, 2026, citing segregation-of-duties deficits.
Furthermore, the dismissal of auditor BCRG Group in June 2026 following Simon & Edward LLP's acquisition of the firm's assets highlights back-office flux. Management's guidance targeting sustainable financial profitability in fiscal 2027 rests on off-balance-sheet SPVs and spot hardware margins. In the absence of proprietary intellectual property, fixed vendor supply guarantees, or multi-year enterprise contracts, these operating assumptions remain unhedged against standard procurement disruptions.
Presentation Download & Video Access:
- Presentation Download: Click the PDF download link under 'Related Topics' to access the full institutional presentation of this report.
- Video Link: Click this link to watch the HDIN analyst briefing on YouTube.
About HDIN Research:
HDIN Research is a premier global market intelligence and strategic advisory firm specializing in institutional-grade financial analysis, supply chain audits, and macroeconomic forecasting. Our dedicated sector analysts deliver actionable, data-driven insights tailored for private equity, hedge funds, and corporate strategy teams. Visit us at http://www.hdinresearch.com.
2026 AI Transparency Footer:
"This intelligence report was authored by HDIN Research analysts following a rigorous audit of official corporate filings. AI was utilized for massive-scale data synthesis and structural drafting, ensuring 100% inclusion of reported data points. All strategic insights, financial modeling, and final verdicts were verified by our editorial board to ensure professional accuracy and compliance with 2026 Google Search E-E-A-T standards."
1. Vertical Data Inc. experienced a 76.21% YoY top-line contraction in 9M FY2026 to $872,212, driven by federal import tariffs and elongated procurement cycles, while cumulative R&D spend remains at $0 across all reported operating periods.
2. The company's physical infrastructure expansion relies entirely on asset-light joint ventures, including a 20.0 MW Chicago edge facility financed via a 50% joint venture with Strategic Value Partners (SVP) and a pending 4.5 MW site acquisition in Sollefteå, Sweden.
3. Accounting cash balances of $5,605,847 as of June 30, 2026, mask severe underlying liquidity strain, with uncommitted cash falling below $500,000 against $9,029,272 in short-term contract liabilities, triggering an auditor going concern warning.
Figure Vertical Data Inc SEC Form S-1 Forensic Diagnostic & Strategic Assessment
Segmental Realities, Revenue Contraction, and Cost DistortionVertical Data Inc. filed its SEC Form S-1 registration statement outlining a transition from a low-margin IT hardware value-added reseller (VAR) into an integrated provider spanning structured debt financing, bare-metal GPU procurement, and data center co-location. Incorporated on May 3, 2024, the company operates on a September 30 fiscal year-end, yielding limited baseline operating history.
Historical financial performance demonstrates top-line contraction alongside surging administrative overhead. Annual revenue dropped 46.61% YoY from $6,866,558 in FY2024 to $3,666,000 in FY2025 due to federal import tariff burdens and protracted corporate procurement cycles. For the nine months ended June 30, 2026, consolidated revenue contracted 76.21% YoY to $872,212. Cost of goods sold (COGS) decreased 86.58% YoY to $482,900 over the same period, yielding a gross profit of $389,312 and a gross margin of 44.63% (up 4,278 bps YoY). This margin expansion was entirely attributable to the booking of $247,212 in net billing agency fees in Q3 FY2026 recognized at 100% gross margin, contrasting with the 1.85% gross margin recorded in FY2025.
Operating expenses rose 16.36% YoY in 9M FY2026 to $3,617,023, driven by General & Administrative (G&A) overhead of $3,558,503 (407.99% of revenue). Operating losses reached $(3,227,711) in 9M FY2026, while net losses stood at $(3,227,711). Adjusted EBITDA was $(1,448,260), as stock-based compensation (SBC) accounted for $1,776,586, representing 203.69% of revenue.
Table HISTORICAL FINANCIAL PERFORMANCE MATRIX (USD $)
| Financial Line Item | FY2024 | FY2025 | 9M FY2025 | 9M FY2026 |
|---|---|---|---|---|
| Revenue | $6,866,558 | $3,666,000 | $3,666,000 | $872,212 |
| Cost of Goods Sold (COGS) | $6,542,000 | $3,598,000 | $3,598,000 | $482,900 |
| Gross Profit | $324,558 | $68,000 | $68,000 | $389,312 |
| Gross Margin % | 4.73% | 1.85% | 1.85% | 44.63% |
| Operating Expenses | $675,157 | $3,888,078 | $3,108,539 | $3,617,023 |
| Operating Loss | $(350,599) | $(3,820,078) | $(3,040,539) | $(3,227,711) |
| Net Loss | $(350,599) | $(3,820,078) | $(3,040,539) | $(3,227,711) |
| Stock-Based Compensation | $158,972 | $1,932,864 | $1,788,375 | $1,776,586 |
| Depreciation & Amortization | $23 | $331 | $240 | $272 |
| Interest Expense | $0 | $0 | $0 | $2,593 |
| Adjusted EBITDA | $(191,604) | $(1,886,883) | $(1,251,924) | $(1,448,260) |
Operating cash flows stood at +$4,651,733 for 9M FY2026, compared to $(1,089,017) in 9M FY2025. This positive cash generation was driven by working capital liability timing: the company absorbed $9,029,272 in customer prepayments (contract liabilities) and an accounts payable increase of $1,085,364, offset by a $3,999,990 vendor equipment deposit. Free cash flow was +$4,651,733 as CapEx stood at $0. Cash flow from financing reached $579,500, with foreign exchange translation contributing $1,896. Net working capital reversed from +$754,596 as of September 30, 2024, and +$265,654 as of September 30, 2025, to -$541,303 as of June 30, 2026, comprising $9,938,500 in current assets against $10,479,803 in current liabilities. Stockholders' equity stood at a deficit of $(540,118), yielding an asset-to-liability ratio of 105.43%, a current ratio of 0.95x, and a quick ratio of 0.53x.
Accounts receivable balances were $0 across all historical balance sheet dates, as sales terms mandate upfront settlement via wire transfer prior to or upon delivery. Single-customer concentration was 94% in FY2025 (Customer A: $3.50M; Customer B: $0.20M) and 100% in Q3 FY2026 ($247,212 from one client). In FY2024, Customer A generated 77% ($5.30M) and Customer B contributed 23% ($1.60M).
Table REVENUE DISAGGREGATION BY BUSINESS LINE (USD $)
| Segment Stream | FY2024 | FY2025 | 9M FY2026 | Q3 FY2026 |
|---|---|---|---|---|
| IT Hardware Sales | $6,866,558 | $3,666,000 | $625,000 | $0 |
| Billing & Managed Services | $0 | $0 | $247,212 | $247,212 |
| GPU Financing Fees | $0 | $0 | $0 | $0 |
| Data Center Capacity | $0 | $0 | $0 | $0 |
| Total Consolidated Revenue | $6,866,558 | $3,666,000 | $872,212 | $247,212 |
Infrastructure Architecture, Joint Ventures, and Footprint Distribution
Vertical Data Inc. structures its operational capacity via an off-balance-sheet joint venture model designed to bypass direct equipment manufacturing and real estate ownership obligations.
Table PHYSICAL FACILITY FOOTPRINT & CAPACITY MATRIX
| Facility Location | Power / Scale | Operating Entity | Tenure / Deal Structure |
|---|---|---|---|
| Las Vegas, Nevada | Corporate HQ | Vertical Data Inc. | Leased (Month-to-month) |
| Chicago, Illinois | 20.0 MW | Vertical Edge LLC | 50% Joint Venture (SVP) |
| Sollefteå, Sweden | 4.5 MW (100 MW) | VD Nordica AB | 85% Subsidiary (Purchase Agreement) |
| Canada | Entity Level | VDCA Inc. | 100% Wholly Owned |
Physical infrastructure investments are partitioned into regional operational nodes:
* Downtown Chicago Facility: 20.0 MW edge computing facility acquired in July 2026 through Vertical Edge LLC, a 50/50 joint venture. Strategic Value Partners (SVP) provided primary equity financing and maintains preferred distribution rights over asset-level cash distributions.
* Sollefteå Platform, Sweden: 4.5 MW industrial compute site under a definitive purchase agreement signed in September 2026 through 85%-owned subsidiary VD Nordica AB. The site holds pending grid-interconnection applications to scale to 100.0 MW, contingent on closing capital.
* Corporate Headquarters: 1980 Festival Plaza Drive, Suite 300, Las Vegas, Nevada. Maintained under a flexible, month-to-month lease arrangement without long-term capital commitments.
100% of reported historical revenues originated within the United States. Long-lived physical assets totaled $1,185 as of June 30, 2026, and $1,457 as of September 30, 2025, with 100% situated inside the United States. International territories, including Canada and Sweden, generated $0 in recognized revenue and held $0 in long-lived balance sheet assets through June 30, 2026. Zero revenues and assets were associated with East Asia or Taiwan, Province of China.
Workforce operations are managed by 1 full-time employee—Chairman and Chief Executive Officer Deven Soni—supported by 17 third-party independent consultants and offshore accounting contractors. Research and development expenses totaled $0 across all fiscal intervals, supported by zero registered patents or trademarks. Sourcing operations reflect extreme counterparty concentration: as of June 30, 2026, 100% of outstanding vendor prepayments ($3,999,990) were allocated to a single equipment vendor, with procurement conducted via uncommitted, spot purchase orders rather than binding master distribution agreements.
HDIN Institutional Verdict
Vertical Data Inc.'s Form S-1 filing reveals a structural divergence between its reported cash position and underlying operational viability.
While the headline cash balance rose to $5,605,847 as of June 30, 2026, this liquidity is encumbered by $9,029,272 in short-term contract liabilities. Operating with less than $500,000 in uncommitted liquid funds prior to an August 11, 2026, private placement—which raised $4,119,456 in gross proceeds ($3.00/share for 1,373,152 shares)—the company's effective cash burn of $500,000 to $600,000 per quarter provides an adjusted runway of 12 to 18 months.
Governance and capital controls present operational risk. The company lacks dedicated standing Compensation and Nominating committees, operates without an in-house Chief Technology Officer, and saw management formally classify disclosure controls and procedures as "not effective" as of June 30, 2026, citing segregation-of-duties deficits.
Furthermore, the dismissal of auditor BCRG Group in June 2026 following Simon & Edward LLP's acquisition of the firm's assets highlights back-office flux. Management's guidance targeting sustainable financial profitability in fiscal 2027 rests on off-balance-sheet SPVs and spot hardware margins. In the absence of proprietary intellectual property, fixed vendor supply guarantees, or multi-year enterprise contracts, these operating assumptions remain unhedged against standard procurement disruptions.
Presentation Download & Video Access:
- Presentation Download: Click the PDF download link under 'Related Topics' to access the full institutional presentation of this report.
- Video Link: Click this link to watch the HDIN analyst briefing on YouTube.
About HDIN Research:
HDIN Research is a premier global market intelligence and strategic advisory firm specializing in institutional-grade financial analysis, supply chain audits, and macroeconomic forecasting. Our dedicated sector analysts deliver actionable, data-driven insights tailored for private equity, hedge funds, and corporate strategy teams. Visit us at http://www.hdinresearch.com.
2026 AI Transparency Footer:
"This intelligence report was authored by HDIN Research analysts following a rigorous audit of official corporate filings. AI was utilized for massive-scale data synthesis and structural drafting, ensuring 100% inclusion of reported data points. All strategic insights, financial modeling, and final verdicts were verified by our editorial board to ensure professional accuracy and compliance with 2026 Google Search E-E-A-T standards."