Roze AI Inc.: Top-Line Contracts 72.10% in FY2025 as Project Execution Timing Strains Liquidity Ahead of Planned Fabless Pivot
Date : 2026-10-08
Reading : 366
HDIN Executive Takeaways
1. Revenue dropped 72.10% YoY in FY2025 to $2,295,237 as project milestone deferrals in South Korea expanded operating losses to $5,647,814, leaving standalone cash reserves at 4.20 months ($1,083,913) prior to post-period structured financing.
2. Operations remain 100% geographically concentrated within South Korea across an 899.54 m² physical footprint in Seongnam-si and Chuncheon-si, while planned market entries into Vietnam and North America generated $0.00 in audited revenue.
3. Post-period Class C Preferred share financing provided $9,360,000 in net cash but introduced toxic floating conversion terms down to a $1.00 floor price, exposing equity holders to 31.3%–36.2% fully diluted overhang and a 142.8% expansion in tradable float under Form F-1.
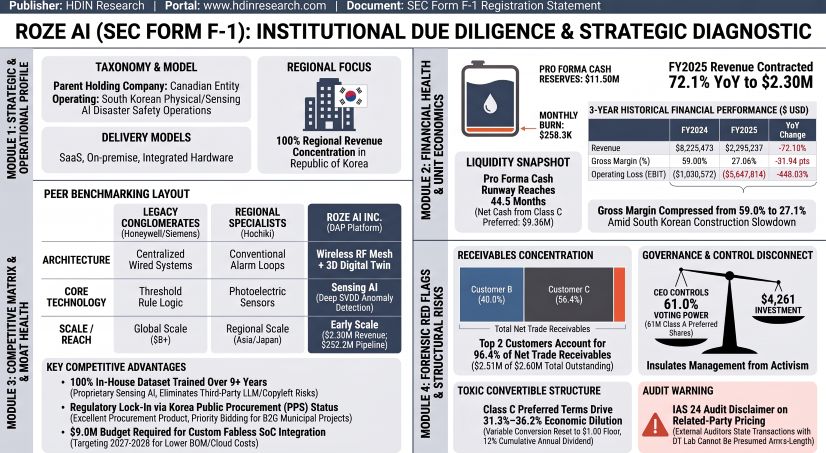
Figure ROZE AI (SEC FORM F-1) INSTITUTIONAL DUE DILIGENCE & STRATEGIC DIAGNOSTIC
 Segmental Realities and Margin Compression
Roze AI Inc. [NASDAQ: ROZE] operates as a single operating segment under its Chief Operating Decision Maker (CODM). Top-line revenue contracted 72.10% YoY in FY2025 to $2,295,237 from $8,225,473 in FY2024. Under IFRS 15, revenues are classified into Product Revenue and Service Revenue. Core platform software is embedded directly into hardware devices, resulting in combined performance obligations recognized at a point in time rather than as recurring subscription streams.
Table Revenue Mix, Cost Structure and Gross Profit Analysis (FY2024–FY2025)
Operating expenses reflected accelerated development outlays offset by general administrative reductions:
* Research & Development (R&D): Rose 141.92% YoY from $988,881 to $2,392,362 due to platform engineering, custom Fabless System-on-Chip (SoC) prototyping, and reduced government grant offset credits.
* General & Administrative (G&A): Decreased 19.00% YoY from $3,968,320 to $3,214,846 due to lower professional fees and reduced bad debt allowances.
* Sales & Marketing: Declined 28.65% YoY from $779,553 to $556,190 due to variable marketing adjustments.
* Operating Loss (EBIT): Expanded 448.03% YoY from $(1,030,572) to $(5,647,814), with operating margin deteriorating 23,354 bps from -12.53% to -246.07%.
* Net Finance Costs: Recorded at $(434,919) in FY2025 compared to $(471,966) in FY2024, reflecting bank debt interest and convertible note amortization.
* Net Loss: Expanded 317.53% YoY from $(1,444,257) to $(6,030,257).
Table Non-GAAP Adjusted EBITDA shifted from positive $63,970 in FY2024 to negative $(4,655,521) in FY2025
Operational key performance indicators (KPIs) show shifting transaction mechanics:
* Average Order Value (AOV): Dropped from $61,384 in FY2024 ($38,142 in FY2021) to $16,754 in FY2025 due to initial-phase contract billing recognition.
* Active Customer Count: Totaled 93 billed accounts in FY2025.
* Customer Acquisition: 66 new accounts acquired in FY2025 (71.0% of active clients), contributing $1.38 million (59.9% of consolidated revenue) at an average revenue per new customer of $20,842.
* Transaction Frequency: Declined from 2.10x in FY2021 and 1.58x in FY2024 to 1.47x in FY2025.
* Customer Concentration: In FY2024, Customer B represented 23.7% ($1,950,000) and Customer C represented 26.3% ($2,163,300) of revenue (two clients accounted for 40.0% of total revenue). In FY2025, Customer A represented 18.3% ($420,000) of total revenue.
* Receivables Concentration: Customer B and Customer C accounted for 40.0% and 56.4% of net trade receivables as of December 31, 2025, respectively, combining for 96.4% ($2.51 million of $2.60 million net receivables).
The balance sheet shifted into technical working capital deficit and equity deficit at fiscal year-end 2025, triggering a going concern explanatory paragraph from TAAD LLP:
Solvency metrics stood at a current ratio of 0.98x, a quick ratio of 0.50x, a cash ratio of 0.15x, and a debt-to-asset ratio of 103.29% as of December 31, 2025. Operating cash flow stood at $(3,011,271) against capital expenditures of $88,881, yielding Free Cash Flow of $(3,100,152) (a monthly net cash burn of $258,346). Standalone cash runway on December 31, 2025 was 4.20 months, with existing liquidity projected to exhaust by May 2026 absent post-period financings.
Infrastructure Layout and Regional Moats
Roze AI operates through a parent holding structure in British Columbia, Canada, controlling 100% of its operating subsidiary, Roze AI Korea Co., Ltd. Physical operations comprise 899.54 m² across four owned commercial units in Seongnam-si and Chuncheon-si, South Korea:
* Seongnam Headquarters (URim Lions Valley, Room B-1710; 78.00 m²): Dedicated core R&D laboratory housing algorithmic model testing, digital twin simulation development, and wireless networking software design.
* Seongnam Manufacturing & Testing (Room 1709; 81.90 m²): Final hardware assembly floor, QA/QC calibration lines, and multi-sensor testing suites.
* Seongnam Administration, PMO & Sales (Rooms 1607, 1711–1714, 1806; 605.13 m²): Executive offices, Project Management Office (PMO), finance, and corporate strategy.
* Chuncheon Sales Hub (Room 510; 134.51 m²): Regional direct-sales office managing procurement channels and public housing projects.
Total headcount stood at 56 full-time and 56 contract employees in South Korea as of December 31, 2025. Technical R&D accounted for 26 full-time staff (46.4%), marketing and global operations comprised 13 (23.2%), corporate/finance employed 11 (19.6%), and manufacturing/after-sales comprised 6 (10.7%).
The operating model separates software design from physical manufacturing:
* Fabless Silicon Architecture: Custom System-on-Chip (SoC) engineering (RF communication plus MCU-based AI ASIC) is executed in-house, while wafer manufacturing, foundry masks, and packaging are outsourced to commercial third-party foundries (e.g., TSMC or Samsung Electronics). Commercial SoC launch is targeted for Q1 2028 under an estimated $9.0 million capital requirement ($8.0 million for EDA software tools and IP licensing; $1.0 million for mask production).
* Component Procurement Concentration: Roze AI outsources sub-assembly manufacturing. In FY2025, three component suppliers accounted for 82.9% of total inventory purchases (Company A at 38.2%, Company B at 26.8%, and Company C at 17.9%). On the payables side, three vendors represented 78.3% of outstanding trade balances on December 31, 2025 (Company E at 31.8%, Company B at 27.5%, and Company D at 19.0%).
* Subcontractor Network: Physical on-site sensor installation is outsourced to an audited nationwide network of licensed electrical and fire-prevention subcontractors.
* Global Expansion Status: Vietnam operations transitioned to an asset-light distribution framework following the sale of subsidiary Rozeta Vina Ltd to CEO Young Jin Cho for $63,962 on December 19, 2024. Commercial product shipments to Vietnam are targeted for H2 2026. In the United States, an April 2023 non-binding MoU with PDI Global LLC involves zero committed capital over the next 12 months, targeting licensing and revenue-sharing deployments in H2 2026.
Intellectual property consists of 20 granted patents (17 registered with KIPO in South Korea, 2 with the USPTO in the United States, and 1 under PCT), alongside 22 pending patent applications, 15 trademarks, and 6 design marks. Core US patents comprise US 11,488,460 B2 (Mesh Transmitter Alarm, expires March 2040) and US 12,183,185 B2 (RF Signal Filtering Batch Function, expires March 2041). In South Korea, Korean Patent No. 10-123763 (Fire Alarm System - Gateway Type) was invalidated in lower proceedings and remains subject to ongoing appeal litigation.
HDIN Institutional Verdict
Roze AI Inc. relies on a certified domestic niche in South Korean B2G public procurement—anchored by its Public Procurement Service (PPS) "Excellent Product" designation and LH New Technology integration—to capture project revenue across military bases, municipal facilities, and public housing complexes. However, management's positioning of the enterprise as a scalable AI software business conflicts with its transactional reality: 100% of revenue in FY2024 and FY2025 derived from point-in-time, project-based hardware deployments. The planned transition to recurring SaaS maintenance (DAP Cloud / RozeVerse) remains in testing stages and is not forecasted to generate material revenue within the next 12 months.
The corporate governance structure insulates executive control while utilizing statutory reporting carve-outs:
* Voting Disconnect: Founder & CEO Young Jin Cho acquired 61,000,000 Class A Preferred Shares on April 3, 2025 for CAD $6,100 ($4,261 USD; $0.0001 per share), securing 52.3% of basic voting power. Post-listing consulting agreements allocate an additional 7,250,000 Common Shares to the CEO, elevating total voting control to 61.0% against an economic ownership interest of 22.7%.
* Governance Oversight Deficits: Exercising Nasdaq Controlled Company exemptions and Canadian Foreign Private Issuer (BCBCA) status, the board operates without an independent compensation committee or nominating committee.
* Forensic Audit Findings: In Note 2(aa), independent auditors explicitly state that related-party transactions cannot be presumed to be carried out on an arm's-length basis. Related-party transactions include historical sales to COO Seog Hun Cho’s entity DT Lab ($1,794,744 in FY2023; $228,540 in FY2024, alongside $168,130 in commissions and R&D fees), the transfer of 100% of the Vietnamese distribution subsidiary to CEO Cho for $63,962, an outstanding officer loan payable to the CEO of $358,706 at 3.6% interest, an officer loan receivable from CFO Seon Ho Lee of $69,226 at 4.6% interest, and $2,071,607 in personal bank debt guarantees provided by the CEO to secure Industrial Bank of Korea (IBK) credit facilities.
Liquidity pressures were temporarily mitigated by subsequent financing, but at the cost of structural equity dilution:
* Post-Period Financing: In January 2026, the company issued $1,055,543 in convertible bonds. On September 28, 2026, Roze AI completed a private placement of 1,250,000 Class C Preferred Shares at $8.00 per share, yielding $10,000,000 gross ($9,360,000 net after $640,000 in placement agent fees and expenses).
* Pro Forma Capitalization: The cash balance expanded to $11,499,456 (providing 44.5 months of operational burn coverage), total debt stood at $7,505,673, and stockholders’ equity shifted to positive $9,043,573.
* Structured Financing Overhang: Form F-1 registers 19,814,230 Common Shares for resale by selling shareholders (including 18,750,000 Class C conversion shares and 1,064,230 Dawson James advisory shares), expanding public float by 142.8% without generating primary proceeds for the company.
* Floating Reset Exposure: Class C Preferred Shares incorporate a cumulative 12% annual dividend ($0.96/share/yr), a 1.5x Event of Default multiplier (increasing stated value from $10.00 to $15.00 per share), full-ratchet anti-dilution reset provisions, and a conversion formula pegged to the lower of $8.00 or 80% of the 5-day lowest closing price, stepping down to a $1.00 floor.
Table Fully Diluted Share Capital Structure
The fully diluted share count expands 56.86% from 55.64 million to 87.28 million shares, imposing an immediate 36.25% economic dilution on existing Common shareholders.
Simultaneously executing the $9.0 million SoC R&D budget, servicing $4.46 million in bank debt obligations, and funding project working capital across its $252.2 million 12-month domestic project pipeline—which includes the $137.8 million Inwoobus Yeongcheon Data Center project—requires an estimated $18.55 million against $11.50 million in pro forma liquidity. Unless Roze AI rapidly collects project advances or executes secondary market refinancing by 2027, available cash will be absorbed by debt service and fixed overhead before proprietary silicon commercialization can be realized.
Presentation Download & Video Access
* Presentation Download: Click the PDF download link under 'Related Topics' to access the full institutional presentation of this report.
* Video Link: Click this link to watch the HDIN analyst briefing on YouTube.
About HDIN Research
HDIN Research is a premier global market intelligence and strategic advisory firm specializing in institutional-grade financial analysis, supply chain audits, and macroeconomic forecasting. Our dedicated sector analysts deliver actionable, data-driven insights tailored for private equity, hedge funds, and corporate strategy teams. Visit us at http://www.hdinresearch.com.
2026 AI Transparency Footer
This intelligence report was authored by HDIN Research analysts following a rigorous audit of official corporate filings. AI was utilized for massive-scale data synthesis and structural drafting, ensuring 100% inclusion of reported data points. All strategic insights, financial modeling, and final verdicts were verified by our editorial board to ensure professional accuracy and compliance with 2026 Google Search E-E-A-T standards.
1. Revenue dropped 72.10% YoY in FY2025 to $2,295,237 as project milestone deferrals in South Korea expanded operating losses to $5,647,814, leaving standalone cash reserves at 4.20 months ($1,083,913) prior to post-period structured financing.
2. Operations remain 100% geographically concentrated within South Korea across an 899.54 m² physical footprint in Seongnam-si and Chuncheon-si, while planned market entries into Vietnam and North America generated $0.00 in audited revenue.
3. Post-period Class C Preferred share financing provided $9,360,000 in net cash but introduced toxic floating conversion terms down to a $1.00 floor price, exposing equity holders to 31.3%–36.2% fully diluted overhang and a 142.8% expansion in tradable float under Form F-1.
Figure ROZE AI (SEC FORM F-1) INSTITUTIONAL DUE DILIGENCE & STRATEGIC DIAGNOSTIC
Segmental Realities and Margin CompressionRoze AI Inc. [NASDAQ: ROZE] operates as a single operating segment under its Chief Operating Decision Maker (CODM). Top-line revenue contracted 72.10% YoY in FY2025 to $2,295,237 from $8,225,473 in FY2024. Under IFRS 15, revenues are classified into Product Revenue and Service Revenue. Core platform software is embedded directly into hardware devices, resulting in combined performance obligations recognized at a point in time rather than as recurring subscription streams.
Table Revenue Mix, Cost Structure and Gross Profit Analysis (FY2024–FY2025)
| Revenue & Cost Stream (USD) | FY2024 | FY2024 Share (%) | FY2025 | FY2025 Share (%) | YoY Change (%) | Operational Driver |
| Product Revenue (Third-Party) | $7,932,619 | 96.44% | $1,852,798 | 80.72% | -76.64% | Hardware appliances (detectors, repeaters, panels) bundled with DAP software |
| Product Revenue (Related-Party) | $228,540 | 2.78% | $0 | 0.00% | -100.00% | Sales to former affiliate DT Lab Co., Ltd. (divested Jan 2025) |
| Service Revenue | $64,314 | 0.78% | $442,439 | 19.28% | +587.93% | Custom engineering design, third-party R&D, and testing services |
| Consolidated Total Revenue | $8,225,473 | 100.00% | $2,295,237 | 100.00% | -72.10% | South Korean construction slowdown and milestone deferrals |
| Cost of Revenue | $3,372,603 | 41.00% | $1,674,119 | 72.94% | -50.36% | Inventory usage, finished goods purchasing, component BOM |
| Gross Profit | $4,852,870 | 59.00% | $621,118 | 27.06% | -87.20% | Fixed overhead absorption loss; margin compressed by 3,194 bps |
Operating expenses reflected accelerated development outlays offset by general administrative reductions:
* Research & Development (R&D): Rose 141.92% YoY from $988,881 to $2,392,362 due to platform engineering, custom Fabless System-on-Chip (SoC) prototyping, and reduced government grant offset credits.
* General & Administrative (G&A): Decreased 19.00% YoY from $3,968,320 to $3,214,846 due to lower professional fees and reduced bad debt allowances.
* Sales & Marketing: Declined 28.65% YoY from $779,553 to $556,190 due to variable marketing adjustments.
* Operating Loss (EBIT): Expanded 448.03% YoY from $(1,030,572) to $(5,647,814), with operating margin deteriorating 23,354 bps from -12.53% to -246.07%.
* Net Finance Costs: Recorded at $(434,919) in FY2025 compared to $(471,966) in FY2024, reflecting bank debt interest and convertible note amortization.
* Net Loss: Expanded 317.53% YoY from $(1,444,257) to $(6,030,257).
Table Non-GAAP Adjusted EBITDA shifted from positive $63,970 in FY2024 to negative $(4,655,521) in FY2025
| Non-GAAP EBITDA Reconciliation (USD) | FY2024 | FY2025 | YoY Change (%) |
| Operating Loss (EBIT) | $(1,030,572) | $(5,647,814) | +448.03% |
| Add: Depreciation & Amortization | $241,932 | $313,704 | +29.67% |
| Standard EBITDA | $(788,640) | $(5,334,110) | +576.38% |
| Add: Stock-Based Compensation | $201,216 | $261,533 | +29.98% |
| Add: Provision for Bad Debts / Credit Losses | $450,126 | $142,657 | -68.31% |
| Add: Severance Expense | $201,268 | $274,399 | +36.33% |
| Adjusted EBITDA | $63,970 | $(4,655,521) | N/A |
Operational key performance indicators (KPIs) show shifting transaction mechanics:
* Average Order Value (AOV): Dropped from $61,384 in FY2024 ($38,142 in FY2021) to $16,754 in FY2025 due to initial-phase contract billing recognition.
* Active Customer Count: Totaled 93 billed accounts in FY2025.
* Customer Acquisition: 66 new accounts acquired in FY2025 (71.0% of active clients), contributing $1.38 million (59.9% of consolidated revenue) at an average revenue per new customer of $20,842.
* Transaction Frequency: Declined from 2.10x in FY2021 and 1.58x in FY2024 to 1.47x in FY2025.
* Customer Concentration: In FY2024, Customer B represented 23.7% ($1,950,000) and Customer C represented 26.3% ($2,163,300) of revenue (two clients accounted for 40.0% of total revenue). In FY2025, Customer A represented 18.3% ($420,000) of total revenue.
* Receivables Concentration: Customer B and Customer C accounted for 40.0% and 56.4% of net trade receivables as of December 31, 2025, respectively, combining for 96.4% ($2.51 million of $2.60 million net receivables).
The balance sheet shifted into technical working capital deficit and equity deficit at fiscal year-end 2025, triggering a going concern explanatory paragraph from TAAD LLP:
| Balance Sheet Item (USD) | Dec 31, 2024 | Dec 31, 2025 | Absolute Variance |
| Cash & Cash Equivalents | $2,775,088 | $1,083,913 | -$1,691,175 |
| Trade & Other Receivables (Net) | $3,441,962 | $2,599,647 | -$842,315 |
| Inventory (Net, allowance: $523,162) | $1,691,606 | $936,118 | -$755,488 |
| Deferred Offering Costs | $565,290 | $2,435,920 | +$1,870,630 |
| Total Current Assets | $8,543,311 | $7,213,441 | -$1,329,870 |
| Current Loans Payable (Bank) | $4,012,796 | $4,056,246 | +$43,450 |
| Current Convertible Bonds | $0 | $732,988 | +$732,988 |
| Payables to Related Parties (CEO loan: $358,706) | $98,965 | $395,372 | +$296,407 |
| Total Current Liabilities | $5,918,178 | $7,350,196 | +$1,432,018 |
| Working Capital (Deficit) | +$2,625,133 | $(136,755) | -$2,761,888 |
| Adjusted Working Capital (excl. Deferred Costs) | +$2,059,843 | $(2,572,675) | -$4,632,518 |
| Total Debt (Bank: $4.46M, CBs: $1.99M) | $6,792,508 | $6,450,130 | -$342,378 |
| Total Liabilities | $9,505,120 | $9,935,346 | +$430,226 |
| Stockholders’ Equity / (Deficit) | +$1,263,658 | $(316,427) | -$1,580,085 |
| Total Assets | $10,768,778 | $9,618,919 | -$1,149,859 |
Solvency metrics stood at a current ratio of 0.98x, a quick ratio of 0.50x, a cash ratio of 0.15x, and a debt-to-asset ratio of 103.29% as of December 31, 2025. Operating cash flow stood at $(3,011,271) against capital expenditures of $88,881, yielding Free Cash Flow of $(3,100,152) (a monthly net cash burn of $258,346). Standalone cash runway on December 31, 2025 was 4.20 months, with existing liquidity projected to exhaust by May 2026 absent post-period financings.
Infrastructure Layout and Regional Moats
Roze AI operates through a parent holding structure in British Columbia, Canada, controlling 100% of its operating subsidiary, Roze AI Korea Co., Ltd. Physical operations comprise 899.54 m² across four owned commercial units in Seongnam-si and Chuncheon-si, South Korea:
* Seongnam Headquarters (URim Lions Valley, Room B-1710; 78.00 m²): Dedicated core R&D laboratory housing algorithmic model testing, digital twin simulation development, and wireless networking software design.
* Seongnam Manufacturing & Testing (Room 1709; 81.90 m²): Final hardware assembly floor, QA/QC calibration lines, and multi-sensor testing suites.
* Seongnam Administration, PMO & Sales (Rooms 1607, 1711–1714, 1806; 605.13 m²): Executive offices, Project Management Office (PMO), finance, and corporate strategy.
* Chuncheon Sales Hub (Room 510; 134.51 m²): Regional direct-sales office managing procurement channels and public housing projects.
Total headcount stood at 56 full-time and 56 contract employees in South Korea as of December 31, 2025. Technical R&D accounted for 26 full-time staff (46.4%), marketing and global operations comprised 13 (23.2%), corporate/finance employed 11 (19.6%), and manufacturing/after-sales comprised 6 (10.7%).
The operating model separates software design from physical manufacturing:
* Fabless Silicon Architecture: Custom System-on-Chip (SoC) engineering (RF communication plus MCU-based AI ASIC) is executed in-house, while wafer manufacturing, foundry masks, and packaging are outsourced to commercial third-party foundries (e.g., TSMC or Samsung Electronics). Commercial SoC launch is targeted for Q1 2028 under an estimated $9.0 million capital requirement ($8.0 million for EDA software tools and IP licensing; $1.0 million for mask production).
* Component Procurement Concentration: Roze AI outsources sub-assembly manufacturing. In FY2025, three component suppliers accounted for 82.9% of total inventory purchases (Company A at 38.2%, Company B at 26.8%, and Company C at 17.9%). On the payables side, three vendors represented 78.3% of outstanding trade balances on December 31, 2025 (Company E at 31.8%, Company B at 27.5%, and Company D at 19.0%).
* Subcontractor Network: Physical on-site sensor installation is outsourced to an audited nationwide network of licensed electrical and fire-prevention subcontractors.
* Global Expansion Status: Vietnam operations transitioned to an asset-light distribution framework following the sale of subsidiary Rozeta Vina Ltd to CEO Young Jin Cho for $63,962 on December 19, 2024. Commercial product shipments to Vietnam are targeted for H2 2026. In the United States, an April 2023 non-binding MoU with PDI Global LLC involves zero committed capital over the next 12 months, targeting licensing and revenue-sharing deployments in H2 2026.
Intellectual property consists of 20 granted patents (17 registered with KIPO in South Korea, 2 with the USPTO in the United States, and 1 under PCT), alongside 22 pending patent applications, 15 trademarks, and 6 design marks. Core US patents comprise US 11,488,460 B2 (Mesh Transmitter Alarm, expires March 2040) and US 12,183,185 B2 (RF Signal Filtering Batch Function, expires March 2041). In South Korea, Korean Patent No. 10-123763 (Fire Alarm System - Gateway Type) was invalidated in lower proceedings and remains subject to ongoing appeal litigation.
HDIN Institutional Verdict
Roze AI Inc. relies on a certified domestic niche in South Korean B2G public procurement—anchored by its Public Procurement Service (PPS) "Excellent Product" designation and LH New Technology integration—to capture project revenue across military bases, municipal facilities, and public housing complexes. However, management's positioning of the enterprise as a scalable AI software business conflicts with its transactional reality: 100% of revenue in FY2024 and FY2025 derived from point-in-time, project-based hardware deployments. The planned transition to recurring SaaS maintenance (DAP Cloud / RozeVerse) remains in testing stages and is not forecasted to generate material revenue within the next 12 months.
The corporate governance structure insulates executive control while utilizing statutory reporting carve-outs:
* Voting Disconnect: Founder & CEO Young Jin Cho acquired 61,000,000 Class A Preferred Shares on April 3, 2025 for CAD $6,100 ($4,261 USD; $0.0001 per share), securing 52.3% of basic voting power. Post-listing consulting agreements allocate an additional 7,250,000 Common Shares to the CEO, elevating total voting control to 61.0% against an economic ownership interest of 22.7%.
* Governance Oversight Deficits: Exercising Nasdaq Controlled Company exemptions and Canadian Foreign Private Issuer (BCBCA) status, the board operates without an independent compensation committee or nominating committee.
* Forensic Audit Findings: In Note 2(aa), independent auditors explicitly state that related-party transactions cannot be presumed to be carried out on an arm's-length basis. Related-party transactions include historical sales to COO Seog Hun Cho’s entity DT Lab ($1,794,744 in FY2023; $228,540 in FY2024, alongside $168,130 in commissions and R&D fees), the transfer of 100% of the Vietnamese distribution subsidiary to CEO Cho for $63,962, an outstanding officer loan payable to the CEO of $358,706 at 3.6% interest, an officer loan receivable from CFO Seon Ho Lee of $69,226 at 4.6% interest, and $2,071,607 in personal bank debt guarantees provided by the CEO to secure Industrial Bank of Korea (IBK) credit facilities.
Liquidity pressures were temporarily mitigated by subsequent financing, but at the cost of structural equity dilution:
* Post-Period Financing: In January 2026, the company issued $1,055,543 in convertible bonds. On September 28, 2026, Roze AI completed a private placement of 1,250,000 Class C Preferred Shares at $8.00 per share, yielding $10,000,000 gross ($9,360,000 net after $640,000 in placement agent fees and expenses).
* Pro Forma Capitalization: The cash balance expanded to $11,499,456 (providing 44.5 months of operational burn coverage), total debt stood at $7,505,673, and stockholders’ equity shifted to positive $9,043,573.
* Structured Financing Overhang: Form F-1 registers 19,814,230 Common Shares for resale by selling shareholders (including 18,750,000 Class C conversion shares and 1,064,230 Dawson James advisory shares), expanding public float by 142.8% without generating primary proceeds for the company.
* Floating Reset Exposure: Class C Preferred Shares incorporate a cumulative 12% annual dividend ($0.96/share/yr), a 1.5x Event of Default multiplier (increasing stated value from $10.00 to $15.00 per share), full-ratchet anti-dilution reset provisions, and a conversion formula pegged to the lower of $8.00 or 80% of the 5-day lowest closing price, stepping down to a $1.00 floor.
Table Fully Diluted Share Capital Structure
| Capital Source / Instrument | Underlying Common Shares | Exercise / Conversion Terms | Fully Diluted Share Base (%) |
| Basic Common Shares Outstanding | 55,643,389 | Basic Issued Shares | 63.75% |
| CEO Milestone Equity Grant | 7,250,000 | Consulting Agreement Grant (1-Yr Lock-Up) | 8.31% |
| Class C Preferred Conversion (Max 150% Default Case) | 18,750,000 | Variable formula down to $1.00 Floor | 21.48% |
| Consultant Warrants (MavDB / David Bartch) | 4,260,000 | $8.00 Exercise (Expires March 2029) | 4.88% |
| Unexercised Stock Options | 807,972 | $0.87 Weighted Average Exercise | 0.93% |
| Convertible Bonds (#1, #7, #8, #9) | 569,950 | KRW 7,500 – KRW 10,150 ($5.61 – $7.29) | 0.65% |
| Total Fully Diluted Max Share Count | 87,281,511 | Master Capital Base | 100.00% |
The fully diluted share count expands 56.86% from 55.64 million to 87.28 million shares, imposing an immediate 36.25% economic dilution on existing Common shareholders.
Simultaneously executing the $9.0 million SoC R&D budget, servicing $4.46 million in bank debt obligations, and funding project working capital across its $252.2 million 12-month domestic project pipeline—which includes the $137.8 million Inwoobus Yeongcheon Data Center project—requires an estimated $18.55 million against $11.50 million in pro forma liquidity. Unless Roze AI rapidly collects project advances or executes secondary market refinancing by 2027, available cash will be absorbed by debt service and fixed overhead before proprietary silicon commercialization can be realized.
Presentation Download & Video Access
* Presentation Download: Click the PDF download link under 'Related Topics' to access the full institutional presentation of this report.
* Video Link: Click this link to watch the HDIN analyst briefing on YouTube.
About HDIN Research
HDIN Research is a premier global market intelligence and strategic advisory firm specializing in institutional-grade financial analysis, supply chain audits, and macroeconomic forecasting. Our dedicated sector analysts deliver actionable, data-driven insights tailored for private equity, hedge funds, and corporate strategy teams. Visit us at http://www.hdinresearch.com.
2026 AI Transparency Footer
This intelligence report was authored by HDIN Research analysts following a rigorous audit of official corporate filings. AI was utilized for massive-scale data synthesis and structural drafting, ensuring 100% inclusion of reported data points. All strategic insights, financial modeling, and final verdicts were verified by our editorial board to ensure professional accuracy and compliance with 2026 Google Search E-E-A-T standards.