Nidec Corporation: Balance Sheet Clean-Up and AI Infrastructure Pivot Follow ¥632 Billion Impairment Shock
Date : 2026-10-08
Reading : 219
HDIN Executive Takeaways
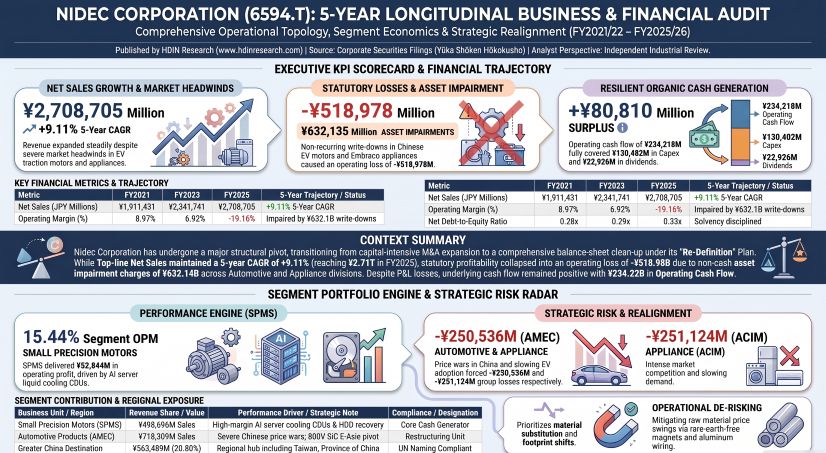
1. Nidec Corporation posted an operating loss of ¥518,978 million in FY2025 despite net sales growing 3.93% YoY to ¥2,708,705 million, driven by ¥632,135 million in non-financial asset impairments across automotive and appliance divisions.
2. The group generated ¥234,218 million in operating cash flow, fully covering capital expenditures of ¥130,482 million and dividends of ¥22,926 million to yield an organic cash surplus of ¥80,810 million, while holding ¥852,204 million in cash.
3. Management is shifting capex away from Chinese EV traction motor lines toward AI server liquid cooling and grid-scale battery storage, targeting a consolidation of operating entities from 353 down to 160–180 by 2030.
Figure NIDEC CORPORATION 5-YEAR LONGITUDINAL BUSINESS & FINANCIAL AUDIT
 Segment Divergence and Structural Impairment Charges
Nidec Corporation [TYO: 6594] experienced a sharp operational divergence between its high-margin small precision motor business and its commoditized automotive and appliance product groups in FY2025. While top-line consolidated sales reached ¥2,708,705 million, the company recognized an operating loss of -¥518,978 million due to structural non-financial asset write-downs totaling ¥632,135 million. The net loss attributable to owners was -¥564,624 million.
The Small Precision Motors (SPMS) reportable segment expanded its operating profit margin (OPM) by 422 basis points (bps) to 15.44%, generating ¥62,844 million on net sales of ¥406,983 million. The product group category of SPMS generated ¥498,696 million in net sales, buoyed by a 9.8% recovery in hard disk drive (HDD) spindle motors to ¥110,152 million and over 10,000 unit shipments of Coolant Distribution Units (CDUs) for AI data center liquid cooling infrastructure.
Conversely, the Automotive Products (AMEC) product group plunged into an operating loss of -¥250,536 million (OPM of -34.88%, down 3,867 bps YoY), impacted by price competition in China, slowing electric vehicle (EV) adoption, and ¥210,085 million in asset impairments. The Appliance, Commercial & Industrial (ACIM) product group posted an operating loss of -¥251,124 million (OPM of -22.73%, down 3,297 bps YoY), driven by ¥335,139 million in asset write-downs across Embraco refrigeration compressor assets and domestic Chinese motor manufacturing units.
Table Product Group Financial Performance and Operating Margin Analysis
Table Reportable Segment Financial Performance and Operating Margin Analysis
Consolidated goodwill dropped 52.14% YoY from ¥355,694 million to ¥170,238 million as of March 31, 2026. The company wrote off 100% of goodwill balances in ACIM (¥106,912 million), Nidec Mobility Corporation (¥37,902 million), Nidec Instruments Corporation (¥30,967 million), Nidec-PSA emotors SAS (¥8,917 million), and Nidec Techno Motor Corporation (¥2,049 million). Indefinite-lived trademarks contracted 44.93% YoY to ¥38,885 million, led by a ¥33,313 million impairment in Embraco trademarks.
Table Goodwill by CGU and Acquired Business Unit: Impairment and Carrying-Value Changes
Total interest-bearing debt stood at ¥1,113,404 million as of March 31, 2026, comprising ¥587,026 million in short-term borrowings, ¥82,481 million in current portion of long-term debt, ¥304,082 million in long-term borrowings, ¥69,930 million in corporate unsecured bonds, and ¥69,885 million in lease liabilities. Offsetting this, cash and cash equivalents totaled ¥852,204 million, resulting in net debt of ¥261,200 million and a net debt-to-equity ratio of 0.329x on a total equity base of ¥794,164 million. Contract loss reserves rose to ¥73,577 million, with vehicle inverter contracts representing ¥71,042 million. Product warranty reserves stood at ¥26,268 million.
Decentralized Operating Architecture and Supply Footprint
Nidec operates across more than 40 countries, with overseas destination sales representing 85.51% (¥2,316,055 million) of total revenue in FY2025. Non-current assets outside Japan account for 85.01% (¥642,199 million) of the group's ¥755,446 million total non-current asset base. As of March 31, 2026, the company employed 100,329 full-time employees and 21,550 temporary workers across 341 consolidated subsidiaries.
Table Geographic Sales Distribution by Customer Destination
Manufacturing hubs are distributed to match demand centers under management's "Made-in-Market" framework:
* SPMS and Electronics Production: Concentrated across Southeast Asia, with Nidec Electronics (Thailand) Co., Ltd. operating HDD spindle motor capacity in Pathum Thani and Ayutthaya, and Nidec Vietnam Corporation supplying precision motors from Ho Chi Minh City. In Taiwan, Province of China, Nidec Chaun-Choung Technology Corporation and Nidec CCI manufacture AI liquid cooling server components and heat sinks.
* Automotive Traction and Industrial Assembly: Centered in Novi Sad, Serbia for European electric vehicle powertrains, alongside Nidec GPM facilities in Germany and Poland. Industrial Battery Energy Storage Systems (BESS) and high-voltage drives are assembled by Nidec ASI S.p.A. in Milan, Italy. Chinese capacity is anchored in Pinghu and Dalian for E-Axles, and Dongguan for precision motors.
* Americas Footprint: Nidec Holding America Corporation operates industrial motor hubs across Missouri and Ohio, with automotive production in Mexico. Nidec Global Appliance Brasil Ltda. runs Embraco compressor manufacturing in Joinville, Santa Catarina, Brazil.
* Flagship R&D Facility: Nidec Park C (Building #2) in Muko City, Kyoto, carries a total projected capital commitment of ¥200,000 million through 2030, with cumulative capex reaching ¥27,072 million as of March 31, 2026.
Capital expenditures in FY2025 totaled ¥130,482 million, distributed across MOEN (¥31,312 million; 1.24x Capex/D&A), ACIM (¥28,074 million; 1.48x Capex/D&A), Group Companies (¥26,871 million; 0.92x Capex/D&A), Machinery (¥14,828 million; 4.14x Capex/D&A), SPMS (¥13,776 million; 0.82x Capex/D&A), and AMEC (¥13,592 million; 2.72x Capex/D&A).
To manage input exposure, Nidec has engineered Dysprosium (Dy) and Terbium (Tb)-free permanent magnets to reduce reliance on imported heavy rare earths, while replacing copper magnet wiring with aluminum windings in commercial appliance and HVAC lines. The group holds ¥31,695 million in foreign exchange forward contracts and ¥1,799 million in commodity futures contracts as financial hedges.
HDIN Institutional Verdict
Nidec’s balance sheet derecognition represents a calculated abandonment of its historical top-line aggregation model. The writedown of ¥632,135 million across ACIM, AMEC, and Nidec Mobility removes past goodwill created by bolt-on M&A that failed to yield cross-selling synergies amid aggressive pricing by Chinese domestic OEMs. By taking the full impairment hit in FY2025, executive leadership has eliminated overhang from underperforming assets, setting lower benchmark depreciation schedules for subsequent reporting cycles.
The divergence between the statutory net loss of -¥564,624 million and positive operating cash flow of ¥234,218 million demonstrates that core industrial manufacturing operations continue to generate cash. Capital expenditures of ¥130,482 million were self-funded without expanding net leverage, leaving Nidec with a net debt-to-equity ratio of 0.329x and ¥1,822,916 million in unused credit commitment lines.
However, management's "Re-Definition" transformation faces structural execution challenges. Consolidating 341 consolidated subsidiaries into 160–180 legal entities will test post-merger integration systems that previously allowed internal control breakdowns, improper accounting, and country-of-origin misclassifications at US subsidiary FIR (Nidec Drive Systems).
While the SPMS division's expansion into AI server liquid cooling (CDUs) provides near-term margin support, it exposes Nidec to hyperscaler concentration risk. Concurrently, Nidec’s remaining ¥121,703 million in MOEN goodwill assumes high utilization in grid-scale energy storage (BESS) and industrial drives. If utility infrastructure capex decelerates or commoditization replicates the Chinese EV pricing dynamic in power electronics, Nidec will face additional impairment cycles. Capital discipline under the restructured board—now 83.3% independent—remains the sole operational buffer against further capital destruction.
Presentation Download & Video Access:
- Presentation Download: Click the PDF download link under 'Related Topics' to access the full institutional presentation of this report.
- Video Link: Click this link to watch the HDIN analyst briefing on YouTube.
About HDIN Research:
HDIN Research is a premier global market intelligence and strategic advisory firm specializing in institutional-grade financial analysis, supply chain audits, and macroeconomic forecasting. Our dedicated sector analysts deliver actionable, data-driven insights tailored for private equity, hedge funds, and corporate strategy teams. Visit us at http://www.hdinresearch.com.
2026 AI Transparency Footer:
"This intelligence report was authored by HDIN Research analysts following a rigorous audit of official corporate filings. AI was utilized for massive-scale data synthesis and structural drafting, ensuring 100% inclusion of reported data points. All strategic insights, financial modeling, and final verdicts were verified by our editorial board to ensure professional accuracy and compliance with 2026 Google Search E-E-A-T standards."
1. Nidec Corporation posted an operating loss of ¥518,978 million in FY2025 despite net sales growing 3.93% YoY to ¥2,708,705 million, driven by ¥632,135 million in non-financial asset impairments across automotive and appliance divisions.
2. The group generated ¥234,218 million in operating cash flow, fully covering capital expenditures of ¥130,482 million and dividends of ¥22,926 million to yield an organic cash surplus of ¥80,810 million, while holding ¥852,204 million in cash.
3. Management is shifting capex away from Chinese EV traction motor lines toward AI server liquid cooling and grid-scale battery storage, targeting a consolidation of operating entities from 353 down to 160–180 by 2030.
Figure NIDEC CORPORATION 5-YEAR LONGITUDINAL BUSINESS & FINANCIAL AUDIT
Segment Divergence and Structural Impairment ChargesNidec Corporation [TYO: 6594] experienced a sharp operational divergence between its high-margin small precision motor business and its commoditized automotive and appliance product groups in FY2025. While top-line consolidated sales reached ¥2,708,705 million, the company recognized an operating loss of -¥518,978 million due to structural non-financial asset write-downs totaling ¥632,135 million. The net loss attributable to owners was -¥564,624 million.
The Small Precision Motors (SPMS) reportable segment expanded its operating profit margin (OPM) by 422 basis points (bps) to 15.44%, generating ¥62,844 million on net sales of ¥406,983 million. The product group category of SPMS generated ¥498,696 million in net sales, buoyed by a 9.8% recovery in hard disk drive (HDD) spindle motors to ¥110,152 million and over 10,000 unit shipments of Coolant Distribution Units (CDUs) for AI data center liquid cooling infrastructure.
Conversely, the Automotive Products (AMEC) product group plunged into an operating loss of -¥250,536 million (OPM of -34.88%, down 3,867 bps YoY), impacted by price competition in China, slowing electric vehicle (EV) adoption, and ¥210,085 million in asset impairments. The Appliance, Commercial & Industrial (ACIM) product group posted an operating loss of -¥251,124 million (OPM of -22.73%, down 3,297 bps YoY), driven by ¥335,139 million in asset write-downs across Embraco refrigeration compressor assets and domestic Chinese motor manufacturing units.
Table Product Group Financial Performance and Operating Margin Analysis
| Product Group Category | FY2024 Net Sales (¥M) | FY2025 Net Sales (¥M) | YoY Sales Change (%) | FY2024 Operating Profit (¥M) | FY2025 Operating Profit (¥M) | FY2024 OPM (%) | FY2025 OPM (%) | OPM Shift (bps) |
| Small Precision Motors (SPMS) | ¥487,994 | ¥498,696 | +2.19% | ¥61,651 | ¥29,995 | 12.63% | 6.01% | -662 bps |
| — Hard Disk Drive Motors | ¥100,339 | ¥110,152 | +9.78% | — | — | — | — | — |
| — Other Small Motors | ¥387,655 | ¥388,544 | +0.23% | — | — | — | — | — |
| Automotive Products (AMEC) | ¥666,791 | ¥718,309 | +7.73% | ¥25,255 | (¥250,536) | 3.79% | -34.88% | -3,867 bps |
| Appliance, Commercial & Industrial | ¥1,052,308 | ¥1,104,605 | +4.97% | ¥107,655 | (¥251,124) | 10.23% | -22.73% | -3,297 bps |
| Machinery (Equipment & Robotics) | ¥310,532 | ¥298,782 | -3.78% | (¥64,609) | (¥930) | -20.81% | -0.31% | +2,050 bps |
| Electronic & Optical Components | ¥85,190 | ¥84,560 | -0.74% | ¥13,281 | ¥2,415 | 15.59% | 2.86% | -1,273 bps |
| Others | ¥3,532 | ¥3,753 | +6.26% | ¥134 | ¥508 | 3.79% | 13.54% | +975 bps |
| Consolidated Total | ¥2,606,347 | ¥2,708,705 | +3.93% | ¥128,222 | (¥518,978) | 4.92% | -19.16% | -2,408 bps |
Table Reportable Segment Financial Performance and Operating Margin Analysis
| Reportable Operating Segment | FY2024 Net Sales (¥M) | FY2025 Net Sales (¥M) | YoY Sales Change (%) | FY2024 Operating Profit (¥M) | FY2025 Operating Profit (¥M) | FY2024 OPM (%) | FY2025 OPM (%) | OPM Shift (bps) |
| Small Precision Motors (SPMS) | ¥395,695 | ¥406,983 | +2.85% | ¥44,386 | ¥62,844 | 11.22% | 15.44% | +422 bps |
| Automotive Products (AMEC) | ¥354,953 | ¥370,083 | +4.26% | ¥53 | (¥25,089) | 0.01% | -6.78% | -679 bps |
| Motion & Energy (MOEN) | ¥577,832 | ¥706,529 | +22.27% | ¥68,919 | (¥72,573) | 11.93% | -10.27% | -2,220 bps |
| Appliance, Commercial & Industrial | ¥467,849 | ¥443,991 | -5.10% | ¥35,668 | (¥289,333) | 7.62% | -65.17% | -7,279 bps |
| Machinery Business | ¥216,890 | ¥211,588 | -2.44% | (¥84,926) | (¥13,827) | -39.15% | -6.54% | +3,261 bps |
| Group Companies Business | ¥666,073 | ¥635,347 | -4.61% | ¥79,175 | (¥131,711) | 11.89% | -20.73% | -3,262 bps |
Consolidated goodwill dropped 52.14% YoY from ¥355,694 million to ¥170,238 million as of March 31, 2026. The company wrote off 100% of goodwill balances in ACIM (¥106,912 million), Nidec Mobility Corporation (¥37,902 million), Nidec Instruments Corporation (¥30,967 million), Nidec-PSA emotors SAS (¥8,917 million), and Nidec Techno Motor Corporation (¥2,049 million). Indefinite-lived trademarks contracted 44.93% YoY to ¥38,885 million, led by a ¥33,313 million impairment in Embraco trademarks.
Table Goodwill by CGU and Acquired Business Unit: Impairment and Carrying-Value Changes
| CGU Group / Acquired Business Unit | FY2024 Goodwill (¥M) | FY2025 Goodwill (¥M) | Net Impairment & Shift (¥M) | Impairment Status & Accounting Treatment |
| Small Precision Motors (SPMS) | ¥19,488 | ¥21,061 | +¥1,573 | Intact; expansion due to foreign exchange translation |
| Motion & Energy (MOEN) | ¥116,588 | ¥121,703 | +¥5,115 | Intact; supported by utility-scale BESS order backlog |
| Nidec-PSA emotors SAS | ¥8,917 | ¥0 | -¥8,917 | 100% Written Off; European EV traction joint venture |
| Appliance, Commercial & Industrial | ¥106,912 | ¥0 | -¥106,912 | 100% Written Off; Embraco and Chinese appliance units |
| PAMA S.p.A. | ¥2,584 | ¥2,971 | +¥387 | Intact; machine tool operations |
| Nidec Instruments Corporation | ¥30,967 | ¥0 | -¥30,967 | 100% Written Off; robotics and card reader units |
| Nidec Mobility Corporation | ¥37,902 | ¥0 | -¥37,902 | 100% Written Off; automotive electronic body controls |
| Nidec Techno Motor Corporation | ¥2,049 | ¥0 | -¥2,049 | 100% Written Off; fan and air conditioner motors |
| Nidec Advance Technology Corporation | ¥2,340 | ¥2,461 | +¥121 | Intact; inspection and semiconductor equipment |
| Nidec Precision Corporation | ¥16,410 | ¥11,567 | -¥4,843 | Partially Written Off; optical shutter mechanisms |
| Other CGU Groups | ¥11,537 | ¥10,475 | -¥1,062 | Minor adjustments across industrial subsidiaries |
| Consolidated Group Goodwill Total | ¥355,694 | ¥170,238 | -¥185,456 | -52.14% YoY Consolidated Carrying Value Reduction |
Total interest-bearing debt stood at ¥1,113,404 million as of March 31, 2026, comprising ¥587,026 million in short-term borrowings, ¥82,481 million in current portion of long-term debt, ¥304,082 million in long-term borrowings, ¥69,930 million in corporate unsecured bonds, and ¥69,885 million in lease liabilities. Offsetting this, cash and cash equivalents totaled ¥852,204 million, resulting in net debt of ¥261,200 million and a net debt-to-equity ratio of 0.329x on a total equity base of ¥794,164 million. Contract loss reserves rose to ¥73,577 million, with vehicle inverter contracts representing ¥71,042 million. Product warranty reserves stood at ¥26,268 million.
Decentralized Operating Architecture and Supply Footprint
Nidec operates across more than 40 countries, with overseas destination sales representing 85.51% (¥2,316,055 million) of total revenue in FY2025. Non-current assets outside Japan account for 85.01% (¥642,199 million) of the group's ¥755,446 million total non-current asset base. As of March 31, 2026, the company employed 100,329 full-time employees and 21,550 temporary workers across 341 consolidated subsidiaries.
Table Geographic Sales Distribution by Customer Destination
| Customer Destination Region | FY2024 Sales (¥M) | FY2024 Share (%) | FY2025 Sales (¥M) | FY2025 Share (%) | YoY Growth (%) | Primary Sub-Markets Disclosed |
| Europe | ¥596,326 | 22.88% | ¥670,455 | 24.75% | +12.43% | France, Germany, Italy, Serbia, Poland |
| North America | ¥594,627 | 22.81% | ¥617,423 | 22.80% | +3.83% | United States, Canada, Mexico |
| China (incl. HK and Taiwan, Province of China) | ¥549,835 | 21.09% | ¥563,489 | 20.80% | +2.48% | Mainland China, Hong Kong, Taiwan, Province of China |
| Japan (Domestic) | ¥402,125 | 15.43% | ¥392,650 | 14.49% | -2.36% | Domestic Japanese OEM and industrial market |
| Other Asian Regions | ¥350,159 | 13.43% | ¥362,066 | 13.37% | +3.40% | Thailand, Republic of Korea, India, Vietnam, Singapore |
| Other Areas | ¥113,275 | 4.35% | ¥102,622 | 3.79% | -9.40% | Brazil, Mexico, Other Americas |
| Consolidated Sales Total | ¥2,606,347 | 100.00% | ¥2,708,705 | 100.00% | +3.93% | Global external customer destinations |
Manufacturing hubs are distributed to match demand centers under management's "Made-in-Market" framework:
* SPMS and Electronics Production: Concentrated across Southeast Asia, with Nidec Electronics (Thailand) Co., Ltd. operating HDD spindle motor capacity in Pathum Thani and Ayutthaya, and Nidec Vietnam Corporation supplying precision motors from Ho Chi Minh City. In Taiwan, Province of China, Nidec Chaun-Choung Technology Corporation and Nidec CCI manufacture AI liquid cooling server components and heat sinks.
* Automotive Traction and Industrial Assembly: Centered in Novi Sad, Serbia for European electric vehicle powertrains, alongside Nidec GPM facilities in Germany and Poland. Industrial Battery Energy Storage Systems (BESS) and high-voltage drives are assembled by Nidec ASI S.p.A. in Milan, Italy. Chinese capacity is anchored in Pinghu and Dalian for E-Axles, and Dongguan for precision motors.
* Americas Footprint: Nidec Holding America Corporation operates industrial motor hubs across Missouri and Ohio, with automotive production in Mexico. Nidec Global Appliance Brasil Ltda. runs Embraco compressor manufacturing in Joinville, Santa Catarina, Brazil.
* Flagship R&D Facility: Nidec Park C (Building #2) in Muko City, Kyoto, carries a total projected capital commitment of ¥200,000 million through 2030, with cumulative capex reaching ¥27,072 million as of March 31, 2026.
Capital expenditures in FY2025 totaled ¥130,482 million, distributed across MOEN (¥31,312 million; 1.24x Capex/D&A), ACIM (¥28,074 million; 1.48x Capex/D&A), Group Companies (¥26,871 million; 0.92x Capex/D&A), Machinery (¥14,828 million; 4.14x Capex/D&A), SPMS (¥13,776 million; 0.82x Capex/D&A), and AMEC (¥13,592 million; 2.72x Capex/D&A).
To manage input exposure, Nidec has engineered Dysprosium (Dy) and Terbium (Tb)-free permanent magnets to reduce reliance on imported heavy rare earths, while replacing copper magnet wiring with aluminum windings in commercial appliance and HVAC lines. The group holds ¥31,695 million in foreign exchange forward contracts and ¥1,799 million in commodity futures contracts as financial hedges.
HDIN Institutional Verdict
Nidec’s balance sheet derecognition represents a calculated abandonment of its historical top-line aggregation model. The writedown of ¥632,135 million across ACIM, AMEC, and Nidec Mobility removes past goodwill created by bolt-on M&A that failed to yield cross-selling synergies amid aggressive pricing by Chinese domestic OEMs. By taking the full impairment hit in FY2025, executive leadership has eliminated overhang from underperforming assets, setting lower benchmark depreciation schedules for subsequent reporting cycles.
The divergence between the statutory net loss of -¥564,624 million and positive operating cash flow of ¥234,218 million demonstrates that core industrial manufacturing operations continue to generate cash. Capital expenditures of ¥130,482 million were self-funded without expanding net leverage, leaving Nidec with a net debt-to-equity ratio of 0.329x and ¥1,822,916 million in unused credit commitment lines.
However, management's "Re-Definition" transformation faces structural execution challenges. Consolidating 341 consolidated subsidiaries into 160–180 legal entities will test post-merger integration systems that previously allowed internal control breakdowns, improper accounting, and country-of-origin misclassifications at US subsidiary FIR (Nidec Drive Systems).
While the SPMS division's expansion into AI server liquid cooling (CDUs) provides near-term margin support, it exposes Nidec to hyperscaler concentration risk. Concurrently, Nidec’s remaining ¥121,703 million in MOEN goodwill assumes high utilization in grid-scale energy storage (BESS) and industrial drives. If utility infrastructure capex decelerates or commoditization replicates the Chinese EV pricing dynamic in power electronics, Nidec will face additional impairment cycles. Capital discipline under the restructured board—now 83.3% independent—remains the sole operational buffer against further capital destruction.
Presentation Download & Video Access:
- Presentation Download: Click the PDF download link under 'Related Topics' to access the full institutional presentation of this report.
- Video Link: Click this link to watch the HDIN analyst briefing on YouTube.
About HDIN Research:
HDIN Research is a premier global market intelligence and strategic advisory firm specializing in institutional-grade financial analysis, supply chain audits, and macroeconomic forecasting. Our dedicated sector analysts deliver actionable, data-driven insights tailored for private equity, hedge funds, and corporate strategy teams. Visit us at http://www.hdinresearch.com.
2026 AI Transparency Footer:
"This intelligence report was authored by HDIN Research analysts following a rigorous audit of official corporate filings. AI was utilized for massive-scale data synthesis and structural drafting, ensuring 100% inclusion of reported data points. All strategic insights, financial modeling, and final verdicts were verified by our editorial board to ensure professional accuracy and compliance with 2026 Google Search E-E-A-T standards."