Fusemachines Inc.: Capital Structure Restructuring and Nepal Delivery Center Pivot as 17-Day Cash Runway Forces Dilutive Debt Issuance
Date : 2026-10-12
Reading : 394
HDIN Executive Takeaways
1. Fusemachines Inc. [NASDAQ: FUSE] depleted unrestricted cash to $368 thousand against a net working capital deficit of $(16.75) million as of June 30, 2026, establishing an organic operating runway of 0.57 months (~17 days) at an H1 2026 net monthly cash drain of $642.2 thousand.
2. The operating architecture exhibits an acute geographic mismatch: 95.2% to 97.0% of revenues derive from billing clients in the United States of America, whereas over 90% of technical delivery personnel (270 full-time engineers) are concentrated in Kathmandu, Nepal, exposing delivery to local civil disruption and foreign exchange controls.
3. Registered resale dilution covers 7,549,411 common shares, expanding fully diluted equity to 54,485,389 shares (+67.4% overhang), while an impending October 22, 2026 lock-up expiration releases 21,800,837 insider shares into the public float ahead of a November 3, 2026 Nasdaq delisting hearing.
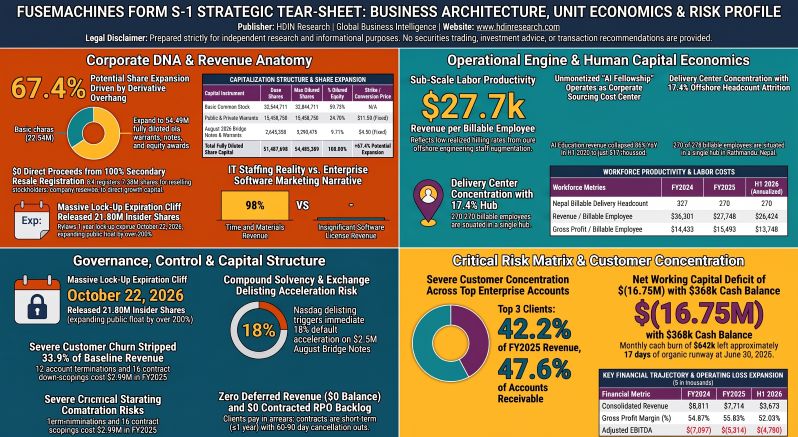
Figure FUSEMACHINES FORM S-1 STRATEGIC TEAR-SHEET BUSINESS ARCHITECTURE, UNIT ECONOMICS & RISK PROFILE
 Segmental Realities, Revenue Quality, and Operating Margin Compression
Fusemachines Inc. operates as a single reportable operating segment under U.S. GAAP (ASC 280) focusing on data engineering, artificial intelligence consulting, and technical services. Management's commercial narrative characterizes the business as an enterprise agentic AI platform provider across AI Studio, AI Engines, and AI Agents. However, official SEC Form S-1 financial note disclosures classify software product license revenue as insignificant across all reported periods. Revenue remains almost entirely driven by billable Time-and-Materials (T&M) professional services (98.3% of FY2025 revenue and 99.5% of H1 2026 revenue), recognized over time via the "Right to Invoice" practical expedient under ASC 606.
The consolidated top-line contracted 12.45% YoY in FY2024–FY2025 (falling from $8,811 thousand to $7,714 thousand) and contracted an additional 7.88% YoY in H1 2026 (falling from $3,987 thousand to $3,673 thousand). Net loss "improvements" in FY2025 were an accounting artifact: GAAP Net Loss contracted 93.97% from $(15,383) thousand in FY2024 to $(928) thousand in FY2025, driven entirely by $5,468 thousand in non-cash mark-to-market fair value gains on convertible debt and derivative liabilities under ASC 825. Core operations deteriorated, with Non-GAAP Adjusted EBITDA burning $(5,314) thousand in FY2025 and worsening 144.5% YoY in H1 2026 to $(4,780) thousand.
Table Consolidated Statements of Operations and Multi-Period Performance Analysis
Stock-based compensation (SBC) expanded 644% YoY in H1 2026 to $878 thousand (from $118 thousand in H1 2025). This was driven by the post-merger issuance of 1,217,210 Restricted Stock Units (RSUs) under the 2025 Omnibus Equity Incentive Plan in January 2026, which added $771 thousand in non-cash compensation ($741 thousand in G&A, $12 thousand in R&D, $10 thousand in S&M, and $8 thousand in Cost of Revenues). Stock option expense accounted for $107 thousand in H1 2026 ($74 thousand in G&A, $16 thousand in R&D, $10 thousand in Cost of Revenues, and $7 thousand in S&M).
Contract durability and client cohort dynamics show structural churn:
* Revenue Depletion via Customer Attrition: In FY2025, Fusemachines suffered 12 complete account cancellations and 16 contract down-scopings, stripping $(2,990) thousand in billings (33.9% gross churn against the FY2024 revenue base). Incremental billings of $1,910 thousand from 11 new logos and 9 expansions failed to offset this deficit, yielding a derived upper-bound Gross Retention Rate (GRR) of ~66.1% and Net Retention Rate (NRR) of ~75.7%.
* Absence of Revenue Cushion: Contract liabilities (deferred revenue) dropped from $54 thousand in FY2024 to $0 as of December 31, 2025, and remained at $0 as of June 30, 2026. Unbilled revenue (contract assets) contracted 85.8% from $113 thousand in FY2024 to $16 thousand as of June 30, 2026. Capitalized sales commissions stood at $20.6 thousand as of June 30, 2026 ($18.0 thousand current, $2.6 thousand non-current), amortized over a 2-year service lifecycle.
* Client Concentration: In FY2025, 3 enterprise customers accounted for 42.2% of total revenue ($3,255 thousand), with 3 customers accounting for 47.6% of accounts receivable ($602 thousand). In H1 2026, 3 clients represented 36.3% of revenue ($1,333 thousand) and 45.5% of accounts receivable ($516 thousand).
* Contractual Asymmetry: Customer Master Services Agreements (MSAs) are capped at terms of up to one year, contain no automatic renewal mechanisms, and allow clients to terminate for convenience on 60 to 90 days' notice. Under the ASC 606 practical expedient, the company reports $0 in Remaining Performance Obligations (RPO).
Infrastructure Layout, Offshore Labor Arbitrage, and Balance Sheet Liabilities
Fusemachines maintains an operating layout coupling commercial headquarters in New York, United States of America, with offshore software delivery infrastructure centered in Kathmandu, Nepal.
Table Global Operating Footprint: Delivery Architecture, Headcount & Geographic Cost Arbitrage
Physical infrastructure concentration in Kathmandu exposes the company to operational disruptions. Nationwide political protests, strikes, and work stoppages initiated on September 8, 2025, disrupted transportation, public utilities, and municipal services across central Kathmandu. Furthermore, Fusemachines Nepal Private Ltd. is undergoing an active tax examination by local Nepal authorities covering the 2023–2024 fiscal year regarding cross-border transfer pricing.
Delivery margins are further constrained by local capital encumbrances. The Kathmandu delivery center is owned via intermediate entity Fusemachines Nepal Inc., but is encumbered by Business Oxygen Private Limited (BO2). In July 2021, BO2 invested $964.2 thousand for 39,750 ordinary shares and 1,110,250 cumulative redeemable preference shares. Recognized as an ASC 480 liability of $1,050 thousand as of June 30, 2026, the instrument carries a 10.0% dividend, accretes at an effective interest rate of 13.7%, and includes a mandatory cash redemption put in 2026/2027 at 200% of purchase price ($1.49 million contractual cash obligation).
Labor productivity metrics reflect an offshore IT staffing agency model rather than a software platform:
* Revenue per Billable Employee was $26,301 in FY2024 (335 base), $27,748 in FY2025 (278 base), and $26,424 annualized in H1 2026.
* Revenue per Total Billable Head (including third-party contractors) was $23,434 in FY2024 (376 base) and $24,645 in FY2025 (313 base).
* Gross Profit per Billable Head was $12,859 in FY2024 and $13,760 in FY2025.
* Wage Inflation: Gross margin contracted 553 bps YoY in H1 2026 to 52.03% because Cost of Revenues expanded 4.14% YoY to $1,762 thousand despite falling revenue. Management attributed this cost growth to statutory and performance-based salary increments in Nepal. Contracts contain no Cost-of-Living Adjustment (COLA) provisions or wage pass-through clauses, forcing Fusemachines to absorb higher labor costs directly.
* Software Development Capitalization: Software capitalization is governed under ASC 350-40 and ASC 985-20. Additions totaled $144 thousand in FY2024 (16.44% capitalization rate against $732 thousand R&D), $112 thousand in FY2025 (13.46% against $720 thousand R&D), $54 thousand in H1 2025 (14.29% against $324 thousand R&D), and $88 thousand in H1 2026 (12.98% against $590 thousand R&D). Net capitalized software on the balance sheet was $226 thousand as of June 30, 2026 (amortized over 3 years, with $93.4 thousand amortized in FY2025 and $67 thousand in H1 2026 into G&A).
* Intellectual Property Deficits: Fusemachines holds 0 granted corporate patents and 8 pending applications, having never conducted an independent Freedom to Operate (FTO) search. By contrast, Founder Dr. Sameer Maskey holds 15 patents and applications in his personal name. Standard enterprise MSAs require Fusemachines to indemnify clients against third-party IP infringement without cap, creating unreserved legal exposure.
Working Capital Velocity, Capital Structure, and Governance Realignment
The corporate balance sheet reflects severe working capital deficits and debt pressure following the October 22, 2025 reverse recapitalization with CSLM Acquisition Corp.
Table Consolidated Balance Sheets, Liquidity Profile, and Capital Deficiency Analysis
Working capital velocity highlights stretched liabilities. Days Payable Outstanding (DPO) on Cost of Revenues stood at 600.1 days in FY2024, 537.0 days in FY2025, and 531.4 days in H1 2026. Evaluated against Total Cash Operating Costs, DPO measured 111.4 days in H1 2026. Accrued wages payable reached $3,827 thousand as of June 30, 2026, while Trade AP was $5,173 thousand. The company defaulted on installment payments ($52.0 thousand due May/June 2026) for S-4 printing and filing fees, triggering an unaccrued contingent penalty of $555.0 thousand as the vendor rescinded negotiated discounts. Additional unaccrued commitments include $1,116 thousand in undiscounted operating leases ($836 thousand balance sheet PV) and a $450 thousand remaining legal retainer with Dentons US LLP.
To address near-term liquidity depletion, Fusemachines executed emergency bridge financing on August 2, 2026, issuing $2,500 thousand face value Senior Unsecured Convertible Notes for $2,050 thousand net proceeds (18% Original Issue Discount). The notes mature on February 12, 2027, carry an 18% default interest rate, restrict the issuance of senior debt, require 33% of proceeds from any future financing to be directed toward debt service, and block access to the company's $20.0 million Committed Equity Facility (CEF) with Roth Principal Investments.
Table Capital Structure Analysis: Fully Diluted Share Capital, Derivative Overhang & Registration Coverage
Governance is characterized by insider concentration and executive turnover. Founder and CEO Dr. Sameer Maskey controls 18.33% of basic common stock (6,010,280 shares, including family trusts and 237,500 options), while the SPAC Sponsor Consilium Entities control 33.81% (11,944,765 shares). Institutional partner Meteora Capital holds 9.99% (contractually capped; 12.90% uncapped), and venture investor Dolma Impact Fund I holds 8.23% (2,677,293 shares). Four insider blocks control over 70% of total voting power.
Capital recycling transactions among insiders include:
* Founder Liquidity: In January 2024, the company bought back 667,000 shares from Dr. Maskey for $2,902.7 thousand ($2,000.0 thousand cash funded directly by Consilium Note A, and $902.7 thousand applied to extinguish a personal promissory note owed to the company). Dr. Maskey pledged 3,600,000 personal shares to secure Note A.
* CEO Promissory Notes: Dr. Maskey advanced $700.0 thousand via seven personal notes at 4.71% interest during 2024, which the company repaid in cash ($745.0 thousand) upon merger closing on October 22, 2025.
* Creditor Conflicts: Director Tim Gocher is CEO of Dolma Impact Fund I, which holds a $300.0 thousand related-party note that is past due and payable on demand. Gocher sits on no board committees.
* Separation Agreements: Former Director Sanjay Shrestha resigned on May 31, 2026; his firm (Shrestha Global EPG Advisory LLC) was retained 58 days later, receiving 247,158 registered common shares on September 10, 2026, to settle $150.0 thousand in advisory fees.
* Fractional CFO: Christine Chambers resigned as CFO on August 31, 2026. The company outsourced Principal Financial and Accounting Officer roles to David R. Wells via Atlas Bookkeeping, LLC on a month-to-month agreement ($14,500/month cash plus 10,000 RSUs/month, terminable on 30 days' notice).
* Accounting Controls: Independent auditor KNAV CPA LLP issued a Going Concern explanatory paragraph. Management reported material weaknesses in internal controls over financial reporting, citing reliance on basic QuickBooks software, insufficient finance personnel, and control deficiencies that led to improper revenue recognition.
HDIN Institutional Verdict
Fusemachines Inc. operates with an inverted risk-reward structure. Management's public positioning emphasizes scalable enterprise agentic AI software, but the company's financial model reflects a sub-scale IT engineering staffing contractor experiencing top-line contraction and margin erosion. The business model generates gross margins of 52.0% to 55.8%, holds zero multi-year contracted backlog, and maintains $0 in deferred revenue, relying on billable Forward Deployed Engineers deployed on short-term contracts.
The company's cost structure is disconnected from its commercial profile. Corporate G&A surged 78.65% YoY in H1 2026 to $6,251 thousand, driven by public company overhead, legal retainers, and executive RSU vestings. With an operating cash burn of $585.2 thousand per month and net cash burn of $642.2 thousand per month against an unrestricted cash balance of $368 thousand as of June 30, 2026, internal cash generation was exhausted by mid-2026.
Table FUSEMACHINES CRITICAL EVENT TIMELINE
The August 2, 2026 bridge financing ($2.05 million net proceeds) extended liquidity into the fourth quarter of 2026, but created severe structural constraints:
* Restrictive Covenants: The bridge notes carry an 18% default interest rate, sweep 33% of future financings, and restrict the drawdown of the $20.0 million Roth Committed Equity Facility.
* Lock-Up Supply Influx: The expiration of the Section 7.14 Bylaws lock-up on October 22, 2026, releases 21,800,837 shares held by the SPAC Sponsor, Founder, and early venture backers, expanding the tradeable float threefold.
* Delisting Acceleration: The November 3, 2026 Nasdaq Hearings Panel review regarding the $50.0 million Market Value of Listed Securities deficiency represents an immediate operational risk. A delisting determination constitutes a default under the August 2026 Notes, which would accelerate repayment of the $2.50 million principal.
Without substantial new equity capital, debt restructuring, and a stabilization of its commercial customer base, Fusemachines faces an acute solvency cliff heading into early 2027.
Presentation Download & Video Access
- Presentation Download: Click the PDF download link under 'Related Topics' to access the full institutional presentation of this report.
- Video Link: Click this link to watch the HDIN analyst briefing on YouTube.
About HDIN Research
HDIN Research is a premier global market intelligence and strategic advisory firm specializing in institutional-grade financial analysis, supply chain audits, and macroeconomic forecasting. Our dedicated sector analysts deliver actionable, data-driven insights tailored for private equity, hedge funds, and corporate strategy teams. Visit us at http://www.hdinresearch.com.
2026 AI Transparency Footer
"This intelligence report was authored by HDIN Research analysts following a rigorous audit of official corporate filings. AI was utilized for massive-scale data synthesis and structural drafting, ensuring 100% inclusion of reported data points. All strategic insights, financial modeling, and final verdicts were verified by our editorial board to ensure professional accuracy and compliance with 2026 Google Search E-E-A-T standards."
1. Fusemachines Inc. [NASDAQ: FUSE] depleted unrestricted cash to $368 thousand against a net working capital deficit of $(16.75) million as of June 30, 2026, establishing an organic operating runway of 0.57 months (~17 days) at an H1 2026 net monthly cash drain of $642.2 thousand.
2. The operating architecture exhibits an acute geographic mismatch: 95.2% to 97.0% of revenues derive from billing clients in the United States of America, whereas over 90% of technical delivery personnel (270 full-time engineers) are concentrated in Kathmandu, Nepal, exposing delivery to local civil disruption and foreign exchange controls.
3. Registered resale dilution covers 7,549,411 common shares, expanding fully diluted equity to 54,485,389 shares (+67.4% overhang), while an impending October 22, 2026 lock-up expiration releases 21,800,837 insider shares into the public float ahead of a November 3, 2026 Nasdaq delisting hearing.
Figure FUSEMACHINES FORM S-1 STRATEGIC TEAR-SHEET BUSINESS ARCHITECTURE, UNIT ECONOMICS & RISK PROFILE
Segmental Realities, Revenue Quality, and Operating Margin CompressionFusemachines Inc. operates as a single reportable operating segment under U.S. GAAP (ASC 280) focusing on data engineering, artificial intelligence consulting, and technical services. Management's commercial narrative characterizes the business as an enterprise agentic AI platform provider across AI Studio, AI Engines, and AI Agents. However, official SEC Form S-1 financial note disclosures classify software product license revenue as insignificant across all reported periods. Revenue remains almost entirely driven by billable Time-and-Materials (T&M) professional services (98.3% of FY2025 revenue and 99.5% of H1 2026 revenue), recognized over time via the "Right to Invoice" practical expedient under ASC 606.
The consolidated top-line contracted 12.45% YoY in FY2024–FY2025 (falling from $8,811 thousand to $7,714 thousand) and contracted an additional 7.88% YoY in H1 2026 (falling from $3,987 thousand to $3,673 thousand). Net loss "improvements" in FY2025 were an accounting artifact: GAAP Net Loss contracted 93.97% from $(15,383) thousand in FY2024 to $(928) thousand in FY2025, driven entirely by $5,468 thousand in non-cash mark-to-market fair value gains on convertible debt and derivative liabilities under ASC 825. Core operations deteriorated, with Non-GAAP Adjusted EBITDA burning $(5,314) thousand in FY2025 and worsening 144.5% YoY in H1 2026 to $(4,780) thousand.
Table Consolidated Statements of Operations and Multi-Period Performance Analysis
| Financial Performance Metric (in $ thousands) | FY2024 (Audited) | FY2025 (Audited) | YoY (%) | H1 2025 (6M) | H1 2026 (6M) | YoY (%) | Q2 2025 | Q2 2026 | YoY (%) | Derived Q1 2026 | QoQ (%) (Q2 vs Q1 '26) |
| AI Solutions (Products & Services) | $8,811 | $7,581 | -13.96% | $3,866 | $3,656 | -5.43% | $1,913 | $1,784 | -6.74% | $1,872 | -4.70% |
| AI Education Services | $0 | $133 | N/A | $121 | $17 | -85.95% | $121 | $10 | -91.74% | $7 | +42.86% |
| Consolidated Revenue | $8,811 | $7,714 | -12.45% | $3,987 | $3,673 | -7.88% | $2,034 | $1,794 | -11.80% | $1,879 | -4.52% |
| Cost of Revenues | $(3,976) | $(3,407) | -14.31% | $(1,692) | $(1,762) | +4.14% | $(828) | $(831) | +0.36% | $(931) | -10.74% |
| Gross Profit | $4,835 | $4,307 | -10.92% | $2,295 | $1,911 | -16.73% | $1,206 | $963 | -20.15% | $948 | +1.58% |
| Gross Margin (%) | 54.87% | 55.83% | +96 bps | 57.56% | 52.03% | -553 bps | 59.29% | 53.68% | -561 bps | 50.45% | +323 bps |
| Sales & Marketing (S&M) | $1,964 | $1,365 | -30.50% | $641 | $795 | +24.02% | $333 | $383 | +15.02% | $412 | -7.04% |
| General & Administrative (G&A) | $10,333 | $8,176 | -20.88% | $3,499 | $6,251 | +78.65% | $1,566 | $2,978 | +90.17% | $3,273 | -9.01% |
| Research & Development (R&D) | $732 | $720 | -1.64% | $324 | $590 | +82.10% | $159 | $292 | +83.65% | $298 | -2.01% |
| Total Operating Expenses | $13,029 | $10,261 | -21.24% | $4,464 | $7,636 | +71.06% | $2,058 | $3,653 | +77.50% | $3,983 | -8.29% |
| Operating Loss | $(8,194) | $(5,954) | +27.34% | $(2,169) | $(5,725) | -163.95% | $(852) | $(2,690) | -215.73% | $(3,035) | +11.37% |
| Operating Margin (%) | -93.00% | -77.18% | +1582 bps | -54.40% | -155.87% | -10147 bps | -41.89% | -149.94% | -10805 bps | -161.52% | +1158 bps |
| Net Interest Expense | $(234) | $(268) | +14.53% | $(139) | $(106) | -23.74% | $(73) | $(52) | -28.77% | $(54) | -3.70% |
| Debt / Payable Extinguishment | $(671) | $(391) | -41.73% | $(391) | $507 | -229.67% | $0 | $8 | N/A | $499 | -98.40% |
| Fair Value Adjustments (ASC 825) | $(6,104) | $5,468 | -189.58% | $(1,344) | $1,657 | -223.29% | $(2,860) | $10 | -100.35% | $1,647 | -99.39% |
| Other Income / (Expense), Net | $(148) | $220 | -248.65% | $4 | $(50) | -1350.0% | $(1) | $(125) | +12400% | $75 | -266.67% |
| Tax Provision & Investee Equity | $(32) | $(3) | -90.63% | $0 | $(4) | N/A | $0 | $0 | N/A | $(4) | -100.0% |
| GAAP Net Loss | $(15,383) | $(928) | +93.97% | $(4,039) | $(3,721) | +7.87% | $(3,786) | $(2,849) | +24.75% | $(872) | -226.72% |
| Adjusted EBITDA | $(7,097) | $(5,314) | +25.12% | $(1,955) | $(4,780) | -144.50% | $(753) | $(2,282) | -203.05% | $(2,498) | +8.65% |
Stock-based compensation (SBC) expanded 644% YoY in H1 2026 to $878 thousand (from $118 thousand in H1 2025). This was driven by the post-merger issuance of 1,217,210 Restricted Stock Units (RSUs) under the 2025 Omnibus Equity Incentive Plan in January 2026, which added $771 thousand in non-cash compensation ($741 thousand in G&A, $12 thousand in R&D, $10 thousand in S&M, and $8 thousand in Cost of Revenues). Stock option expense accounted for $107 thousand in H1 2026 ($74 thousand in G&A, $16 thousand in R&D, $10 thousand in Cost of Revenues, and $7 thousand in S&M).
Contract durability and client cohort dynamics show structural churn:
* Revenue Depletion via Customer Attrition: In FY2025, Fusemachines suffered 12 complete account cancellations and 16 contract down-scopings, stripping $(2,990) thousand in billings (33.9% gross churn against the FY2024 revenue base). Incremental billings of $1,910 thousand from 11 new logos and 9 expansions failed to offset this deficit, yielding a derived upper-bound Gross Retention Rate (GRR) of ~66.1% and Net Retention Rate (NRR) of ~75.7%.
* Absence of Revenue Cushion: Contract liabilities (deferred revenue) dropped from $54 thousand in FY2024 to $0 as of December 31, 2025, and remained at $0 as of June 30, 2026. Unbilled revenue (contract assets) contracted 85.8% from $113 thousand in FY2024 to $16 thousand as of June 30, 2026. Capitalized sales commissions stood at $20.6 thousand as of June 30, 2026 ($18.0 thousand current, $2.6 thousand non-current), amortized over a 2-year service lifecycle.
* Client Concentration: In FY2025, 3 enterprise customers accounted for 42.2% of total revenue ($3,255 thousand), with 3 customers accounting for 47.6% of accounts receivable ($602 thousand). In H1 2026, 3 clients represented 36.3% of revenue ($1,333 thousand) and 45.5% of accounts receivable ($516 thousand).
* Contractual Asymmetry: Customer Master Services Agreements (MSAs) are capped at terms of up to one year, contain no automatic renewal mechanisms, and allow clients to terminate for convenience on 60 to 90 days' notice. Under the ASC 606 practical expedient, the company reports $0 in Remaining Performance Obligations (RPO).
Infrastructure Layout, Offshore Labor Arbitrage, and Balance Sheet Liabilities
Fusemachines maintains an operating layout coupling commercial headquarters in New York, United States of America, with offshore software delivery infrastructure centered in Kathmandu, Nepal.
Table Global Operating Footprint: Delivery Architecture, Headcount & Geographic Cost Arbitrage
| Operating Dimension | Commercial Layer: United States | Primary Offshore Hub: Kathmandu, Nepal | Nearshore Support: Dominican Republic & Canada |
| Operating Entity | Fusemachines USA, Inc. | Fusemachines Nepal Private Ltd. | Fusemachines Inc. Dominican Republic / Fusemachines Canada Inc. |
| Headcount Distribution | 8 Delivery Engineers; 11 G&A Staff; 35 Billable Consultants | 270 Full-Time Delivery Personnel (Contracted from 327 in FY2024) | Distributed regional personnel; training facilities |
| Average Cash Pay / Head | Delivery: $130,000; Consultant: $48,000; S&M: $131,000 | Offshore local wage base (Nepalese Rupee denominated) | Low-cost local currency payroll structures |
| Revenue Billing vs. Labor | 95.18% (FY25) / 95.97% (H1 26) of Revenue Sourced | Executing >90% of Global Customer Deliverables | Under 1.0% of Global Technical Workload |
| Long-Lived Assets (PP&E) | $264k (FY2025) / $296k (H1 2026) | $247k (FY2025) / $200k (H1 2026) | $0 carrying value disclosed |
Physical infrastructure concentration in Kathmandu exposes the company to operational disruptions. Nationwide political protests, strikes, and work stoppages initiated on September 8, 2025, disrupted transportation, public utilities, and municipal services across central Kathmandu. Furthermore, Fusemachines Nepal Private Ltd. is undergoing an active tax examination by local Nepal authorities covering the 2023–2024 fiscal year regarding cross-border transfer pricing.
Delivery margins are further constrained by local capital encumbrances. The Kathmandu delivery center is owned via intermediate entity Fusemachines Nepal Inc., but is encumbered by Business Oxygen Private Limited (BO2). In July 2021, BO2 invested $964.2 thousand for 39,750 ordinary shares and 1,110,250 cumulative redeemable preference shares. Recognized as an ASC 480 liability of $1,050 thousand as of June 30, 2026, the instrument carries a 10.0% dividend, accretes at an effective interest rate of 13.7%, and includes a mandatory cash redemption put in 2026/2027 at 200% of purchase price ($1.49 million contractual cash obligation).
Labor productivity metrics reflect an offshore IT staffing agency model rather than a software platform:
* Revenue per Billable Employee was $26,301 in FY2024 (335 base), $27,748 in FY2025 (278 base), and $26,424 annualized in H1 2026.
* Revenue per Total Billable Head (including third-party contractors) was $23,434 in FY2024 (376 base) and $24,645 in FY2025 (313 base).
* Gross Profit per Billable Head was $12,859 in FY2024 and $13,760 in FY2025.
* Wage Inflation: Gross margin contracted 553 bps YoY in H1 2026 to 52.03% because Cost of Revenues expanded 4.14% YoY to $1,762 thousand despite falling revenue. Management attributed this cost growth to statutory and performance-based salary increments in Nepal. Contracts contain no Cost-of-Living Adjustment (COLA) provisions or wage pass-through clauses, forcing Fusemachines to absorb higher labor costs directly.
* Software Development Capitalization: Software capitalization is governed under ASC 350-40 and ASC 985-20. Additions totaled $144 thousand in FY2024 (16.44% capitalization rate against $732 thousand R&D), $112 thousand in FY2025 (13.46% against $720 thousand R&D), $54 thousand in H1 2025 (14.29% against $324 thousand R&D), and $88 thousand in H1 2026 (12.98% against $590 thousand R&D). Net capitalized software on the balance sheet was $226 thousand as of June 30, 2026 (amortized over 3 years, with $93.4 thousand amortized in FY2025 and $67 thousand in H1 2026 into G&A).
* Intellectual Property Deficits: Fusemachines holds 0 granted corporate patents and 8 pending applications, having never conducted an independent Freedom to Operate (FTO) search. By contrast, Founder Dr. Sameer Maskey holds 15 patents and applications in his personal name. Standard enterprise MSAs require Fusemachines to indemnify clients against third-party IP infringement without cap, creating unreserved legal exposure.
Working Capital Velocity, Capital Structure, and Governance Realignment
The corporate balance sheet reflects severe working capital deficits and debt pressure following the October 22, 2025 reverse recapitalization with CSLM Acquisition Corp.
Table Consolidated Balance Sheets, Liquidity Profile, and Capital Deficiency Analysis
| Balance Sheet Line Item (in $ thousands) | December 31, 2024 | December 31, 2025 | June 30, 2026 (Unaudited) |
| Cash and Cash Equivalents | $500 | $4,221 | $368 |
| Accounts Receivable, Net | $1,427 | $1,264 | $1,134 |
| Total Current Assets | $4,124 | $6,254 | $1,987 |
| Non-Current Assets (PP&E, Software, Leases) | $1,424 | $1,282 | $1,185 |
| Total Assets | $5,548 | $7,536 | $3,172 |
| Accounts Payable (Trade AP) | $6,537 | $5,012 | $5,173 |
| Accrued Expenses & Wages Payable | $3,700 | $4,618 | $4,972 |
| Related Party Loan (Dolma Impact Fund I) | $700 | $300 | $300 |
| Short-Term Debt (D&O Premium Financing) | $0 | $342 | $119 |
| Convertible Notes at Fair Value (Current) | $8,986 | $0 | $0 |
| Meteora Forward Purchase (FPA) Derivative Liability | $0 | $9,692 | $8,084 |
| Total Current Liabilities | $20,306 | $20,049 | $18,737 |
| Mandatorily Redeemable BO2 Shares (ASC 480) | $1,000 | $1,048 | $1,050 |
| Total Liabilities | $29,853 | $22,112 | $20,526 |
| Net Working Capital Deficit | $(16,182) | $(13,795) | $(16,750) |
| Share Subscription Receivable (Escrow) | $0 | $(11,005) | $(11,005) |
| Accumulated Deficit | $(34,217) | $(35,145) | $(38,950) |
| Stockholders' Deficit | $(24,305) | $(14,576) | $(17,354) |
Working capital velocity highlights stretched liabilities. Days Payable Outstanding (DPO) on Cost of Revenues stood at 600.1 days in FY2024, 537.0 days in FY2025, and 531.4 days in H1 2026. Evaluated against Total Cash Operating Costs, DPO measured 111.4 days in H1 2026. Accrued wages payable reached $3,827 thousand as of June 30, 2026, while Trade AP was $5,173 thousand. The company defaulted on installment payments ($52.0 thousand due May/June 2026) for S-4 printing and filing fees, triggering an unaccrued contingent penalty of $555.0 thousand as the vendor rescinded negotiated discounts. Additional unaccrued commitments include $1,116 thousand in undiscounted operating leases ($836 thousand balance sheet PV) and a $450 thousand remaining legal retainer with Dentons US LLP.
To address near-term liquidity depletion, Fusemachines executed emergency bridge financing on August 2, 2026, issuing $2,500 thousand face value Senior Unsecured Convertible Notes for $2,050 thousand net proceeds (18% Original Issue Discount). The notes mature on February 12, 2027, carry an 18% default interest rate, restrict the issuance of senior debt, require 33% of proceeds from any future financing to be directed toward debt service, and block access to the company's $20.0 million Committed Equity Facility (CEF) with Roth Principal Investments.
Table Capital Structure Analysis: Fully Diluted Share Capital, Derivative Overhang & Registration Coverage
| Capital Instrument / Overhang Tranche | Basic / Underlying Shares | Exercise / Conversion Price | Maximum Diluted Registered Shares | Capital Structure & Overhang Implication |
| Basic Common Stock (Oct 2, 2026) | 32,544,711 | N/A | 32,544,711 | Baseline tradeable equity (Par $0.0001) |
| August 2026 OID Convertible Notes | 595,238 | $4.20 | 1,190,476 | 200% share registration coverage; debt retirement |
| August 2026 Warrants | 2,050,000 | $4.20 (Cash Only) | 4,100,000 | 200% share registration coverage; expires Aug 2031 |
| Vendor Settlement Shares (SPA) | 2,138,935 | $0.6103 (VWAP) | 2,138,935 | Settled $1,305.4k accrued vendor debt on Sept 10, 2026 |
| Retail Volts Marketing Shares | 120,000 | Market Issuance | 120,000 | Marketing services issued Sept 21, 2026 |
| Public Warrants (NASDAQ: FUSEW) | 9,487,500 | $11.50 | 9,487,500 | Callable at $18.00 (cash) or $10.00 (cashless table) |
| Private Placement Sponsor Warrants | 3,971,250 | $11.50 | 3,971,250 | Consilium Sponsor held; permits cashless exercise |
| Meteora Shortfall Warrants | 2,108,070 | Floating ($0.85 Floor) | 2,108,070 | Reset from $12 to $10, then to floating reset / $0.85 floor |
| 2023 Loan Agreement Warrants | 92,211 | $0.70 | 92,211 | ASC 480 liability; $72k balance sheet carrying value |
| Noteholder Conversion Warrants | 30,000 | $11.50 | 30,000 | Equity-classified; 4 notes x 7,500 warrants |
| Outstanding Stock Options | 589,192 | $3.16 (VWAP) | 589,192 | 472,991 vested options ($2.86 VWAP) |
| Outstanding Restricted Stock Units | 1,785,155 | $0.00 (Full-Value) | 1,785,155 | 1,217,210 granted Jan 2026 + subsequent grants |
| Reserved for Future Equity Grants | 1,164,371 | N/A | 1,164,371 | Remaining pool under 3.50M share Omnibus Plan |
| Qintess Earnout Commitment | 500,000 | Milestones | 500,000 | Commercial alliance: 250k at $4.5M spend, 250k at $6.5M |
| Fully Diluted Equity Capitalization | 51,487,698 | — | 54,485,389 | Potential Share Expansion: +58.21% to +67.42% |
Governance is characterized by insider concentration and executive turnover. Founder and CEO Dr. Sameer Maskey controls 18.33% of basic common stock (6,010,280 shares, including family trusts and 237,500 options), while the SPAC Sponsor Consilium Entities control 33.81% (11,944,765 shares). Institutional partner Meteora Capital holds 9.99% (contractually capped; 12.90% uncapped), and venture investor Dolma Impact Fund I holds 8.23% (2,677,293 shares). Four insider blocks control over 70% of total voting power.
Capital recycling transactions among insiders include:
* Founder Liquidity: In January 2024, the company bought back 667,000 shares from Dr. Maskey for $2,902.7 thousand ($2,000.0 thousand cash funded directly by Consilium Note A, and $902.7 thousand applied to extinguish a personal promissory note owed to the company). Dr. Maskey pledged 3,600,000 personal shares to secure Note A.
* CEO Promissory Notes: Dr. Maskey advanced $700.0 thousand via seven personal notes at 4.71% interest during 2024, which the company repaid in cash ($745.0 thousand) upon merger closing on October 22, 2025.
* Creditor Conflicts: Director Tim Gocher is CEO of Dolma Impact Fund I, which holds a $300.0 thousand related-party note that is past due and payable on demand. Gocher sits on no board committees.
* Separation Agreements: Former Director Sanjay Shrestha resigned on May 31, 2026; his firm (Shrestha Global EPG Advisory LLC) was retained 58 days later, receiving 247,158 registered common shares on September 10, 2026, to settle $150.0 thousand in advisory fees.
* Fractional CFO: Christine Chambers resigned as CFO on August 31, 2026. The company outsourced Principal Financial and Accounting Officer roles to David R. Wells via Atlas Bookkeeping, LLC on a month-to-month agreement ($14,500/month cash plus 10,000 RSUs/month, terminable on 30 days' notice).
* Accounting Controls: Independent auditor KNAV CPA LLP issued a Going Concern explanatory paragraph. Management reported material weaknesses in internal controls over financial reporting, citing reliance on basic QuickBooks software, insufficient finance personnel, and control deficiencies that led to improper revenue recognition.
HDIN Institutional Verdict
Fusemachines Inc. operates with an inverted risk-reward structure. Management's public positioning emphasizes scalable enterprise agentic AI software, but the company's financial model reflects a sub-scale IT engineering staffing contractor experiencing top-line contraction and margin erosion. The business model generates gross margins of 52.0% to 55.8%, holds zero multi-year contracted backlog, and maintains $0 in deferred revenue, relying on billable Forward Deployed Engineers deployed on short-term contracts.
The company's cost structure is disconnected from its commercial profile. Corporate G&A surged 78.65% YoY in H1 2026 to $6,251 thousand, driven by public company overhead, legal retainers, and executive RSU vestings. With an operating cash burn of $585.2 thousand per month and net cash burn of $642.2 thousand per month against an unrestricted cash balance of $368 thousand as of June 30, 2026, internal cash generation was exhausted by mid-2026.
Table FUSEMACHINES CRITICAL EVENT TIMELINE
| Milestone Date | Operational / Capital Market Event | Balance Sheet & Default Mechanism |
| October 6, 2026 | Form S-1 Resale Registration Filed | Registers 7,549,411 Resale Shares |
| October 22, 2026 | 1-Year Bylaws Lock-Up Expiration | 21,800,837 Insider Shares Unlocked |
| November 3, 2026 | Nasdaq Hearings Panel Review | Delisting Triggers Immediate Default |
| January 20, 2027 | Nasdaq MVPHS Compliance Deadline | $15.0M Market Value of Publicly Held Shares (MVPHS) Threshold |
| February 12, 2027 | August 2026 Bridge Notes Maturity | $2,500,000 Cash Principal Due |
| March 17, 2027 | Nasdaq Minimum Bid Price Deadline | $1.00 Minimum Bid Price Compliance Window |
| Mid-2027 | BO2 Nepal Subsidiary Cash Put Due | $1,490,000 Mandatory Put Redemption (ASC 480) |
The August 2, 2026 bridge financing ($2.05 million net proceeds) extended liquidity into the fourth quarter of 2026, but created severe structural constraints:
* Restrictive Covenants: The bridge notes carry an 18% default interest rate, sweep 33% of future financings, and restrict the drawdown of the $20.0 million Roth Committed Equity Facility.
* Lock-Up Supply Influx: The expiration of the Section 7.14 Bylaws lock-up on October 22, 2026, releases 21,800,837 shares held by the SPAC Sponsor, Founder, and early venture backers, expanding the tradeable float threefold.
* Delisting Acceleration: The November 3, 2026 Nasdaq Hearings Panel review regarding the $50.0 million Market Value of Listed Securities deficiency represents an immediate operational risk. A delisting determination constitutes a default under the August 2026 Notes, which would accelerate repayment of the $2.50 million principal.
Without substantial new equity capital, debt restructuring, and a stabilization of its commercial customer base, Fusemachines faces an acute solvency cliff heading into early 2027.
Presentation Download & Video Access
- Presentation Download: Click the PDF download link under 'Related Topics' to access the full institutional presentation of this report.
- Video Link: Click this link to watch the HDIN analyst briefing on YouTube.
About HDIN Research
HDIN Research is a premier global market intelligence and strategic advisory firm specializing in institutional-grade financial analysis, supply chain audits, and macroeconomic forecasting. Our dedicated sector analysts deliver actionable, data-driven insights tailored for private equity, hedge funds, and corporate strategy teams. Visit us at http://www.hdinresearch.com.
2026 AI Transparency Footer
"This intelligence report was authored by HDIN Research analysts following a rigorous audit of official corporate filings. AI was utilized for massive-scale data synthesis and structural drafting, ensuring 100% inclusion of reported data points. All strategic insights, financial modeling, and final verdicts were verified by our editorial board to ensure professional accuracy and compliance with 2026 Google Search E-E-A-T standards."