Costco Wholesale Corporation: Working Capital Float and Real Estate Moats Drive Record Cash Flow Amid Tariff Litigation
Date : 2026-10-13
Reading : 234
HDIN Executive Takeaways
1. Costco Wholesale Corporation [NASDAQ: COST] crossed $300 billion in revenue in FY2026 ($303,154 million, +10.1% YoY), generating $15,817 million in operating cash flow powered by a negative net operating working capital model (-$16,423 million) where accounts payable covered 116.91% of inventories.
2. Balance sheet liquidity expanded to $21,301 million in cash and short-term investments, supporting a 16.5% capex acceleration to $7,500 million in FY2027 to deploy up to 33 warehouses across North America, Europe, and Asia-Pacific while maintaining a 94.89% physical building ownership moat.
3. Institutional risk centers on geographic concentration—with California driving 26% of U.S. net sales—and contingent legal exposures, highlighted by the denied motion to dismiss in the *Gower* consumer class action seeking clawbacks of $339 million in realized IEEPA tariff refunds.
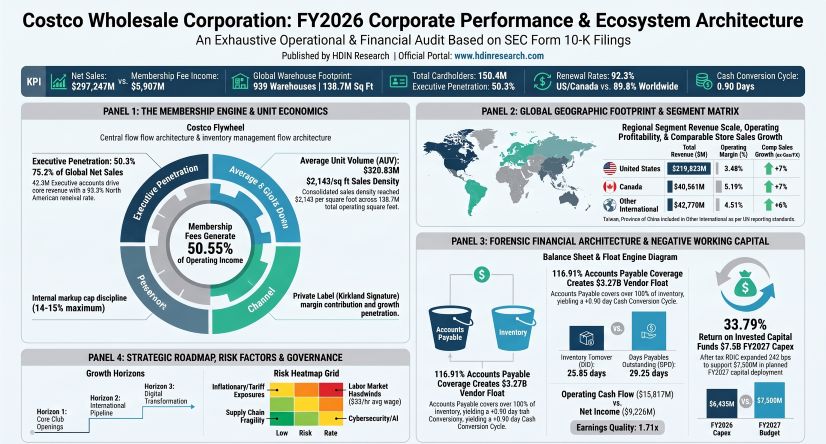
Figure Costco Wholesale Corporation FY2026 Corporate Performance & Ecosystem Architecture
 Segmental Realities, DuPont Deconstruction, and Float Mechanics
Costco Wholesale Corporation's FY2026 financial performance demonstrates the decoupling of retail merchandise gross margins from corporate operating income. Of the company's $11,685 million in consolidated operating income (EBIT), 50.55% ($5,907 million) was derived directly from membership subscription fees, allowing retail merchandise operations to function at a lean 1.94% operating margin on net sales.
Table Multi-Year Consolidated Financial Performance, Cash Flow Generation, and Capital Structure Analysis
Topline sales expansion was driven by an 8% comparable club sales increase (5% ticket expansion, 3% shopping frequency increase) alongside volume from 25 net new warehouses opened. A 12% increase in average retail gasoline prices added $3,501 million (130 bps) to net sales, while gallon volume rose 7% ($1,913 million), mathematically diluting headline gross margin by 13 basis points. Excluding fuel inflation, gross margin expanded 10 basis points to 11.22%, supported by a 15 basis point gross margin expansion in core categories on their own sales, absorbing a $206 million pre-tax LIFO charge and benefiting from $174 million in realized IEEPA tariff refunds credited to merchandise costs.
A forensic five-factor DuPont deconstruction confirms that Return on Equity (ROE) compression from 31.19% in FY2024 and 27.77% in FY2025 to 25.77% in FY2026 (28.40% on average equity) stems entirely from balance sheet deleveraging rather than operational decay:
* Tax Burden (Net Income / EBT): 0.7531 in FY2026 vs. 0.7487 in FY2025 and 0.7564 in FY2024, reflecting an effective tax rate of 24.7% (lowered by 110 bps of R&D tax credits and 80 bps of other credits).
* Interest Burden (EBT / EBIT): 1.0484 in FY2026 vs. 1.0419 in FY2025 and 1.0490 in FY2024. Ratios exceeding 1.00 confirm net interest income accretion, where $601 million in interest income on cash reserves exceeded $145 million in debt interest expense, generating $456 million in net interest income.
* Operating Margin (EBIT / Revenue): 3.85% in FY2026 vs. 3.77% in FY2025 and 3.65% in FY2024, showing persistent operational leverage.
* Asset Turnover (Revenue / Total Assets): 3.405x in FY2026 vs. 3.570x in FY2025 and 3.644x in FY2024. Turnover contracted as cash, cash equivalents, and short-term investments surged to $21,301 million (23.92% of total assets of $89,045 million).
* Financial Leverage (Assets / Equity): Compressed to 2.487x in FY2026 from 2.644x in FY2025 and 2.956x in FY2024. Retained earnings expanded by $5,941 million to $28,591 million, lifting stockholders' equity to $35,803 million without a recurrence of the FY2024 special cash dividend ($15.00 per share, $6,655 million).
Concurrently, operating Return on Invested Capital (ROIC)—defined as Net Operating Profit After Tax ($8,800 million) divided by Net Operating Working Capital (-$16,423 million) plus Net PP&E ($35,633 million), ROU Assets ($2,697 million), and Other Long-Term Assets ($4,133 million) of $26,040 million—expanded by 242 basis points to 33.79% (or 35.65% under the financing approach, up 301 basis points).
The operational foundation rests on negative working capital float dynamics. On average balances, Costco turned inventory in 25.85 days (DSI/DIO) and settled receivables in 4.31 days (DSO), while deferring supplier payables for 29.26 days (DPO), yielding a negative merchandise operating gap (DIO - DPO) of -3.41 days and a cash conversion cycle (CCC) of +0.90 days (+0.25 days on ending balances: DSI 26.69, DSO 4.77, DPO 31.20). Accounts payable reached $22,591 million against merchandise inventories of $19,324 million, resulting in an AP-to-inventory coverage of 116.91% (net negative inventory investment of -$3,267 million).
Beyond vendor financing, Costco held $3,006 million in unearned deferred membership fees and $3,037 million in accrued member rewards (Executive 2% cash rebates), creating a combined $9,310 million zero-cost float. Operating cash flow conversion reached a quality-of-earnings ratio of 1.71x (CFO of $15,817 million / Net Income of $9,226 million), supported by $2,674 million in depreciation and amortization, $924 million in stock-based compensation, and a $2,755 million operating cash inflow from expanded accounts payable.
Membership subscription economics reinforced the flywheel:
* Total Cardholders: 150.4 million across 84.1 million primary paid accounts (+3.8% YoY) and 66.3 million household cards.
* Executive Tier Penetration: Executive members reached 42.3 million accounts (+9.3% YoY), representing 50.30% of total paid members and generating 75.2% of worldwide net sales ($223.5 billion).
* Executive Reward Economics: Total 2% cash rewards distributed reached $3,383 million, averaging $79.98 per Executive member, surpassing the $65 annual upgrade fee.
* Renewal Rates: Maintained at 92.3% in the U.S. and Canada and 89.8% worldwide.
* Fee Realization: Average fee per ending paid member rose to $70.24 ($71.56 on average members). The September 1, 2024 fee increase ($5 standard to $65, $10 Executive to $130) drove 30% of FY2026 MFI growth (~$175 million), with 70% driven by volume and tier upgrades.
Geographic Density, Upstream Manufacturing, and Logistics Infrastructure
Costco closed FY2026 with 939 operating warehouses (138.7 million square feet) and 33.6 million square feet of dedicated cross-dock depots and logistics facilities. Real estate ownership serves as a structural shield against commercial lease rate inflation:
* Land and Building Owned: 755 locations (80.40%).
* Buildings Owned on Ground Leases: 136 locations (14.48%).
* Physical Building Ownership Moat: 891 locations (94.89%).
* Pure Leased Sites (Land and Building): 48 locations (5.11%).
Table Geographic Segment Performance, Store Productivity, and Revenue Density Analysis
International operations generate structural margin arbitrage: combined international segments (Canada and Other International) produced 34.56% of corporate EBIT from 27.49% of total revenue. Canada delivered the highest box-level revenue density across the enterprise at $2,443.43 per square foot and an AUV of $352.70 million, reflecting minimal warehouse club cannibalization and lower operational overhead.
Fleet distribution by country and territory comprises:
* North America (805 units): United States and Puerto Rico (647 across 47 states, DC, and PR), Canada (115), Mexico (43).
* Asia-Pacific (113 units): Japan (37), Republic of Korea (20), Australia (15), Taiwan, Province of China (14), China (Mainland China, 7), New Zealand (1).
* Europe (21 units): United Kingdom (29), Spain (5), France (3), Sweden (2), Iceland (1).
In the Asia-Pacific theater, expansion has been backed by non-recourse local debt: the Japanese subsidiary issued $496 million in Guaranteed Senior Notes across three series maturing between 2031 and 2041 with fixed coupons ranging from 2.620% to 3.680%.
Productivity metrics on a weighted average warehouse base of 926.5 locations demonstrate an average box size of 147,710 square feet:
* Net Sales AUV: $320.83 million ($2,143.09 net sales per square foot).
* Total Revenue AUV: $327.20 million ($2,185.68 revenue per square foot).
* Average Sales per Warehouse (Item 5 Cohort Run-Rate): $292 million, up from $272 million in FY2025 and $260 million in FY2024.
* Mature Cohort Maturation (Opened 2017 & Prior, 741 units): Averaged $306 million in FY2026.
* First-Year Opening Cohorts: FY2026 cohort (25 units) opened at $187 million annualized; FY2025 cohort (24 units) expanded from $192 million in Year 1 to $219 million in Year 2 (+14.06%); FY2024 cohort (29 units) reached $217 million in Year 3 (+27.6% over Year 1).
Box-level capital outlays indicate that developing an owned unit requires $100 million to $125 million in direct capital expenditure, comprising ~$37.7 million in land acquisition ($942 million total gross land additions across 25 net new clubs), ~$81.0 million in building construction and remodels ($2,267 million additions), and ~$61.5 million in fixtures and equipment ($1,723 million additions). Out of $6,435 million total FY2026 capex, remaining capital supported supply chain assets and Construction in Progress, which expanded 44.6% YoY to $2,722 million.
Ancillary ecosystem assets served as customer acquisition funnels:
* Total Ancillary Net Sales: $61,369 million (+20.0% YoY, 20.6% of net sales).
* Gasoline Fleet: 774 stations (82.4% fleet penetration) generating ~$32,697 million (11% of total net sales), averaging $42.24 million in sales per fuel station.
* Specialty Ancillary Units: Fresh Foods generated $41,715 million (+9.8% YoY), supported by meat cutting, scratch bakeries, and service delis; complemented by 150.4 million cardholders utilizing optical labs, pharmacies, hearing centers, and tire installation centers.
* Digital Scale: Digitally-enabled sales rose 21% on a comparable basis, accounting for 11% of net sales (~$32.7 billion across 9 localized e-commerce markets and 4 travel markets), carrying 9,000 to 11,000 online SKUs versus under 4,000 in-warehouse SKUs.
Supply chain operations are directed by Teresa Jones (EVP, COO – Global Depots and Traffic) across 33.6 million square feet of cross-dock distribution depots. Goods bypass intermediary wholesalers, moving via pallet-drop directly to the floor or overhead storage, holding SG&A expenses to 9.15% of net sales despite a $1.00/hour wage scale hike in March 2026 that elevated average U.S. hourly wages to ~$33.00 (supporting a 94% one-year employee retention rate).
To hedge input inflation, private-label Kirkland Signature is positioned as an operational substitute against third-party CPG brands. While exact revenue is not broken out under SEC Regulation S-K boundaries, management confirmed KS represents a growing portion of sales with higher gross margins. Costco operates owned processing, packaging, and manufacturing facilities, internalizing processing wastes, refrigeration, and wastewater treatment under environmental standards. Accounting rules under Note 1 mandate that manufacturing costs, freight, depot logistics, and fresh foods departmental labor/depreciation are charged directly into merchandise costs rather than SG&A.
Management's capital guidance for fiscal 2027 projects approximately $7,500 million in capex (+16.5% YoY), self-funded via cash flows, to open up to 33 warehouses (including 5 relocations, yielding up to 28 net new units), with square footage growth targeted higher in international jurisdictions.
HDIN Institutional Verdict
Costco Wholesale Corporation’s 2026 10-K filing confirms operational superiority across cash flow generation and unit productivity, but reveals latent operational and legal exposures that temper management's narrative:
First, geographic concentration remains an acute operational vulnerability. Costco derives 86% of net sales and 83% of operating income from the U.S. and Canada, with California alone generating 26% of U.S. net sales ($57.15 billion). The company is disproportionately exposed to California-specific regulatory mandates, PAGA labor suits (*Reyes*, *Nader*), electrical grid instability, and seismic events. Outside North America, unit additions were constrained to just two net new warehouses in FY2026, illustrating that metropolitan site scarcity (requiring 15 to 20 contiguous acres), municipal zoning opposition, environmental reviews, and long-term utility electrical interconnections are slowing the rollout into higher-margin overseas territories.
Second, the company's commitment to "pricing authority" faces legal scrutiny following the realization of IEEPA tariff refunds. Having paid approximately $500 million in unlawful tariffs before the Supreme Court's February 2026 invalidation, Costco recovered $184 million ($174 million credited to merchandise costs, $10 million interest) in FY2026, followed by $155 million post-year-end ($339 million total). While Costco deployed a portion of these funds into price reductions, four consumer class actions (*Gower*, *Stockov*, *Ortiz*, *Briggs*) allege that because Costco operates on a cost-plus formula, tariff refunds collected through historic shelf prices must be remitted directly to members. The King County Superior Court's denial of Costco's motion to dismiss in *Gower* on July 17, 2026, introduces legal exposure that challenges management's retention of supplier-level recoveries.
Third, off-balance-sheet commitments and tax attributes present capital demands:
* Uncommenced Leases: Undiscounted commitments for executed leases that have not yet commenced reached $1,667 million, which will transition onto the balance sheet as ASC 842 lease debt as sites open.
* Litigation Deadlines: *Gray v. Costco* (challenging secondary employment restrictions under Washington law) was certified as a class action with trial scheduled for March 1, 2027; *Castillo* web-tracking pixel privacy actions survived motions to dismiss, resulting in active Civil Investigative Demands from the Washington Attorney General and Los Angeles County Counsel.
* Tax Reserve Deterioration: Gross unrecognized tax benefits (UTBs) expanded by 44.6% YoY to $94 million, while deferred tax asset valuation allowances rose to $641 million, primarily reflecting unutilized foreign tax credits that begin expiring in fiscal 2030. Self-insurance accruals across health, workers' compensation, and general liability reached $2,157 million.
* Short-Term Debt Maturities: Current debt surged to $2,248 million as the 3.000% ($1,000 million) and 1.375% ($1,250 million) Senior Notes mature in May and June 2027, requiring liquidity deployment to retire low-cost coupons.
Costco's subscription model, negative working capital float, and real estate ownership continue to yield sector-leading resilience. However, institutional capital allocation must monitor the margin trade-off between self-funded capital expenditures ($7,500 million in FY2027) and mounting legal, labor, and municipal utility constraints gating box-level deployment.
Presentation Download & Video Access
Presentation Download: Click the PDF download link under 'Related Topics' to access the full institutional presentation of this report.
Video Link: Click this link to watch the HDIN analyst briefing on YouTube.
About HDIN Research
HDIN Research is a premier global market intelligence and strategic advisory firm specializing in institutional-grade financial analysis, supply chain audits, and macroeconomic forecasting. Our dedicated sector analysts deliver actionable, data-driven insights tailored for private equity, hedge funds, and corporate strategy teams. Visit us at http://www.hdinresearch.com.
2026 AI Transparency Footer
"This intelligence report was authored by HDIN Research analysts following a rigorous audit of official corporate filings. AI was utilized for massive-scale data synthesis and structural drafting, ensuring 100% inclusion of reported data points. All strategic insights, financial modeling, and final verdicts were verified by our editorial board to ensure professional accuracy and compliance with 2026 Google Search E-E-A-T standards."
1. Costco Wholesale Corporation [NASDAQ: COST] crossed $300 billion in revenue in FY2026 ($303,154 million, +10.1% YoY), generating $15,817 million in operating cash flow powered by a negative net operating working capital model (-$16,423 million) where accounts payable covered 116.91% of inventories.
2. Balance sheet liquidity expanded to $21,301 million in cash and short-term investments, supporting a 16.5% capex acceleration to $7,500 million in FY2027 to deploy up to 33 warehouses across North America, Europe, and Asia-Pacific while maintaining a 94.89% physical building ownership moat.
3. Institutional risk centers on geographic concentration—with California driving 26% of U.S. net sales—and contingent legal exposures, highlighted by the denied motion to dismiss in the *Gower* consumer class action seeking clawbacks of $339 million in realized IEEPA tariff refunds.
Figure Costco Wholesale Corporation FY2026 Corporate Performance & Ecosystem Architecture
Segmental Realities, DuPont Deconstruction, and Float MechanicsCostco Wholesale Corporation's FY2026 financial performance demonstrates the decoupling of retail merchandise gross margins from corporate operating income. Of the company's $11,685 million in consolidated operating income (EBIT), 50.55% ($5,907 million) was derived directly from membership subscription fees, allowing retail merchandise operations to function at a lean 1.94% operating margin on net sales.
Table Multi-Year Consolidated Financial Performance, Cash Flow Generation, and Capital Structure Analysis
| Metric / Financial Parameter | FY2026 (52 Wks) | FY2025 (52 Wks) | FY2024 (52 Wks) | YoY Variance |
| Net Sales ($M) | $297,247 | $269,912 | $249,625 | +10.1% (+$27,335M) |
| Membership Fees ($M) | $5,907 | $5,323 | $4,828 | +11.0% (+$584M) |
| Total Revenue ($M) | $303,154 | $275,235 | $254,453 | +10.1% (+$27,919M) |
| Merchandise Costs ($M) | $264,279 | $239,886 | $222,358 | +10.2% |
| Gross Margin ($M) | $32,968 | $30,026 | $27,267 | +9.8% |
| Gross Margin % (Headline) | 11.09% | 11.12% | 10.92% | -3 bps |
| Gross Margin % (ex-Gasoline Inflation) | 11.22% | 11.12% | — | +10 bps |
| SG&A Expenses ($M) | $27,190 | $24,966 | $22,810 | +8.9% |
| SG&A % of Net Sales | 9.15% | 9.25% | 9.14% | -10 bps (Leverage) |
| SG&A % (ex-Gasoline Inflation) | 9.26% | 9.25% | — | +1 bp |
| Operating Income (EBIT, $M) | $11,685 | $10,383 | $9,285 | +12.5% (+$1,302M) |
| EBIT Margin (% of Net Sales) | 3.93% | 3.85% | 3.72% | +8 bps |
| Net Income ($M) | $9,226 | $8,099 | $7,367 | +13.9% (+$1,127M) |
| Diluted Earnings Per Share ($) | $20.76 | $18.21 | $16.56 | +14.0% |
| Operating Cash Flow (CFO, $M) | $15,817 | $13,335 | $11,339 | +18.6% (+$2,482M) |
| Capital Expenditures ($M) | $6,435 | $5,498 | $4,710 | +17.0% |
| Free Cash Flow (FCF, $M) | $9,382 | $7,837 | $6,629 | +19.7% |
| Cash, Cash Eq. & ST Investments ($M) | $21,301 | $15,284 | $9,906 | +39.4% (+$6,017M) |
| Total Carrying Debt ($M) | $6,162 | $5,788 | — | +6.5% |
| ASC 842 Total Lease Liabilities ($M) | $4,019 | $4,147 | — | -3.1% |
| Net Cash Position (Funded Debt, $M) | $15,139 | $9,496 | — | +$5,643M |
| Net Cash Position (Lease-Adjusted, $M) | $11,120 | $5,349 | — | +$5,771M |
| Net Debt / EBITDA | -1.05x | -0.74x | — | -0.31x (Net Cash) |
| Lease-Adjusted Net Debt / EBITDA | -0.77x | — | — | Net Cash |
| EBIT Interest Coverage | 80.59x | 67.42x | 54.94x | +1,317 bps |
Topline sales expansion was driven by an 8% comparable club sales increase (5% ticket expansion, 3% shopping frequency increase) alongside volume from 25 net new warehouses opened. A 12% increase in average retail gasoline prices added $3,501 million (130 bps) to net sales, while gallon volume rose 7% ($1,913 million), mathematically diluting headline gross margin by 13 basis points. Excluding fuel inflation, gross margin expanded 10 basis points to 11.22%, supported by a 15 basis point gross margin expansion in core categories on their own sales, absorbing a $206 million pre-tax LIFO charge and benefiting from $174 million in realized IEEPA tariff refunds credited to merchandise costs.
A forensic five-factor DuPont deconstruction confirms that Return on Equity (ROE) compression from 31.19% in FY2024 and 27.77% in FY2025 to 25.77% in FY2026 (28.40% on average equity) stems entirely from balance sheet deleveraging rather than operational decay:
* Tax Burden (Net Income / EBT): 0.7531 in FY2026 vs. 0.7487 in FY2025 and 0.7564 in FY2024, reflecting an effective tax rate of 24.7% (lowered by 110 bps of R&D tax credits and 80 bps of other credits).
* Interest Burden (EBT / EBIT): 1.0484 in FY2026 vs. 1.0419 in FY2025 and 1.0490 in FY2024. Ratios exceeding 1.00 confirm net interest income accretion, where $601 million in interest income on cash reserves exceeded $145 million in debt interest expense, generating $456 million in net interest income.
* Operating Margin (EBIT / Revenue): 3.85% in FY2026 vs. 3.77% in FY2025 and 3.65% in FY2024, showing persistent operational leverage.
* Asset Turnover (Revenue / Total Assets): 3.405x in FY2026 vs. 3.570x in FY2025 and 3.644x in FY2024. Turnover contracted as cash, cash equivalents, and short-term investments surged to $21,301 million (23.92% of total assets of $89,045 million).
* Financial Leverage (Assets / Equity): Compressed to 2.487x in FY2026 from 2.644x in FY2025 and 2.956x in FY2024. Retained earnings expanded by $5,941 million to $28,591 million, lifting stockholders' equity to $35,803 million without a recurrence of the FY2024 special cash dividend ($15.00 per share, $6,655 million).
Concurrently, operating Return on Invested Capital (ROIC)—defined as Net Operating Profit After Tax ($8,800 million) divided by Net Operating Working Capital (-$16,423 million) plus Net PP&E ($35,633 million), ROU Assets ($2,697 million), and Other Long-Term Assets ($4,133 million) of $26,040 million—expanded by 242 basis points to 33.79% (or 35.65% under the financing approach, up 301 basis points).
The operational foundation rests on negative working capital float dynamics. On average balances, Costco turned inventory in 25.85 days (DSI/DIO) and settled receivables in 4.31 days (DSO), while deferring supplier payables for 29.26 days (DPO), yielding a negative merchandise operating gap (DIO - DPO) of -3.41 days and a cash conversion cycle (CCC) of +0.90 days (+0.25 days on ending balances: DSI 26.69, DSO 4.77, DPO 31.20). Accounts payable reached $22,591 million against merchandise inventories of $19,324 million, resulting in an AP-to-inventory coverage of 116.91% (net negative inventory investment of -$3,267 million).
Beyond vendor financing, Costco held $3,006 million in unearned deferred membership fees and $3,037 million in accrued member rewards (Executive 2% cash rebates), creating a combined $9,310 million zero-cost float. Operating cash flow conversion reached a quality-of-earnings ratio of 1.71x (CFO of $15,817 million / Net Income of $9,226 million), supported by $2,674 million in depreciation and amortization, $924 million in stock-based compensation, and a $2,755 million operating cash inflow from expanded accounts payable.
Membership subscription economics reinforced the flywheel:
* Total Cardholders: 150.4 million across 84.1 million primary paid accounts (+3.8% YoY) and 66.3 million household cards.
* Executive Tier Penetration: Executive members reached 42.3 million accounts (+9.3% YoY), representing 50.30% of total paid members and generating 75.2% of worldwide net sales ($223.5 billion).
* Executive Reward Economics: Total 2% cash rewards distributed reached $3,383 million, averaging $79.98 per Executive member, surpassing the $65 annual upgrade fee.
* Renewal Rates: Maintained at 92.3% in the U.S. and Canada and 89.8% worldwide.
* Fee Realization: Average fee per ending paid member rose to $70.24 ($71.56 on average members). The September 1, 2024 fee increase ($5 standard to $65, $10 Executive to $130) drove 30% of FY2026 MFI growth (~$175 million), with 70% driven by volume and tier upgrades.
Geographic Density, Upstream Manufacturing, and Logistics Infrastructure
Costco closed FY2026 with 939 operating warehouses (138.7 million square feet) and 33.6 million square feet of dedicated cross-dock depots and logistics facilities. Real estate ownership serves as a structural shield against commercial lease rate inflation:
* Land and Building Owned: 755 locations (80.40%).
* Buildings Owned on Ground Leases: 136 locations (14.48%).
* Physical Building Ownership Moat: 891 locations (94.89%).
* Pure Leased Sites (Land and Building): 48 locations (5.11%).
Table Geographic Segment Performance, Store Productivity, and Revenue Density Analysis
| Metric / Operating Dimension | United States | Canada | Other International | Consolidated Total |
| Total Revenue ($M) | $219,823 | $40,561 | $42,770 | $303,154 |
| Segment Revenue Share (%) | 72.51% | 13.38% | 14.11% | 100.00% |
| Operating Income (EBIT, $M) | $7,647 | $2,107 | $1,931 | $11,685 |
| Operating Margin (%) | 3.48% | 5.19% | 4.51% | 3.85% |
| EBIT Contribution (%) | 65.44% | 18.03% | 16.53% | 100.00% |
| Warehouse Count | 647 | 115 | 177 | 939 |
| Segment Floor Space (M sq ft) | 96.6 | 16.6 | 25.5 | 138.7 |
| Average AUV ($M Revenue) | $339.76 | $352.70 | $241.64 | $322.85 |
| Revenue Density ($/sq ft) | $2,275.60 | $2,443.43 | $1,677.25 | $2,185.68 |
International operations generate structural margin arbitrage: combined international segments (Canada and Other International) produced 34.56% of corporate EBIT from 27.49% of total revenue. Canada delivered the highest box-level revenue density across the enterprise at $2,443.43 per square foot and an AUV of $352.70 million, reflecting minimal warehouse club cannibalization and lower operational overhead.
Fleet distribution by country and territory comprises:
* North America (805 units): United States and Puerto Rico (647 across 47 states, DC, and PR), Canada (115), Mexico (43).
* Asia-Pacific (113 units): Japan (37), Republic of Korea (20), Australia (15), Taiwan, Province of China (14), China (Mainland China, 7), New Zealand (1).
* Europe (21 units): United Kingdom (29), Spain (5), France (3), Sweden (2), Iceland (1).
In the Asia-Pacific theater, expansion has been backed by non-recourse local debt: the Japanese subsidiary issued $496 million in Guaranteed Senior Notes across three series maturing between 2031 and 2041 with fixed coupons ranging from 2.620% to 3.680%.
Productivity metrics on a weighted average warehouse base of 926.5 locations demonstrate an average box size of 147,710 square feet:
* Net Sales AUV: $320.83 million ($2,143.09 net sales per square foot).
* Total Revenue AUV: $327.20 million ($2,185.68 revenue per square foot).
* Average Sales per Warehouse (Item 5 Cohort Run-Rate): $292 million, up from $272 million in FY2025 and $260 million in FY2024.
* Mature Cohort Maturation (Opened 2017 & Prior, 741 units): Averaged $306 million in FY2026.
* First-Year Opening Cohorts: FY2026 cohort (25 units) opened at $187 million annualized; FY2025 cohort (24 units) expanded from $192 million in Year 1 to $219 million in Year 2 (+14.06%); FY2024 cohort (29 units) reached $217 million in Year 3 (+27.6% over Year 1).
Box-level capital outlays indicate that developing an owned unit requires $100 million to $125 million in direct capital expenditure, comprising ~$37.7 million in land acquisition ($942 million total gross land additions across 25 net new clubs), ~$81.0 million in building construction and remodels ($2,267 million additions), and ~$61.5 million in fixtures and equipment ($1,723 million additions). Out of $6,435 million total FY2026 capex, remaining capital supported supply chain assets and Construction in Progress, which expanded 44.6% YoY to $2,722 million.
Ancillary ecosystem assets served as customer acquisition funnels:
* Total Ancillary Net Sales: $61,369 million (+20.0% YoY, 20.6% of net sales).
* Gasoline Fleet: 774 stations (82.4% fleet penetration) generating ~$32,697 million (11% of total net sales), averaging $42.24 million in sales per fuel station.
* Specialty Ancillary Units: Fresh Foods generated $41,715 million (+9.8% YoY), supported by meat cutting, scratch bakeries, and service delis; complemented by 150.4 million cardholders utilizing optical labs, pharmacies, hearing centers, and tire installation centers.
* Digital Scale: Digitally-enabled sales rose 21% on a comparable basis, accounting for 11% of net sales (~$32.7 billion across 9 localized e-commerce markets and 4 travel markets), carrying 9,000 to 11,000 online SKUs versus under 4,000 in-warehouse SKUs.
Supply chain operations are directed by Teresa Jones (EVP, COO – Global Depots and Traffic) across 33.6 million square feet of cross-dock distribution depots. Goods bypass intermediary wholesalers, moving via pallet-drop directly to the floor or overhead storage, holding SG&A expenses to 9.15% of net sales despite a $1.00/hour wage scale hike in March 2026 that elevated average U.S. hourly wages to ~$33.00 (supporting a 94% one-year employee retention rate).
To hedge input inflation, private-label Kirkland Signature is positioned as an operational substitute against third-party CPG brands. While exact revenue is not broken out under SEC Regulation S-K boundaries, management confirmed KS represents a growing portion of sales with higher gross margins. Costco operates owned processing, packaging, and manufacturing facilities, internalizing processing wastes, refrigeration, and wastewater treatment under environmental standards. Accounting rules under Note 1 mandate that manufacturing costs, freight, depot logistics, and fresh foods departmental labor/depreciation are charged directly into merchandise costs rather than SG&A.
Management's capital guidance for fiscal 2027 projects approximately $7,500 million in capex (+16.5% YoY), self-funded via cash flows, to open up to 33 warehouses (including 5 relocations, yielding up to 28 net new units), with square footage growth targeted higher in international jurisdictions.
HDIN Institutional Verdict
Costco Wholesale Corporation’s 2026 10-K filing confirms operational superiority across cash flow generation and unit productivity, but reveals latent operational and legal exposures that temper management's narrative:
First, geographic concentration remains an acute operational vulnerability. Costco derives 86% of net sales and 83% of operating income from the U.S. and Canada, with California alone generating 26% of U.S. net sales ($57.15 billion). The company is disproportionately exposed to California-specific regulatory mandates, PAGA labor suits (*Reyes*, *Nader*), electrical grid instability, and seismic events. Outside North America, unit additions were constrained to just two net new warehouses in FY2026, illustrating that metropolitan site scarcity (requiring 15 to 20 contiguous acres), municipal zoning opposition, environmental reviews, and long-term utility electrical interconnections are slowing the rollout into higher-margin overseas territories.
Second, the company's commitment to "pricing authority" faces legal scrutiny following the realization of IEEPA tariff refunds. Having paid approximately $500 million in unlawful tariffs before the Supreme Court's February 2026 invalidation, Costco recovered $184 million ($174 million credited to merchandise costs, $10 million interest) in FY2026, followed by $155 million post-year-end ($339 million total). While Costco deployed a portion of these funds into price reductions, four consumer class actions (*Gower*, *Stockov*, *Ortiz*, *Briggs*) allege that because Costco operates on a cost-plus formula, tariff refunds collected through historic shelf prices must be remitted directly to members. The King County Superior Court's denial of Costco's motion to dismiss in *Gower* on July 17, 2026, introduces legal exposure that challenges management's retention of supplier-level recoveries.
Third, off-balance-sheet commitments and tax attributes present capital demands:
* Uncommenced Leases: Undiscounted commitments for executed leases that have not yet commenced reached $1,667 million, which will transition onto the balance sheet as ASC 842 lease debt as sites open.
* Litigation Deadlines: *Gray v. Costco* (challenging secondary employment restrictions under Washington law) was certified as a class action with trial scheduled for March 1, 2027; *Castillo* web-tracking pixel privacy actions survived motions to dismiss, resulting in active Civil Investigative Demands from the Washington Attorney General and Los Angeles County Counsel.
* Tax Reserve Deterioration: Gross unrecognized tax benefits (UTBs) expanded by 44.6% YoY to $94 million, while deferred tax asset valuation allowances rose to $641 million, primarily reflecting unutilized foreign tax credits that begin expiring in fiscal 2030. Self-insurance accruals across health, workers' compensation, and general liability reached $2,157 million.
* Short-Term Debt Maturities: Current debt surged to $2,248 million as the 3.000% ($1,000 million) and 1.375% ($1,250 million) Senior Notes mature in May and June 2027, requiring liquidity deployment to retire low-cost coupons.
Costco's subscription model, negative working capital float, and real estate ownership continue to yield sector-leading resilience. However, institutional capital allocation must monitor the margin trade-off between self-funded capital expenditures ($7,500 million in FY2027) and mounting legal, labor, and municipal utility constraints gating box-level deployment.
Presentation Download & Video Access
Presentation Download: Click the PDF download link under 'Related Topics' to access the full institutional presentation of this report.
Video Link: Click this link to watch the HDIN analyst briefing on YouTube.
About HDIN Research
HDIN Research is a premier global market intelligence and strategic advisory firm specializing in institutional-grade financial analysis, supply chain audits, and macroeconomic forecasting. Our dedicated sector analysts deliver actionable, data-driven insights tailored for private equity, hedge funds, and corporate strategy teams. Visit us at http://www.hdinresearch.com.
2026 AI Transparency Footer
"This intelligence report was authored by HDIN Research analysts following a rigorous audit of official corporate filings. AI was utilized for massive-scale data synthesis and structural drafting, ensuring 100% inclusion of reported data points. All strategic insights, financial modeling, and final verdicts were verified by our editorial board to ensure professional accuracy and compliance with 2026 Google Search E-E-A-T standards."