Cyabra, Inc.: Structural Deficits and Dilutive Derivatives Strain Enterprise Disinformation Strategy Near Tel Aviv Operations
Date : 2026-10-14
Reading : 251
HDIN Executive Takeaways
1. Cyabra, Inc. [NASDAQ: CYAB] reported fiscal year 2025 revenue of $5,707 thousand (+37.35% YoY) and H1 2026 revenue of $3,268 thousand, yet exit ARR stagnated flat at $6.1 million throughout FY2024 and FY2025 due to protracted public-sector procurement cycles.
2. The operating cost structure expanded to 294.57% of revenue in FY2025 ($16,811 thousand) and 542.11% in H1 2026 ($17,716 thousand), driving H1 2026 operating margins down to -457.28% and depleting standalone cash to $794 thousand as of June 30, 2026 (~0.95 months of organic runway).
3. The secondary registration covers 21,466,410 common shares (61.72% of basic float) from Selling Shareholders yielding zero primary capital to the company, within a fully diluted capital overhang of 174,236,478 shares (~5.0x basic shares) alongside active auditor going-concern notices from Somekh Chaikin (KPMG International).
Figure Cyabra Form S-1 IPO Diagnostic
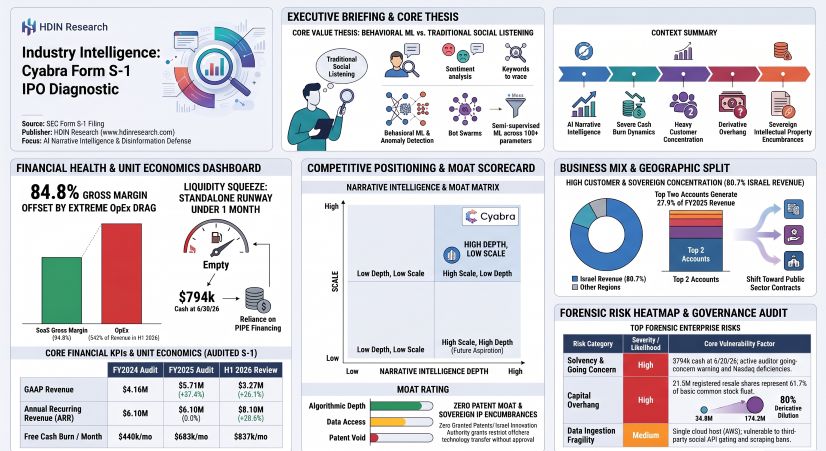 Segmental Realities, Margin Divergence, and Cash Bleed
Cyabra, Inc. operates as a single reportable operating segment under ASC 280, delivering non-generative, semi-supervised machine learning classification platforms to counter digital disinformation, bot networks, and generative artificial intelligence narrative manipulation. While gross margins reflect Tier-1 enterprise software economics—expanding 365 basis points YoY from 81.18% in FY2024 to 84.83% in FY2025 and holding at 84.82% in H1 2026—structural operating overhead has generated widening operating losses of $(11,970) thousand in FY2025 (-209.74% operating margin) and $(14,944) thousand in H1 2026 (-457.28% operating margin).
Table Consolidated Statements of Operations, Operating Leverage, and Cash Burn Profile
Operating cash outflows expanded from $(5,196) thousand in FY2024 to $(8,144) thousand in FY2025 ($683.3 thousand monthly FCF burn) and reached $(4,995) thousand in H1 2026 ($837.2 thousand monthly FCF burn). Standalone cash and cash equivalents stood at $794 thousand as of June 30, 2026, representing approximately 0.95 months (28 days) of organic operational runway. Although a post-period private investment in public equity (PIPE) closed on July 10, 2026, delivering ~$5.3 million in net proceeds ($6.0 million gross at $0.435 per share) to establish a pro forma cash base of ~$6,094 thousand, baseline burn rates absorb this reserve within ~7.28 months.
A stress test assuming a 30% reduction in monthly cash inflows (-$163.4 thousand/month) and a 25% inflation in compute/API ingestion costs (+$23.7 thousand/month) escalates free cash burn to ~$974.3 thousand per month, shortening post-PIPE liquidity runway to ~6.25 months and exhausting capital near year-end 2026. The balance sheet reflects an accumulated deficit of $61,582 thousand and a working capital deficit of $(11,871) thousand as of June 30, 2026.
Stock-based compensation has decoupled from commercial scale, expanding from 37.33% of revenue in FY2024 to 52.99% in FY2025, and surging to 166.46% of revenue in H1 2026 ($5,440 thousand). R&D expense accounting remains conservative with a 0.00% capitalization ratio under ASC 985-20 / ASC 350-40, expensing all internal engineering ($6,894 thousand in FY2025; $7,568 thousand in H1 2026) directly to operations.
Customer concentration is elevated: the top two accounts generated $1,590 thousand, or 27.86% of total consolidated revenue in FY2025 (Customer A at $997 thousand / 17.47%; Customer B at $593 thousand / 10.39%), compared to five accounts comprising 53.48% ($2,222 thousand) in FY2024. In the Form S-1, management explicitly disclaims the tracking or disclosure of Net Retention Rate (NRR), Gross Retention Rate (GRR), Customer Acquisition Cost (CAC), Lifetime Value (LTV), and Logo Churn, citing an early commercialization stage. Cyabra posted a Rule of 40 score of -172.39% in FY2025 (operating margin basis) and -431.15% in H1 2026.
Infrastructure Layout, Geographic Dependencies, and Sovereign Encumbrances
Cyabra operates via a dual-hub operational architecture that bifurcates sovereign defense research and development from North American commercial go-to-market functions:
* Tel Aviv Global Corporate and Engineering HQ: Located at 13 Gershon Shatz, Tel Aviv, Israel (5,500 square feet; lease expiring October 31, 2027, at ~$18 thousand monthly). Houses core algorithmic development, data labeling ("golden dataset" curation), executive leadership, and substantially all long-lived assets. Operations are exposed to regional security escalations and compulsory military reserve obligations under Israeli defense frameworks.
* New York Commercial Hub: Cyabra Strategy Inc. (Delaware operating subsidiary) located at 240W 40th St, New York, NY (2,546 square feet; lease expiring April 30, 2027, at ~$11 thousand monthly). Manages direct enterprise sales, channel distribution, and public-sector account management across North America.
* Global Cloud and Ingestion Pipeline: Cyabra operates zero physical data centers, maintaining its production platform entirely on Amazon Web Services, Inc. [NASDAQ: AMZN] without minimum long-term purchase obligations or take-or-pay GPU commitments. System continuity requires uninterrupted automated ingestion and scraping via public APIs across X (formerly Twitter), Meta Platforms, Inc. [NASDAQ: META] (Facebook and Instagram), LinkedIn, and syndication feeds, creating exposure to API rate gating, IP blocking, anti-scraping CAPTCHAs, and regulatory liabilities under GDPR, the California CPRA, and the amended Israeli Privacy Protection Law (PPL 5741-1981).
* Sovereign Intellectual Property Restrictions: Cyabra maintains zero granted patents and zero pending patent applications, relying on trade secrets and human-labeled datasets. Core R&D is encumbered by the Israel Innovation Authority (IIA), having received $719 thousand in historical grants with an outstanding theoretical balance of ~$527 thousand (including accrued interest) as of December 15, 2025, and an ongoing 3.0% to 3.5% royalty obligation ($171 thousand incurred in FY2025; $144 thousand in FY2024). Under the Israeli Innovation Law, any transfer or exclusive licensing of IIA-funded know-how outside the State of Israel requires discretionary government approval and payment of a statutory Redemption Fee capped at up to 600% of grants received plus accrued interest.
Geographic revenue attribution demonstrates an increasing domestic reliance:
HDIN Institutional Verdict
Management's operational narrative highlights the emergence of a planetary enterprise defense platform against synthetic GenAI disinformation, referencing external industry projections of a $500 billion mitigation market by 2028. However, audited financial realities confirm that Cyabra operates as a sub-scale government contractor and intelligence boutique. Top-line revenue remains heavily concentrated within the State of Israel (80.66% in FY2025), while ARR stalled completely at $6.1 million between FY2024 and FY2025 due to administrative procurement delays and contract churn, before reaching $8.1 million as of June 30, 2026. Remaining Performance Obligations (RPO) show that 86.10% of forward contracted revenue as of June 30, 2026 ($4,230 thousand out of $4,913 thousand) is realized within 12 months, indicating a compressed average contract duration of 12 to 14 months rather than multi-year institutional software commitments.
Governance and capital allocation audits unmask extensive derivative overhang and insider-affiliated debt restructurings:
The corporate structure exhibits multiple governance encumbrances and financial liabilities:
* Sponsor Windfall Conversion: Trailblazer Sponsor Group expanded working capital notes to $5,330 thousand prior to the business combination, converting at a 300% multiplier into $15,990 thousand of stated value ($5,330 thousand Series B and $10,660 thousand Series C Preferred Stock).
* Institutional Creditor Dilution: In September 2026, Alpha Capital Anstalt exchanged its $10.66 million Series C Preferred Stock for 24,505,747 Pre-Funded Warrants ($0.0001 strike), 24,505,747 Series A Warrants ($0.50 strike), and 24,505,747 Series B Warrants ($0.45 strike), securing 73,517,241 underlying derivative shares. Alpha also previously held debt carrying 50% sweeps of all gross revenues and financing receipts.
* Resale Float Overhang: This Form S-1 secondary registration covers 21,466,410 common shares held by Selling Shareholders (Alpha Capital Anstalt and Armistice Capital Master Fund Ltd.), representing 61.72% of total basic common stock. If exercised for cash, basic shares expand from 34,784,611 to 56,251,021 shares, generating an immediate 38.16% dilution to basic equity holders while providing zero capital proceeds to Cyabra if exercised cashlessly.
* Executive Bonuses & Retainers: Co-founders Dan Brahmy, Yossef Daar, and Ido Shraga received $400 thousand transaction cash bonuses each ($1,200 thousand total) upon merger closing plus 400,000 RSUs, and are eligible for 3,000,000 earnout shares at $15.00, $20.00, and $25.00 thresholds. Affiliated Director Josette Sheeran receives a $4,000 monthly retainer, a 10% gross commission on introduced client contracts, and 144,387 stock options via Firefly Global Group.
* Overdue Legal Liabilities: The financial footnotes disclose an overdue transaction legal fee note to Lowenstein Sandler LLP with an unpaid balance of $1,631 thousand as of June 30, 2026, for which the company is jointly and severally liable.
* Regulatory Delisting Proceedings: Cyabra trades well below the $1.00 minimum bid requirement ($0.20 as of October 6, 2026) and faces three active Nasdaq deficiency proceedings: Rule 5450(b)(2)(A) for Market Value of Listed Securities below $50 million (grace period expired November 9, 2026), Rule 5450(b)(2)(C) for Market Value of Publicly Held Shares below $15 million (deadline December 7, 2026), and Rule 5450(a)(1) for minimum bid price (deadline December 7, 2026).
Independent auditor Somekh Chaikin (KPMG International) maintains an active going-concern explanatory paragraph. Because the registered secondary offering provides no primary operating capital, Cyabra remains constrained by an unabsorbed fixed cost structure, high account concentration, and persistent financing requirements to fund its ~$837 thousand monthly cash drain.
Presentation Download & Video Access:
- Presentation Download: Click the PDF download link under 'Related Topics' to access the full institutional presentation of this report.
- Video Link: Click this link to watch the HDIN analyst briefing on YouTube.
About HDIN Research:
HDIN Research is a premier global market intelligence and strategic advisory firm specializing in institutional-grade financial analysis, supply chain audits, and macroeconomic forecasting. Our dedicated sector analysts deliver actionable, data-driven insights tailored for private equity, hedge funds, and corporate strategy teams. Visit us at http://www.hdinresearch.com.
2026 AI Transparency Footer:
"This intelligence report was authored by HDIN Research analysts following a rigorous audit of official corporate filings. AI was utilized for massive-scale data synthesis and structural drafting, ensuring 100% inclusion of reported data points. All strategic insights, financial modeling, and final verdicts were verified by our editorial board to ensure professional accuracy and compliance with 2026 Google Search E-E-A-T standards."
1. Cyabra, Inc. [NASDAQ: CYAB] reported fiscal year 2025 revenue of $5,707 thousand (+37.35% YoY) and H1 2026 revenue of $3,268 thousand, yet exit ARR stagnated flat at $6.1 million throughout FY2024 and FY2025 due to protracted public-sector procurement cycles.
2. The operating cost structure expanded to 294.57% of revenue in FY2025 ($16,811 thousand) and 542.11% in H1 2026 ($17,716 thousand), driving H1 2026 operating margins down to -457.28% and depleting standalone cash to $794 thousand as of June 30, 2026 (~0.95 months of organic runway).
3. The secondary registration covers 21,466,410 common shares (61.72% of basic float) from Selling Shareholders yielding zero primary capital to the company, within a fully diluted capital overhang of 174,236,478 shares (~5.0x basic shares) alongside active auditor going-concern notices from Somekh Chaikin (KPMG International).
Figure Cyabra Form S-1 IPO Diagnostic
Segmental Realities, Margin Divergence, and Cash BleedCyabra, Inc. operates as a single reportable operating segment under ASC 280, delivering non-generative, semi-supervised machine learning classification platforms to counter digital disinformation, bot networks, and generative artificial intelligence narrative manipulation. While gross margins reflect Tier-1 enterprise software economics—expanding 365 basis points YoY from 81.18% in FY2024 to 84.83% in FY2025 and holding at 84.82% in H1 2026—structural operating overhead has generated widening operating losses of $(11,970) thousand in FY2025 (-209.74% operating margin) and $(14,944) thousand in H1 2026 (-457.28% operating margin).
Table Consolidated Statements of Operations, Operating Leverage, and Cash Burn Profile
| Consolidated Metric ($ in thousands, except per share) | FY2024 (Audited) | FY2025 (Audited) | YoY Change (%) / bps | H1 2025 (Unaudited) | H1 2026 (Unaudited) | YoY Change (%) / bps |
| Revenues | $4,155 | $5,707 | +37.35% | $2,591 | $3,268 | +26.13% |
| Cost of Revenues | $782 | $866 | +10.74% | $409 | $496 | +21.27% |
| Gross Profit | $3,373 | $4,841 | +43.52% | $2,182 | $2,772 | +27.04% |
| Gross Margin (%) | 81.18% | 84.83% | +365 bps | 84.21% | 84.82% | +61 bps |
| Research & Development | $4,653 | $6,894 | +48.16% | $3,691 | $7,568 | +105.04% |
| Sales & Marketing | $3,316 | $5,696 | +71.77% | $3,192 | $2,559 | -19.83% |
| General & Administrative | $4,602 | $4,221 | -8.28% | $2,756 | $7,589 | +175.36% |
| Total Operating Expenses | $12,571 | $16,811 | +33.73% | $9,639 | $17,716 | +83.80% |
| Operating Loss | $(9,198) | $(11,970) | +30.14% | $(7,457) | $(14,944) | +100.40% |
| Operating Margin (%) | -221.37% | -209.74% | +1,163 bps | -287.80% | -457.28% | -16,948 bps |
| Financing Income (Expense), net | $(6,398) | $(828) | -87.06% | $1,716 | $799 | -53.44% |
| Income Taxes | $(14) | $(21) | +50.00% | $(19) | $(64) | +236.84% |
| Net Loss | $(15,610) | $(12,819) | -17.88% | $(5,760) | $(14,209) | +146.68% |
| Net Loss Margin (%) | -375.69% | -224.62% | +15,107 bps | -222.31% | -434.79% | -21,248 bps |
| Stock-Based Compensation (SBC) | $1,551 | $3,024 | +94.97% | $2,255 | $5,440 | +141.24% |
| Non-Recurring Transaction Bonus/Costs | — | — | N/A | — | $3,438 | N/A |
| Adjusted EBITDA | $(7,601) | $(8,888) | +16.93% | $(5,173) | $(6,037) | +16.70% |
| Operating Cash Flow (OCF) | $(5,196) | $(8,144) | +56.74% | $(3,833) | $(4,995) | +30.32% |
| Capital Expenditures (CapEx) | $(86) | $(55) | -36.05% | $(29) | $(28) | -3.45% |
| Free Cash Flow (FCF) | $(5,282) | $(8,199) | +55.23% | $(3,862) | $(5,023) | +30.06% |
Operating cash outflows expanded from $(5,196) thousand in FY2024 to $(8,144) thousand in FY2025 ($683.3 thousand monthly FCF burn) and reached $(4,995) thousand in H1 2026 ($837.2 thousand monthly FCF burn). Standalone cash and cash equivalents stood at $794 thousand as of June 30, 2026, representing approximately 0.95 months (28 days) of organic operational runway. Although a post-period private investment in public equity (PIPE) closed on July 10, 2026, delivering ~$5.3 million in net proceeds ($6.0 million gross at $0.435 per share) to establish a pro forma cash base of ~$6,094 thousand, baseline burn rates absorb this reserve within ~7.28 months.
A stress test assuming a 30% reduction in monthly cash inflows (-$163.4 thousand/month) and a 25% inflation in compute/API ingestion costs (+$23.7 thousand/month) escalates free cash burn to ~$974.3 thousand per month, shortening post-PIPE liquidity runway to ~6.25 months and exhausting capital near year-end 2026. The balance sheet reflects an accumulated deficit of $61,582 thousand and a working capital deficit of $(11,871) thousand as of June 30, 2026.
Stock-based compensation has decoupled from commercial scale, expanding from 37.33% of revenue in FY2024 to 52.99% in FY2025, and surging to 166.46% of revenue in H1 2026 ($5,440 thousand). R&D expense accounting remains conservative with a 0.00% capitalization ratio under ASC 985-20 / ASC 350-40, expensing all internal engineering ($6,894 thousand in FY2025; $7,568 thousand in H1 2026) directly to operations.
Customer concentration is elevated: the top two accounts generated $1,590 thousand, or 27.86% of total consolidated revenue in FY2025 (Customer A at $997 thousand / 17.47%; Customer B at $593 thousand / 10.39%), compared to five accounts comprising 53.48% ($2,222 thousand) in FY2024. In the Form S-1, management explicitly disclaims the tracking or disclosure of Net Retention Rate (NRR), Gross Retention Rate (GRR), Customer Acquisition Cost (CAC), Lifetime Value (LTV), and Logo Churn, citing an early commercialization stage. Cyabra posted a Rule of 40 score of -172.39% in FY2025 (operating margin basis) and -431.15% in H1 2026.
Infrastructure Layout, Geographic Dependencies, and Sovereign Encumbrances
Cyabra operates via a dual-hub operational architecture that bifurcates sovereign defense research and development from North American commercial go-to-market functions:
* Tel Aviv Global Corporate and Engineering HQ: Located at 13 Gershon Shatz, Tel Aviv, Israel (5,500 square feet; lease expiring October 31, 2027, at ~$18 thousand monthly). Houses core algorithmic development, data labeling ("golden dataset" curation), executive leadership, and substantially all long-lived assets. Operations are exposed to regional security escalations and compulsory military reserve obligations under Israeli defense frameworks.
* New York Commercial Hub: Cyabra Strategy Inc. (Delaware operating subsidiary) located at 240W 40th St, New York, NY (2,546 square feet; lease expiring April 30, 2027, at ~$11 thousand monthly). Manages direct enterprise sales, channel distribution, and public-sector account management across North America.
* Global Cloud and Ingestion Pipeline: Cyabra operates zero physical data centers, maintaining its production platform entirely on Amazon Web Services, Inc. [NASDAQ: AMZN] without minimum long-term purchase obligations or take-or-pay GPU commitments. System continuity requires uninterrupted automated ingestion and scraping via public APIs across X (formerly Twitter), Meta Platforms, Inc. [NASDAQ: META] (Facebook and Instagram), LinkedIn, and syndication feeds, creating exposure to API rate gating, IP blocking, anti-scraping CAPTCHAs, and regulatory liabilities under GDPR, the California CPRA, and the amended Israeli Privacy Protection Law (PPL 5741-1981).
* Sovereign Intellectual Property Restrictions: Cyabra maintains zero granted patents and zero pending patent applications, relying on trade secrets and human-labeled datasets. Core R&D is encumbered by the Israel Innovation Authority (IIA), having received $719 thousand in historical grants with an outstanding theoretical balance of ~$527 thousand (including accrued interest) as of December 15, 2025, and an ongoing 3.0% to 3.5% royalty obligation ($171 thousand incurred in FY2025; $144 thousand in FY2024). Under the Israeli Innovation Law, any transfer or exclusive licensing of IIA-funded know-how outside the State of Israel requires discretionary government approval and payment of a statutory Redemption Fee capped at up to 600% of grants received plus accrued interest.
Geographic revenue attribution demonstrates an increasing domestic reliance:
| Geographic Region (UN Naming Standard) | FY2024 Audited Revenue ($k) | FY2024 Share (%) | FY2025 Audited Revenue ($k) | FY2025 Share (%) | YoY Growth (%) |
| State of Israel | $2,165 | 52.11% | $4,603 | 80.66% | +112.61% |
| United States of America | $1,990 | 47.89% | $1,104 | 19.34% | -44.52% |
| Rest of World | $0 | 0.00% | $0 | 0.00% | 0.00% |
| Consolidated Total | $4,155 | 100.00% | $5,707 | 100.00% | +37.35% |
HDIN Institutional Verdict
Management's operational narrative highlights the emergence of a planetary enterprise defense platform against synthetic GenAI disinformation, referencing external industry projections of a $500 billion mitigation market by 2028. However, audited financial realities confirm that Cyabra operates as a sub-scale government contractor and intelligence boutique. Top-line revenue remains heavily concentrated within the State of Israel (80.66% in FY2025), while ARR stalled completely at $6.1 million between FY2024 and FY2025 due to administrative procurement delays and contract churn, before reaching $8.1 million as of June 30, 2026. Remaining Performance Obligations (RPO) show that 86.10% of forward contracted revenue as of June 30, 2026 ($4,230 thousand out of $4,913 thousand) is realized within 12 months, indicating a compressed average contract duration of 12 to 14 months rather than multi-year institutional software commitments.
Governance and capital allocation audits unmask extensive derivative overhang and insider-affiliated debt restructurings:
| Capital Instrument / Overhang Tranche | Underlying Shares | % of Fully Diluted Capital | Structural Terms & Exercise Specifications |
| Issued & Outstanding Common Stock | 34,784,611 | 19.96% | Active Nasdaq float ($0.0001 par value) as of October 7, 2026. |
| Pre-Funded Warrants | 39,127,138 | 22.46% | Exercise price
0.4349). |
| Series A Common Warrants | 38,324,517 | 22.00% | Exercise price $0.50; 5-year expiration (September 2031). |
| Series B Common Warrants | 38,324,517 | 22.00% | Exercise price $0.45; 12-month expiration (September 2027). |
| 2026 Equity Incentive Plan Reserve | 22,072,125 | 12.67% | Future option pool; carries an annual 5.0% evergreen increase through 2036. |
| Replacement Options (Legacy ESOP) | 1,153,587 | 0.66% | Converted at 1:3.6097 ratio; 10-year original expiration terms. |
| Legacy Financing / Working Capital Warrants | 449,983 | 0.25% | 400k at $11.50 (PIPE) + 49.98k at $3.6011 (Bank Hapoalim). |
| Total Fully Diluted Capitalization | 174,236,478 | 100.00% | 400.9% derivative expansion over basic common stock. |
The corporate structure exhibits multiple governance encumbrances and financial liabilities:
* Sponsor Windfall Conversion: Trailblazer Sponsor Group expanded working capital notes to $5,330 thousand prior to the business combination, converting at a 300% multiplier into $15,990 thousand of stated value ($5,330 thousand Series B and $10,660 thousand Series C Preferred Stock).
* Institutional Creditor Dilution: In September 2026, Alpha Capital Anstalt exchanged its $10.66 million Series C Preferred Stock for 24,505,747 Pre-Funded Warrants ($0.0001 strike), 24,505,747 Series A Warrants ($0.50 strike), and 24,505,747 Series B Warrants ($0.45 strike), securing 73,517,241 underlying derivative shares. Alpha also previously held debt carrying 50% sweeps of all gross revenues and financing receipts.
* Resale Float Overhang: This Form S-1 secondary registration covers 21,466,410 common shares held by Selling Shareholders (Alpha Capital Anstalt and Armistice Capital Master Fund Ltd.), representing 61.72% of total basic common stock. If exercised for cash, basic shares expand from 34,784,611 to 56,251,021 shares, generating an immediate 38.16% dilution to basic equity holders while providing zero capital proceeds to Cyabra if exercised cashlessly.
* Executive Bonuses & Retainers: Co-founders Dan Brahmy, Yossef Daar, and Ido Shraga received $400 thousand transaction cash bonuses each ($1,200 thousand total) upon merger closing plus 400,000 RSUs, and are eligible for 3,000,000 earnout shares at $15.00, $20.00, and $25.00 thresholds. Affiliated Director Josette Sheeran receives a $4,000 monthly retainer, a 10% gross commission on introduced client contracts, and 144,387 stock options via Firefly Global Group.
* Overdue Legal Liabilities: The financial footnotes disclose an overdue transaction legal fee note to Lowenstein Sandler LLP with an unpaid balance of $1,631 thousand as of June 30, 2026, for which the company is jointly and severally liable.
* Regulatory Delisting Proceedings: Cyabra trades well below the $1.00 minimum bid requirement ($0.20 as of October 6, 2026) and faces three active Nasdaq deficiency proceedings: Rule 5450(b)(2)(A) for Market Value of Listed Securities below $50 million (grace period expired November 9, 2026), Rule 5450(b)(2)(C) for Market Value of Publicly Held Shares below $15 million (deadline December 7, 2026), and Rule 5450(a)(1) for minimum bid price (deadline December 7, 2026).
Independent auditor Somekh Chaikin (KPMG International) maintains an active going-concern explanatory paragraph. Because the registered secondary offering provides no primary operating capital, Cyabra remains constrained by an unabsorbed fixed cost structure, high account concentration, and persistent financing requirements to fund its ~$837 thousand monthly cash drain.
Presentation Download & Video Access:
- Presentation Download: Click the PDF download link under 'Related Topics' to access the full institutional presentation of this report.
- Video Link: Click this link to watch the HDIN analyst briefing on YouTube.
About HDIN Research:
HDIN Research is a premier global market intelligence and strategic advisory firm specializing in institutional-grade financial analysis, supply chain audits, and macroeconomic forecasting. Our dedicated sector analysts deliver actionable, data-driven insights tailored for private equity, hedge funds, and corporate strategy teams. Visit us at http://www.hdinresearch.com.
2026 AI Transparency Footer:
"This intelligence report was authored by HDIN Research analysts following a rigorous audit of official corporate filings. AI was utilized for massive-scale data synthesis and structural drafting, ensuring 100% inclusion of reported data points. All strategic insights, financial modeling, and final verdicts were verified by our editorial board to ensure professional accuracy and compliance with 2026 Google Search E-E-A-T standards."