Micron Technology, Inc.: Fiscal 2026 AI Architecture Realignment Drives $99.34B Operating Income Inflection
Date : 2026-10-12
Reading : 665
HDIN Executive Takeaways
1. Micron Technology, Inc. [NASDAQ: MU] achieved a consolidated revenue expansion of 256.3% YoY to $133.19 billion in FY2026, driven by average selling price inflections of ~180% in DRAM and ~200% in NAND.
2. Operating leverage and strict allocation expanded gross margins by 4,090 bps to 80.7%, while free cash flow reached $62.28 billion net of incentives, eliminating net debt to establish a $68.27 billion net cash fortress.
3. Structural risk shifts to upstream lithography reliance on ASML, pending putative antitrust class actions in the U.S., and severe geographic asset concentration, with 43.1% of long-lived assets situated in Taiwan, Province of China.
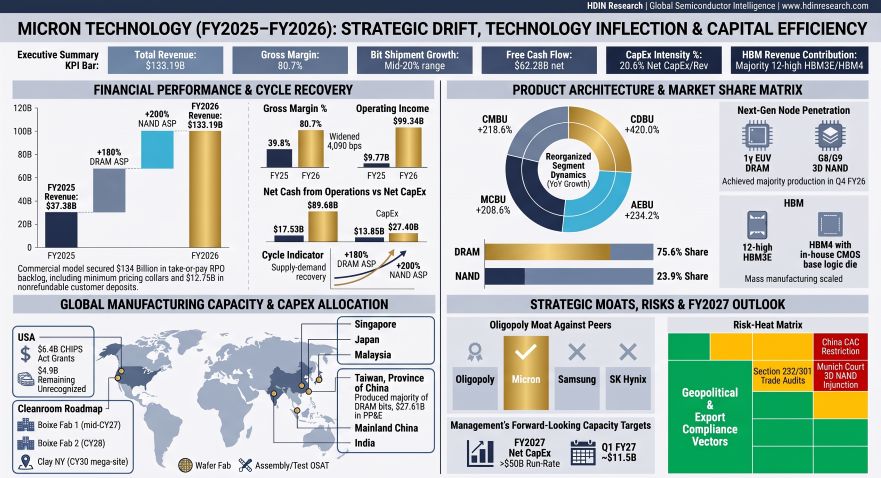
Figure MICRON TECHNOLOGY (FY2025-FV2026) STRATEGIC DRIFT, TECHNOLOGY INFLECTION & CAPITAL EFFICIENC
Segmental Realities and Operating Leverage
Micron's transition through the 53 weeks ended September 3, 2026, demonstrated unprecedented financial performance as artificial intelligence workloads created severe structural memory deficits. Consolidated gross margins widened from 39.8% ($14.87 billion) in FY2025 to 80.7% ($107.50 billion) in FY2026, while operating income expanded 916.8% YoY from $9.77 billion to $99.34 billion. Cost of goods sold (COGS) increased just 14.1% YoY to $25.68 billion, demonstrating structural operating leverage against 256.3% top-line growth.
Table Consolidated Financial Performance, Product Segment Revenue, and Operating Leverage Analysis
Following the segment realignment executed in Q4 FY2025, Micron restructured reportable operations into four market-facing units, all of which exceeded 70% operating margins in FY2026:
* Cloud Memory Business Unit (CMBU): Revenue rose 218.6% YoY to $43.09 billion (32.3% of revenue) with operating income of $31.23 billion (72.5% operating margin, up 2,720 bps). Growth was driven by 12-high 36GB HBM3E on the 1β node, sampling of 12-high 36GB HBM4 with in-house CMOS base logic dies, and 128GB/256GB DDR5 RDIMMs. Segment R&D absorbed $2.51 billion (+90.9% YoY) targeting HBM4 and HBM4E nodes.
* Core Data Center Business Unit (CDBU): Generated the highest rate of top-line growth, surging 420.0% YoY to $37.59 billion with operating profit reaching $29.54 billion (78.6% margin, up 4,840 bps). Catalysts included enterprise NVMe SSD deployments powered by the G9 QLC NAND node (including the 245TB 6600 ION SSD) across NeoCloud and OEM architectures.
* Mobile & Client Business Unit (MCBU): Revenue increased 208.6% YoY to $36.60 billion as operating income jumped to $29.21 billion (79.8% margin, up 6,310 bps). Crucially, MCBU bit shipments contracted YoY as production was intentionally restricted to redirect supply to data center segments. The top-line gain was entirely price-driven across 1β/1γ LPDDR5X and client SSDs, aided by the complete operational exit from the consumer retail Crucial product line in December 2025.
* Automotive & Embedded Business Unit (AEBU): Expanded 234.2% YoY to $15.89 billion, generating operating income of $11.22 billion (70.6% margin, up 5,890 bps), propelled by ADAS, infotainment, and the ramp of 1α DDR4 legacy architectures from Manassas, Virginia.
* Unallocated Corporate Items: Unallocated losses totaled $1.85 billion in FY2026 ($1.08 billion in FY2025), comprising $1.28 billion in stock-based compensation and a $500 million patent litigation charge associated with the October 5, 2026 Netlist settlement.
Table Business Unit Segment Operating Performance, Revenue Scaling, and Margin Expansion Analysis
Cash Flow Inflows and Balance Sheet Restructuring
Operating cash flow surged 411.7% YoY from $17.53 billion in FY2025 to $89.68 billion in FY2026. This supported gross capital expenditures of $30.71 billion (net CapEx of $27.40 billion after $3.32 billion in government incentives), resulting in free cash flow of $58.96 billion on a gross basis and $62.28 billion net of incentives.
Micron deployed this capital to extinguish $8.74 billion in carrying debt value (principal of $8.77 billion) via a $9.26 billion cash outlay, recognizing a $510 million non-operating debt extinguishment loss. Total carrying debt contracted 64.5% from $14.58 billion to $5.18 billion (comprising $2.79 billion in senior unsecured notes and $2.39 billion in finance leases). Factoring in total cash and marketable investments of $73.45 billion ($38.36 billion cash, $5.07 billion short-term, $30.02 billion long-term), Micron transformed its liquidity profile from net debt of $2.64 billion to net cash of $68.27 billion, lowering the Net Debt/EBITDA ratio from +0.15x to -0.63x.
Table Consolidated Balance Sheet, Working Capital Dynamics, and Liquidity Deleveraging Analysis
Working capital adjustments revealed a sharp drop in finished goods (-12.4% YoY to $958 million, representing just 9.2% of total inventories), reflecting rapid customer inventory uptake. WIP expanded 28.9% to $8.25 billion, driven by the longer cycle times of 1γ EUV front-end processing and 12-high HBM packaging. Micron recorded $0 in inventory net realizable value (NRV) write-downs across FY2025 and FY2026.
Infrastructure Layout, Global Moats, and Capital Realignment
Gross property, plant, and equipment (PP&E) expanded to $134.18 billion (net PP&E of $63.31 billion after $70.87 billion in accumulated depreciation). Equipment carrying values reached $93.95 billion, with tools not yet placed in service expanding 51.1% YoY to $6.12 billion. Construction in progress more than doubled (+107.0% YoY) to $11.42 billion, with 12-month PP&E purchase obligations rising 136.2% YoY to $4.18 billion.
Long-lived assets ($64.03 billion total) remain geographically concentrated:
* Taiwan, Province of China: $27.61 billion (43.1% share), producing the majority of total company DRAM bits, supplemented by the $1.80 billion cash acquisition of PSMC’s 300mm Tongluo fab in March 2026.
* United States: $14.46 billion (22.6% share), supported by Boise Fab 1 (first wafers mid-CY2027), Boise Fab 2 (slated late-CY2028), the Clay, New York 4-fab complex (first wafers CY2030), and the $10 billion, 10-year Micron Research Labs initiative announced in August 2026.
* Singapore: $12.35 billion (19.3% share), covering the core 3D NAND complex, the dedicated HBM packaging facility broke ground in January 2025 (online early CY2027), and a new cleanroom shell fab broke ground in January 2026 (operational 2H CY2028).
* Japan: $7.25 billion (11.3% share), anchored by the Hiroshima cleanroom expansion broke ground in July 2026 for EUV DRAM (online late CY2028).
* Malaysia ($1.18B, 1.8%), India ($609M, 1.0%), and Mainland China ($473M, 0.7%).
Table Geographic Net Revenue Disaggregation by Customer Billing Jurisdiction and Market Concentration
A structural divergence persists between customer billing headquarters and product destination: while the United States generated 68.6% ($91.32 billion) of revenue based on corporate headquarters, ~70% of physical wafer and component shipments were delivered to Asia-Pacific manufacturing destinations.
HDIN Institutional Verdict
Micron’s financial results highlight strong execution during an AI demand surge, but forward guidance and off-balance-sheet commitments present significant operational hurdles:
1. CapEx Acceleration and Asset Exposure: Forward guidance projects net CapEx of ~$11.5 billion in Q1 FY2027 and ~$25.0 billion in 1H FY2027, with 2H FY2027 guided higher, implying an annualized run-rate exceeding $50 billion. This capital deployment coincides with an expansion of noncancelable multi-year purchase obligations to $10.8 billion ($4.4 billion due after 5 years). Any cyclical pause in hyperscale spending could expose Micron to unabsorbed fab depreciation, particularly given that single-source exposure to ASML for EUV lithography limits tool delivery flexibility.
2. Contracting Architecture vs. Reallocation Risks: The establishment of multi-year take-or-pay strategic agreements secured $12.75 billion in cash deposits, $7.0 billion in letters of credit, and an RPO of approximately $134 billion (~25% to be recognized within 12 months). While pricing collars are structured to maintain gross margins above historical cyclical peaks, management acknowledges that HBM consumes 3x the wafer area of conventional DRAM. Any drop in AI accelerator buildouts could force the industry to shift wafer lines back to standard DDR5 and LPDDR5X, increasing commodity bit supply and testing the enforceability of these customer pricing floors.
3. Accounting Disclosures and Earnings Quality: While production equipment useful lives remained fixed at 7 years, reported earnings were directly supported by $10.93 billion in cumulative government subsidies ($6.43 billion applied in FY2026), which reduced FY2026 COGS by $703 million and R&D by $198 million, boosting operating income by $901 million. Furthermore, Micron’s practice of pooling DRAM and NAND as a single inventory group allowed high DRAM margins to absorb inventory balances, masking localized lower-of-cost-or-market exposures.
4. Legal Vulnerabilities and Regulatory Guardrails: The $500 million Netlist patent settlement clears one major dispute, but downside risks remain. State-backed competitor YMTC secured a cease-and-desist injunction from the Munich Regional Court on October 6, 2026, barring Micron from offering or importing accused 3D NAND products in Germany. Concurrently, putative class actions filed in ND Cal and Hawaii allege DRAM price-fixing and supply coordination under the Sherman Act with Samsung and SK hynix. In the U.S., covenants governing $6.4 billion in direct CHIPS Act grants enforce upside profit-sharing of up to 75%, restrict share buybacks and special dividends, and mandate annual security audits across 20% of Tier-1 suppliers, constraining management's strategic flexibility.
Presentation Download & Video Access:
- Presentation Download: Click the PDF download link under 'Related Topics' to access the full institutional presentation of this report.
- Video Link: Click this link to watch the HDIN analyst briefing on YouTube.
About HDIN Research:
HDIN Research is a global market intelligence and strategic advisory firm specializing in institutional-grade financial analysis, supply chain audits, and macroeconomic forecasting. Our dedicated sector analysts deliver actionable, data-driven insights tailored for private equity, hedge funds, and corporate strategy teams. Visit us at http://www.hdinresearch.com.
2026 AI Transparency Footer:
"This intelligence report was authored by HDIN Research analysts following a rigorous audit of official corporate filings. AI was utilized for massive-scale data synthesis and structural drafting, ensuring 100% inclusion of reported data points. All strategic insights, financial modeling, and final verdicts were verified by our editorial board to ensure professional accuracy and compliance with 2026 Google Search E-E-A-T standards."
1. Micron Technology, Inc. [NASDAQ: MU] achieved a consolidated revenue expansion of 256.3% YoY to $133.19 billion in FY2026, driven by average selling price inflections of ~180% in DRAM and ~200% in NAND.
2. Operating leverage and strict allocation expanded gross margins by 4,090 bps to 80.7%, while free cash flow reached $62.28 billion net of incentives, eliminating net debt to establish a $68.27 billion net cash fortress.
3. Structural risk shifts to upstream lithography reliance on ASML, pending putative antitrust class actions in the U.S., and severe geographic asset concentration, with 43.1% of long-lived assets situated in Taiwan, Province of China.
Figure MICRON TECHNOLOGY (FY2025-FV2026) STRATEGIC DRIFT, TECHNOLOGY INFLECTION & CAPITAL EFFICIENC
Segmental Realities and Operating Leverage
Micron's transition through the 53 weeks ended September 3, 2026, demonstrated unprecedented financial performance as artificial intelligence workloads created severe structural memory deficits. Consolidated gross margins widened from 39.8% ($14.87 billion) in FY2025 to 80.7% ($107.50 billion) in FY2026, while operating income expanded 916.8% YoY from $9.77 billion to $99.34 billion. Cost of goods sold (COGS) increased just 14.1% YoY to $25.68 billion, demonstrating structural operating leverage against 256.3% top-line growth.
Table Consolidated Financial Performance, Product Segment Revenue, and Operating Leverage Analysis
| Metric (in $ millions, except % and EPS) | FY2025 (52 weeks) | FY2026 (53 weeks) | YoY Change ($) | YoY Change (%) |
| Consolidated Revenue | $37,378 | $133,188 | +$95,810 | +256.3% |
| DRAM Revenue | $28,578 | $100,679 | +$72,101 | +252.3% |
| NAND Flash Revenue | $8,503 | $31,785 | +$23,282 | +273.8% |
| Other Revenue (primarily NOR) | $297 | $724 | +$427 | +143.8% |
| Cost of Goods Sold (COGS) | $22,505 | $25,684 | +$3,179 | +14.1% |
| Gross Margin (Gross Profit) | $14,873 | $107,504 | +$92,631 | +622.8% |
| Gross Margin (%) | 39.8% | 80.7% | — | +4,090 bps |
| Research & Development (R&D) | $3,798 | $5,650 | +$1,852 | +48.8% |
| Selling, General & Administrative (SG&A) | $1,205 | $1,947 | +$742 | +61.6% |
| Other Operating Expense (Income), net | $100 | $567 | +$467 | +467.0% |
| Operating Income (EBIT) | $9,770 | $99,340 | +$89,570 | +916.8% |
| Operating Margin (%) | 26.1% | 74.6% | — | +4,845 bps |
| Net Interest Income (Expense) | $19 | $978 | +$959 | N/A |
| Other Non-Operating Expense, net | $(135) | $(647) | -$512 | +379.3% |
| Income Tax Provision | $(1,124) | $(14,761) | -$13,637 | +1,213.3% |
| Equity in Net Income of Investees | $9 | $59 | +$50 | +555.6% |
| Consolidated Net Income | $8,539 | $84,969 | +$76,430 | +895.1% |
| Net Margin (%) | 22.8% | 63.8% | — | +4,095 bps |
| Depreciation & Amortization (D&A) | $8,352 | $9,503 | +$1,151 | +13.8% |
| EBITDA | $18,122 | $108,843 | +$90,721 | +500.6% |
| EBITDA Margin (%) | 48.5% | 81.7% | — | +3,324 bps |
| Diluted Earnings Per Share (EPS) | $7.59 | $74.33 | +$66.74 | +879.3% |
Following the segment realignment executed in Q4 FY2025, Micron restructured reportable operations into four market-facing units, all of which exceeded 70% operating margins in FY2026:
* Cloud Memory Business Unit (CMBU): Revenue rose 218.6% YoY to $43.09 billion (32.3% of revenue) with operating income of $31.23 billion (72.5% operating margin, up 2,720 bps). Growth was driven by 12-high 36GB HBM3E on the 1β node, sampling of 12-high 36GB HBM4 with in-house CMOS base logic dies, and 128GB/256GB DDR5 RDIMMs. Segment R&D absorbed $2.51 billion (+90.9% YoY) targeting HBM4 and HBM4E nodes.
* Core Data Center Business Unit (CDBU): Generated the highest rate of top-line growth, surging 420.0% YoY to $37.59 billion with operating profit reaching $29.54 billion (78.6% margin, up 4,840 bps). Catalysts included enterprise NVMe SSD deployments powered by the G9 QLC NAND node (including the 245TB 6600 ION SSD) across NeoCloud and OEM architectures.
* Mobile & Client Business Unit (MCBU): Revenue increased 208.6% YoY to $36.60 billion as operating income jumped to $29.21 billion (79.8% margin, up 6,310 bps). Crucially, MCBU bit shipments contracted YoY as production was intentionally restricted to redirect supply to data center segments. The top-line gain was entirely price-driven across 1β/1γ LPDDR5X and client SSDs, aided by the complete operational exit from the consumer retail Crucial product line in December 2025.
* Automotive & Embedded Business Unit (AEBU): Expanded 234.2% YoY to $15.89 billion, generating operating income of $11.22 billion (70.6% margin, up 5,890 bps), propelled by ADAS, infotainment, and the ramp of 1α DDR4 legacy architectures from Manassas, Virginia.
* Unallocated Corporate Items: Unallocated losses totaled $1.85 billion in FY2026 ($1.08 billion in FY2025), comprising $1.28 billion in stock-based compensation and a $500 million patent litigation charge associated with the October 5, 2026 Netlist settlement.
Table Business Unit Segment Operating Performance, Revenue Scaling, and Margin Expansion Analysis
| Business Unit Segment Performance | FY2025 Revenue ($M) | FY2026 Revenue ($M) | YoY Growth (%) | FY2025 Op. Margin | FY2026 Op. Margin | Margin Delta (bps) |
| Cloud Memory (CMBU) | $13,524 | $43,085 | +218.6% | 45.3% | 72.5% | +2,720 bps |
| Core Data Center (CDBU) | $7,229 | $37,592 | +420.0% | 30.2% | 78.6% | +4,840 bps |
| Mobile & Client (MCBU) | $11,859 | $36,601 | +208.6% | 16.7% | 79.8% | +6,310 bps |
| Automotive & Embedded (AEBU) | $4,753 | $15,886 | +234.2% | 11.7% | 70.6% | +5,890 bps |
| All Other | $13 | $24 | +84.6% | (7.7)% | 8.3% | +1,600 bps |
| Unallocated Corporate Items | — | — | — | $(1,076) | $(1,851) | -72.0% |
| Total Consolidated | $37,378 | $133,188 | +256.3% | 26.1% | 74.6% | +4,845 bps |
Cash Flow Inflows and Balance Sheet Restructuring
Operating cash flow surged 411.7% YoY from $17.53 billion in FY2025 to $89.68 billion in FY2026. This supported gross capital expenditures of $30.71 billion (net CapEx of $27.40 billion after $3.32 billion in government incentives), resulting in free cash flow of $58.96 billion on a gross basis and $62.28 billion net of incentives.
Micron deployed this capital to extinguish $8.74 billion in carrying debt value (principal of $8.77 billion) via a $9.26 billion cash outlay, recognizing a $510 million non-operating debt extinguishment loss. Total carrying debt contracted 64.5% from $14.58 billion to $5.18 billion (comprising $2.79 billion in senior unsecured notes and $2.39 billion in finance leases). Factoring in total cash and marketable investments of $73.45 billion ($38.36 billion cash, $5.07 billion short-term, $30.02 billion long-term), Micron transformed its liquidity profile from net debt of $2.64 billion to net cash of $68.27 billion, lowering the Net Debt/EBITDA ratio from +0.15x to -0.63x.
Table Consolidated Balance Sheet, Working Capital Dynamics, and Liquidity Deleveraging Analysis
| Balance Sheet & Working Capital Metrics | FY2025 | FY2026 | Change ($) | Change (%) / Trend |
| Cash & Cash Equivalents | $9,642 | $38,364 | +$28,722 | +297.9% |
| Short-Term Marketable Investments | $665 | $5,070 | +$4,405 | +662.4% |
| Long-Term Marketable Investments | $1,629 | $30,019 | +$28,390 | +1,742.8% |
| Total Cash & Marketable Investments | $11,936 | $73,453 | +$61,517 | +515.4% |
| Current Debt & Current Finance Leases | $560 | $491 | -$69 | -12.3% |
| Long-Term Debt & Noncurrent Finance Leases | $14,017 | $4,688 | -$9,329 | -66.6% |
| Total Debt Carrying Value | $14,577 | $5,179 | -$9,398 | -64.5% |
| Net Debt / (Net Cash Position) | +$2,641 | -$68,274 | -$70,915 | Fortress Net Cash |
| Net Debt to Trailing EBITDA Ratio | +0.15x | -0.63x | — | De-leveraged |
| Total Inventories | $8,355 | $10,372 | +$2,017 | +24.1% |
| Finished Goods Inventory | $1,094 | $958 | -$136 | -12.4% |
| Work in Process (WIP) | $6,401 | $8,252 | +$1,851 | +28.9% |
| Raw Materials & Supplies | $860 | $1,162 | +$302 | +35.1% |
| Days of Inventory Outstanding (Ending, 365d) | 135.5 days | 147.4 days | — | +11.9 days |
| Customer Contract Deposits (Noncurrent) | $142 | $12,895 | +$12,753 | +8,981.0% |
| Total Shareholders' Equity | $54,165 | $138,378 | +$84,213 | +155.5% |
Working capital adjustments revealed a sharp drop in finished goods (-12.4% YoY to $958 million, representing just 9.2% of total inventories), reflecting rapid customer inventory uptake. WIP expanded 28.9% to $8.25 billion, driven by the longer cycle times of 1γ EUV front-end processing and 12-high HBM packaging. Micron recorded $0 in inventory net realizable value (NRV) write-downs across FY2025 and FY2026.
Infrastructure Layout, Global Moats, and Capital Realignment
Gross property, plant, and equipment (PP&E) expanded to $134.18 billion (net PP&E of $63.31 billion after $70.87 billion in accumulated depreciation). Equipment carrying values reached $93.95 billion, with tools not yet placed in service expanding 51.1% YoY to $6.12 billion. Construction in progress more than doubled (+107.0% YoY) to $11.42 billion, with 12-month PP&E purchase obligations rising 136.2% YoY to $4.18 billion.
Long-lived assets ($64.03 billion total) remain geographically concentrated:
* Taiwan, Province of China: $27.61 billion (43.1% share), producing the majority of total company DRAM bits, supplemented by the $1.80 billion cash acquisition of PSMC’s 300mm Tongluo fab in March 2026.
* United States: $14.46 billion (22.6% share), supported by Boise Fab 1 (first wafers mid-CY2027), Boise Fab 2 (slated late-CY2028), the Clay, New York 4-fab complex (first wafers CY2030), and the $10 billion, 10-year Micron Research Labs initiative announced in August 2026.
* Singapore: $12.35 billion (19.3% share), covering the core 3D NAND complex, the dedicated HBM packaging facility broke ground in January 2025 (online early CY2027), and a new cleanroom shell fab broke ground in January 2026 (operational 2H CY2028).
* Japan: $7.25 billion (11.3% share), anchored by the Hiroshima cleanroom expansion broke ground in July 2026 for EUV DRAM (online late CY2028).
* Malaysia ($1.18B, 1.8%), India ($609M, 1.0%), and Mainland China ($473M, 0.7%).
Table Geographic Net Revenue Disaggregation by Customer Billing Jurisdiction and Market Concentration
| Customer HQ Jurisdiction (Billing) | FY2025 Revenue ($M) | FY2026 Revenue ($M) | YoY Growth (%) | FY2026 Share (%) |
| United States | $24,113 | $91,323 | +278.7% | 68.6% |
| Taiwan, Province of China | $5,672 | $16,950 | +198.8% | 12.7% |
| Mainland China (excl. Hong Kong) | $2,639 | $8,338 | +216.0% | 6.3% |
| Hong Kong | $1,138 | $6,289 | +452.6% | 4.7% |
| Other Asia Pacific | $1,913 | $5,777 | +202.0% | 4.3% |
| Japan | $895 | $2,066 | +130.8% | 1.6% |
| Europe | $625 | $1,716 | +174.6% | 1.3% |
| Other Regions | $383 | $729 | +90.3% | 0.5% |
| Total Net Sales | $37,378 | $133,188 | +256.3% | 100.0% |
A structural divergence persists between customer billing headquarters and product destination: while the United States generated 68.6% ($91.32 billion) of revenue based on corporate headquarters, ~70% of physical wafer and component shipments were delivered to Asia-Pacific manufacturing destinations.
HDIN Institutional Verdict
Micron’s financial results highlight strong execution during an AI demand surge, but forward guidance and off-balance-sheet commitments present significant operational hurdles:
1. CapEx Acceleration and Asset Exposure: Forward guidance projects net CapEx of ~$11.5 billion in Q1 FY2027 and ~$25.0 billion in 1H FY2027, with 2H FY2027 guided higher, implying an annualized run-rate exceeding $50 billion. This capital deployment coincides with an expansion of noncancelable multi-year purchase obligations to $10.8 billion ($4.4 billion due after 5 years). Any cyclical pause in hyperscale spending could expose Micron to unabsorbed fab depreciation, particularly given that single-source exposure to ASML for EUV lithography limits tool delivery flexibility.
2. Contracting Architecture vs. Reallocation Risks: The establishment of multi-year take-or-pay strategic agreements secured $12.75 billion in cash deposits, $7.0 billion in letters of credit, and an RPO of approximately $134 billion (~25% to be recognized within 12 months). While pricing collars are structured to maintain gross margins above historical cyclical peaks, management acknowledges that HBM consumes 3x the wafer area of conventional DRAM. Any drop in AI accelerator buildouts could force the industry to shift wafer lines back to standard DDR5 and LPDDR5X, increasing commodity bit supply and testing the enforceability of these customer pricing floors.
3. Accounting Disclosures and Earnings Quality: While production equipment useful lives remained fixed at 7 years, reported earnings were directly supported by $10.93 billion in cumulative government subsidies ($6.43 billion applied in FY2026), which reduced FY2026 COGS by $703 million and R&D by $198 million, boosting operating income by $901 million. Furthermore, Micron’s practice of pooling DRAM and NAND as a single inventory group allowed high DRAM margins to absorb inventory balances, masking localized lower-of-cost-or-market exposures.
4. Legal Vulnerabilities and Regulatory Guardrails: The $500 million Netlist patent settlement clears one major dispute, but downside risks remain. State-backed competitor YMTC secured a cease-and-desist injunction from the Munich Regional Court on October 6, 2026, barring Micron from offering or importing accused 3D NAND products in Germany. Concurrently, putative class actions filed in ND Cal and Hawaii allege DRAM price-fixing and supply coordination under the Sherman Act with Samsung and SK hynix. In the U.S., covenants governing $6.4 billion in direct CHIPS Act grants enforce upside profit-sharing of up to 75%, restrict share buybacks and special dividends, and mandate annual security audits across 20% of Tier-1 suppliers, constraining management's strategic flexibility.
Presentation Download & Video Access:
- Presentation Download: Click the PDF download link under 'Related Topics' to access the full institutional presentation of this report.
- Video Link: Click this link to watch the HDIN analyst briefing on YouTube.
About HDIN Research:
HDIN Research is a global market intelligence and strategic advisory firm specializing in institutional-grade financial analysis, supply chain audits, and macroeconomic forecasting. Our dedicated sector analysts deliver actionable, data-driven insights tailored for private equity, hedge funds, and corporate strategy teams. Visit us at http://www.hdinresearch.com.
2026 AI Transparency Footer:
"This intelligence report was authored by HDIN Research analysts following a rigorous audit of official corporate filings. AI was utilized for massive-scale data synthesis and structural drafting, ensuring 100% inclusion of reported data points. All strategic insights, financial modeling, and final verdicts were verified by our editorial board to ensure professional accuracy and compliance with 2026 Google Search E-E-A-T standards."