BEML Limited: Strategic Pivot Toward Rail and Defence Systems Squeezes Operating Margins to 5.62% Amid ₹300 Crore Contract Provisions and Working Capital Expansion
Date : 2026-10-15
Reading : 128
HDIN Executive Takeaways
1. BEML Limited [NSE: BEML / BSE: 500048] expanded Standalone Revenue from Operations +8.16% to ₹435,053 Lakhs in FY 2025–26, driven by direct Rail & Metro deliveries (+114.10%) and Defence platforms (+47.42%), which offset a -35.06% contraction in Earth Moving Equipment.
2. Profitability collapsed as Profit Before Tax dropped -50.90% to ₹19,908 Lakhs, impacted by ₹23,257.52 Lakhs in Ind AS 37 Onerous Contract provisions and ₹6,788.78 Lakhs in Liquidated Damages on multi-year transit and rail platform executions.
3. Operating cash flows failed to self-fund an expanded capital expenditure program of ₹37,875.64 Lakhs, pushing Free Cash Flow to Firm (FCFF) to -₹25,236.45 Lakhs due to a ₹56,594.94 Lakhs cash absorption in Trade Receivables (172 DSO) and ₹71,549.81 Lakhs in unbilled Contract Assets.
Figure BEML LIMITED (FY 2025-26) STRATEGIC VALUE ENGINE & HEAVY INDUSTRIAL TRAJECTORY
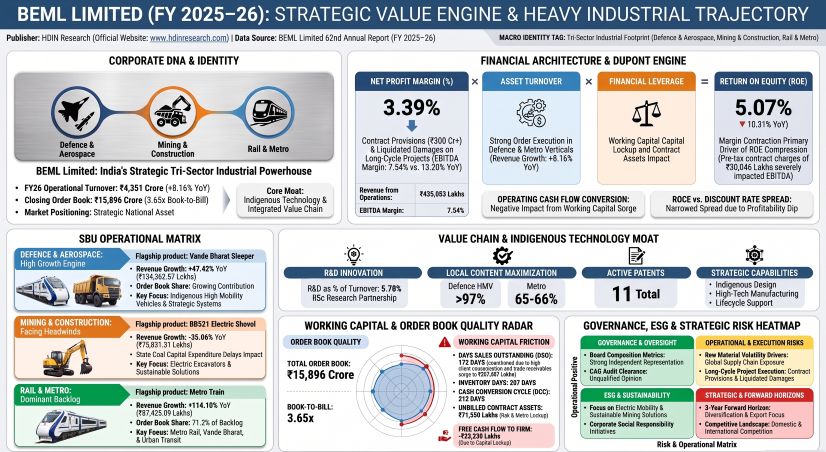 Segment Dynamics and Margin Compression
BEML Limited operates under a statutory disclosure exemption pursuant to Ministry of Corporate Affairs (MCA) Notification No. S.O.802(E) / Notification No. 1/2/2014-CL-V dated February 23, 2018, which legally exempts defence production entities from segment disclosures under Ind AS 108 (Operating Segments). Consequently, Segment EBIT, Segment Operating Assets, and Segment Capital Employed are not published in standalone financial statement notes.
Operational disaggregation reconstructed from Note 30 (Revenue from Operations), contract disclosures, and statutory annexures confirms a structural shift from Mining & Construction (M&C) toward high-technology mobility platforms:
* Defence & Aerospace: Generated ₹134,362.57 Lakhs in direct product sales (+47.42% YoY), representing 35.0% of total entity turnover (NIC Code 30400). SBU revenue grew +38% YoY, marking an all-time record. Growth was supported by Ministry of Defence (MoD) procurement contracts for 150 units of High Mobility Vehicles (HMV) 6x6 and 120 units of HMV 8x8 (valued at ₹557 Crore), the induction of the Mechanical Minefield Marking Equipment Mk-II (MMME Mk-II), and Bharat Electronics Limited (BEL) orders for Quick Reaction Surface-to-Air Missile (QRSAM) platforms. The vertical carries a legacy drag from ₹280.17 Crore in customer advances received under an October 2011 contract for 204 Armoured Recovery Vehicles (ARV WZT-3), which is being short-closed with downward quantity revisions and price refixation due to foreign aggregate delivery defaults.
* Mining & Construction: Historically the anchor vertical, turnover share dropped to 41.0% (NIC Code 28243). Direct sales of Earth Moving Equipment contracted -35.06% YoY to ₹75,831.31 Lakhs, with overall vertical sales falling -19% YoY due to capital procurement deferrals across state-owned coal mining undertakings. The drop was mitigated by aftermarket sales, including Spare Parts (₹87,032.91 Lakhs) and Equipment Servicing (₹13,118.59 Lakhs). Product milestones included the handover of India’s first indigenous 21 cu.m Electric Rope Shovel (BRS21), development of 190-ton Electric Dump Trucks, the BH35-2EV hauler, and an MoU with TESMEC S.p.A. for continuous surface miners.
* Rail & Metro: Contributed 24.0% of company turnover (NIC Code 30202). Direct product sales rose +114.10% YoY to ₹87,425.89 Lakhs. This segment dominates the closing order backlog, holding ₹11,320 Crore (71.21% of the corporate total of ₹15,896 Crore). Milestones included flagging off the 2,100th Metro Coach from Bengaluru, completing India’s first indigenously designed Vande Bharat Sleeper Trainset (16 coaches, 180 kmph test speed) at Malda, rolling out the prototype CBTC Driverless Metro Trainset (5RS-DM) for Bengaluru Metro (BMRCL) Phase-2, and securing orders for 600 LHB Passenger Coaches from Integral Coach Factory (ICF), Chennai, alongside 26 Utility Track Vehicles (UTVs) valued at ₹82 Crore.
Table Standalone Financial Performance, Cost Structure, and Cash Flow Profile (FY 2024–25 vs. FY 2025–26)
The compression in DuPont ROE from 10.31% to 5.07% was driven by the net margin falling by 392 bps to 3.39%, compounded by an asset turnover contraction from 0.69x to 0.63x. Increased leverage (2.40x vs. 2.05x) partially offset this decline.
The margin compression was driven by two factors:
* Material Input Consumption: Cost of materials consumed rose +13.94% YoY, consuming 54.73% of Value of Production (+259 bps), driven by input price inflation and supply bottlenecks in imported rail assemblies.
* Long-Cycle Execution Provisions: Note 37 (Other Expenses) absorbed ₹23,257.52 Lakhs in Ind AS 37 Provision for Onerous Contracts (+1,062.81%) on fixed-price transit contracts, alongside ₹6,788.78 Lakhs in Liquidated Damages (LD) and customer penalties (+267.38%). Together, these items represented ₹30,046.30 Lakhs in costs (compared to ₹3,848.00 Lakhs in FY 2024–25), exceeding the net contraction in Standalone PBT (-₹20,634.94 Lakhs).
Working capital tied up ₹33,322.65 Lakhs of operational cash. Trade Receivables Days expanded to 172 days (Trade Receivables rose to ₹227,436.51 Lakhs), with a single public-sector customer accounting for ₹98,057.77 Lakhs (43.11% of net receivables). Contract Assets under Ind AS 115 unbilled work-in-progress locked up an additional ₹71,549.81 Lakhs in Rail & Metro contracts. While BEML recognized ₹67,647.33 Lakhs in percentage-of-completion revenue, only ₹47,398.70 Lakhs met formal billing criteria, generating a ₹20,248.63 Lakhs unbilled gap. The resulting operational Cash Conversion Cycle spans 211.6 to 226.0 days, and 297.3 days when including unbilled Contract Assets.
To fund this cash deficit and its ₹37,875.64 Lakhs CapEx program, BEML increased short-term bank borrowings +33.66% YoY to ₹29,199.14 Lakhs (up 4.8x over 24 months), while Current Financial Liabilities to Banks jumped from ₹8,852.36 Lakhs to ₹38,781.02 Lakhs. ROCE dropped 564 bps to 5.93%, falling below the company's actuarial benchmark discount rate of 7.39% and turning the economic spread negative.
Infrastructure Footprint and Supply Chain Topology
BEML operates across four specialized manufacturing complexes, supplemented by an active greenfield mega-complex currently under construction:
* Bengaluru Complex (Karnataka): Primary center for Rail & Metro and Aerospace. Facilities include a Japanese SNK High-Precision Machining Centre for high-speed bogie structures, a Gantry-type Robotic Laser Welding Workshop for car shells, European EN 15085 welding certification, and a KIADB Aerospace SEZ logistics warehouse (101,176 sq. meters; capitalized at ₹5,126 Lakhs).
* Kolar Gold Fields (KGF) Complex (Karnataka): Focuses on Mining & Construction machinery and Rail Unit-II. Facilities include automated Robotic Welding Cells, an HMV Axle Assembly Shop, and a dedicated 28.35-acre heavy vehicle test track established in 2004. Real estate matters involve ongoing title reconciliation on 114 freehold acres and 1,109 leased acres from Bharat Gold Mines Limited (BGML).
* Mysuru Complex (Karnataka): Manufactures off-highway dump trucks (35T to 205T), heavy diesel powertrains, the prototype 1,500 HP Main Battle Tank engine, and HAL Light Combat Helicopter (LCH) fuselages. Legal title to 302.26 acres remains with BEML pending transfer to BEML Land Assets Limited pursuant to demerger proceedings.
* Palakkad Complex (Kerala): Hub for tactical defence mobility. Produces 6x6, 8x8, 10x10, and 12x12 chassis for Sarvatra bridges, Pinaka and Akash missile launchers, and radar vehicles. Completed a new High Mobility Vehicle (HMV) assembly hangar to support the 270-unit MoD contract.
* BRAHMA Greenfield Complex (Bhopal, Madhya Pradesh): Greenfield transit facility under construction to expand production capacity for high-speed trainsets (Train B28), suburban EMUs, and driverless metro trainsets. The development accounted for Standalone CWIP rising to ₹27,632.71 Lakhs (Building CWIP: ₹18,382.91 Lakhs; Machinery CWIP: ₹9,249.80 Lakhs) and capital contract commitments of ₹16,463.52 Lakhs.
Domestic revenue represented 95.75% of sales (₹397,771 Lakhs across 28 States and 8 Union Territories). Total exports contracted -40.93% YoY to ₹17,650.45 Lakhs (4.25% of turnover), though physical exports rose +78.98% to ₹7,553 Lakhs as deemed exports dropped -60.65% to ₹10,098 Lakhs. Foreign exchange earnings generated ₹412.64 Crore against outgo of ₹390.20 Crore (net surplus of ₹22.44 Crore). BEML maintains an export order backlog of USD 107 Million (USD 119 Million as of July 2026) across 71 to 73 countries, supported by an active ₹2,000 Crore bid pipeline. Global deliveries included dump trucks to Oman, mining chassis to Uzbekistan and the Russian Federation, and an LOI for 48 metro cars for the Congo Phase-1 Metro Project.
Total procurement reached ₹4,489.33 Crore, with 74% sourced domestically and 26% imported. Direct imports accounted for ₹49,477.56 Lakhs (12% of revenue). Micro and Small Enterprises (MSEs) accounted for 31% of domestic sourcing (₹1,391.89 Crore across 2,021 vendors), with 100% of 49,105 MSE invoices settled within the statutory 45-day window. Sourcing through the Government e-Marketplace (GeM) reached ₹2,820.37 Crore. A Board-level Procurement Committee met 33 times to review single-source contracts exceeding ₹200 Lakhs, and ₹5,140.95 Crore in purchase orders were covered by Central Vigilance Commission (CVC) Integrity Pacts.
R&D expenditure expanded +149.6% YoY to ₹25,134.72 Lakhs, representing 5.78% of revenue. Expensed R&D in the P&L totaled ₹21,300.84 Lakhs, while capitalized R&D additions reached ₹3,833.88 Lakhs, including ₹2,119.80 Lakhs in Intangibles Under Development for Train B28 High-Speed Rail know-how. BEML relocated its Central Research Facility (CRF) to the Indian Institute of Science (IISc) campus under a Tripartite Master Research Agreement with the Foundation for Science, Innovation and Development (FSID). In-house developed platforms generated over 91% of total turnover, with foreign technology imports reported as NIL for the past three years. BEML secured 24 IPRs (including 7 patents granted) in FY 2025–26, bringing its active driveline portfolio to 9 granted patents and 2 new filings in 2025.
Indigenisation levels stand at >97% for HMV platforms, >95% for mainline defence platforms, >90% for mining machinery, and >95% for conventional rail rolling stock. However, Metro cars lag at 65% to 66% domestic content, leaving BEML exposed to foreign-sourced electrical propulsion aggregates, traction motors, and CBTC signaling systems.
The corporate workforce contracted -40.1% over the past decade from 8,221 to 4,923 personnel as of March 31, 2026, though FY 2025–26 saw a net addition of 168 employees to support rail execution. Employee costs totaled ₹83,506.35 Lakhs (19.19% of revenue), consisting of ₹56,365.28 Lakhs in salaries and bonus, ₹13,560.39 Lakhs in retirement funds (Gratuity contributions surged +247.0% to ₹5,943.85 Lakhs under updated Labour Code ceilings), and ₹7,508.06 Lakhs in net staff welfare. The workforce comprises 2,061 Executives (41.86%) and 2,862 Workers (58.14%), reflecting an Executive-to-Worker ratio of 1 : 1.39. Permanent staff (4,151 personnel) are 100% unionized, with zero man-days lost to industrial disputes and an LTIFR safety rating of 0.00 across all operations.
Contingent liabilities totaled ₹48,966.05 Lakhs (17.92% of net worth), including ₹22,459.77 Lakhs in disputed statutory demands (with ₹2,907.46 Lakhs deposited under protest), ₹24,213.19 Lakhs in unacknowledged commercial legal claims, and ₹2,240.20 Lakhs in provisional liquidated damages for expired delivery dates. In insolvency matters, the Official Liquidator of defunct joint venture BEML Midwest Limited filed an application under Section 66 of the IBC before NCLT Hyderabad, alleging fraudulent trading and claiming ₹81.51 Crore plus interest against BEML and nominee directors.
HDIN Institutional Verdict
BEML Limited entered FY 2026–27 with strong top-line visibility supported by an order backlog of ₹15,896 Crore, providing a book-to-bill ratio of 3.65x (or 3.83x against executed sales). Management has guided for executable revenue of approximately ₹5,500 Crore in FY 2026–27 with a targeted 150 bps operating margin recovery.
However, forensic analysis reveals a mismatch between order backlog expansion and underlying cash conversion. Rather than representing an asset-light transformation, BEML's operational pivot from Mining & Construction into long-cycle transit projects has lengthened working capital cycles and increased cost risks:
Table Segmental Operating Architecture, Risk Profiles, and Financial Dynamics: Mining & Construction vs. Rail & Metro
1. Competitive Tendering vs. Order Assurance: Unlike specialized single-mandate defence entities, BEML secures 60% of total sales through open competitive bidding (over 73% under competition mode). In the Rail & Metro vertical, public-sector and urban transit entities procure via milestone L1 tenders. The absence of long-term order guarantees from Indian Railways introduces delivery cyclicality, while competition from international OEMs (Alstom, Siemens) and domestic rolling stock peers pressures baseline margins.
2. The Aftermarket Cash Buffer: Profitability remains tied to the Mining & Construction aftermarket, where Spare Parts (₹87,032.91 Lakhs) and Equipment Servicing (₹13,118.59 Lakhs) generated ₹100,151.50 Lakhs (24.11% of product and service sales). This aftermarket income helped buffer cash flow during the coal-sector procurement slowdown. In contrast, the Rail & Metro business lacks an established high-margin aftermarket base, leaving it dependent on lump-sum vehicle deliveries.
3. Long-Cycle Contract Provisions: Fixed-price transit contracts with limited cost-escalation mechanisms leave the company vulnerable to component inflation and execution delays. The ₹300.46 Crore combined impact of Ind AS 37 onerous contract provisions (₹23,257.52 Lakhs) and liquidated damages (₹6,788.78 Lakhs) was the direct cause of the 50.90% pre-tax earnings contraction.
4. Working Capital Expansion: BEML's negative Free Cash Flow to Firm of -₹25,236.45 Lakhs reflects balance sheet cash absorption. Unbilled Contract Assets reached ₹71,549.81 Lakhs, and net Trade Receivables expanded to ₹227,436.51 Lakhs (172 DSO), with 43.11% concentrated in a single public-sector client. Converting these assets into cash depends on completing technical staging and customer site acceptance tests for Bengaluru Metro Phase-2 and Vande Bharat Sleeper trainsets.
5. Governance Constraints: BEML's corporate governance health score of 69/100 reflects compliance gaps in board composition. Chaired by an executive CMD, the Board operated with only 2 Independent Directors out of 9 members on March 31, 2026 (22.2% vs. the statutory 50% threshold mandated by SEBI LODR Regulation 17), with zero Independent Directors from April 17, 2026 until subsequent approvals, and no Woman Independent Director throughout the year. While internal financial controls (IFCoFR) received clean certifications and the CAG issued a "Nil Comments" review, reliance on ministerial appointment cycles creates recurring regulatory compliance liabilities.
Restoring operating profitability toward historical EBITDA margins of 11–13% depends on management's ability to clear vehicle testing bottlenecks, reduce liquidated damage charges on train deliveries, and accelerate customer milestone collections to shorten its 211-to-226-day Cash Conversion Cycle.
Presentation Download & Video Access:
- Presentation Download: Click the PDF download link under 'Related Topics' to access the full institutional presentation of this report.
- Video Link: Click this link to watch the HDIN analyst briefing on YouTube.
About HDIN Research:
HDIN Research is a premier global market intelligence and strategic advisory firm specializing in institutional-grade financial analysis, supply chain audits, and macroeconomic forecasting. Our dedicated sector analysts deliver actionable, data-driven insights tailored for private equity, hedge funds, and corporate strategy teams. Visit us at http://www.hdinresearch.com.
2026 AI Transparency Footer:
"This intelligence report was authored by HDIN Research analysts following a rigorous audit of official corporate filings. AI was utilized for massive-scale data synthesis and structural drafting, ensuring 100% inclusion of reported data points. All strategic insights, financial modeling, and final verdicts were verified by our editorial board to ensure professional accuracy and compliance with 2026 Google Search E-E-A-T standards."
1. BEML Limited [NSE: BEML / BSE: 500048] expanded Standalone Revenue from Operations +8.16% to ₹435,053 Lakhs in FY 2025–26, driven by direct Rail & Metro deliveries (+114.10%) and Defence platforms (+47.42%), which offset a -35.06% contraction in Earth Moving Equipment.
2. Profitability collapsed as Profit Before Tax dropped -50.90% to ₹19,908 Lakhs, impacted by ₹23,257.52 Lakhs in Ind AS 37 Onerous Contract provisions and ₹6,788.78 Lakhs in Liquidated Damages on multi-year transit and rail platform executions.
3. Operating cash flows failed to self-fund an expanded capital expenditure program of ₹37,875.64 Lakhs, pushing Free Cash Flow to Firm (FCFF) to -₹25,236.45 Lakhs due to a ₹56,594.94 Lakhs cash absorption in Trade Receivables (172 DSO) and ₹71,549.81 Lakhs in unbilled Contract Assets.
Figure BEML LIMITED (FY 2025-26) STRATEGIC VALUE ENGINE & HEAVY INDUSTRIAL TRAJECTORY
Segment Dynamics and Margin CompressionBEML Limited operates under a statutory disclosure exemption pursuant to Ministry of Corporate Affairs (MCA) Notification No. S.O.802(E) / Notification No. 1/2/2014-CL-V dated February 23, 2018, which legally exempts defence production entities from segment disclosures under Ind AS 108 (Operating Segments). Consequently, Segment EBIT, Segment Operating Assets, and Segment Capital Employed are not published in standalone financial statement notes.
Operational disaggregation reconstructed from Note 30 (Revenue from Operations), contract disclosures, and statutory annexures confirms a structural shift from Mining & Construction (M&C) toward high-technology mobility platforms:
* Defence & Aerospace: Generated ₹134,362.57 Lakhs in direct product sales (+47.42% YoY), representing 35.0% of total entity turnover (NIC Code 30400). SBU revenue grew +38% YoY, marking an all-time record. Growth was supported by Ministry of Defence (MoD) procurement contracts for 150 units of High Mobility Vehicles (HMV) 6x6 and 120 units of HMV 8x8 (valued at ₹557 Crore), the induction of the Mechanical Minefield Marking Equipment Mk-II (MMME Mk-II), and Bharat Electronics Limited (BEL) orders for Quick Reaction Surface-to-Air Missile (QRSAM) platforms. The vertical carries a legacy drag from ₹280.17 Crore in customer advances received under an October 2011 contract for 204 Armoured Recovery Vehicles (ARV WZT-3), which is being short-closed with downward quantity revisions and price refixation due to foreign aggregate delivery defaults.
* Mining & Construction: Historically the anchor vertical, turnover share dropped to 41.0% (NIC Code 28243). Direct sales of Earth Moving Equipment contracted -35.06% YoY to ₹75,831.31 Lakhs, with overall vertical sales falling -19% YoY due to capital procurement deferrals across state-owned coal mining undertakings. The drop was mitigated by aftermarket sales, including Spare Parts (₹87,032.91 Lakhs) and Equipment Servicing (₹13,118.59 Lakhs). Product milestones included the handover of India’s first indigenous 21 cu.m Electric Rope Shovel (BRS21), development of 190-ton Electric Dump Trucks, the BH35-2EV hauler, and an MoU with TESMEC S.p.A. for continuous surface miners.
* Rail & Metro: Contributed 24.0% of company turnover (NIC Code 30202). Direct product sales rose +114.10% YoY to ₹87,425.89 Lakhs. This segment dominates the closing order backlog, holding ₹11,320 Crore (71.21% of the corporate total of ₹15,896 Crore). Milestones included flagging off the 2,100th Metro Coach from Bengaluru, completing India’s first indigenously designed Vande Bharat Sleeper Trainset (16 coaches, 180 kmph test speed) at Malda, rolling out the prototype CBTC Driverless Metro Trainset (5RS-DM) for Bengaluru Metro (BMRCL) Phase-2, and securing orders for 600 LHB Passenger Coaches from Integral Coach Factory (ICF), Chennai, alongside 26 Utility Track Vehicles (UTVs) valued at ₹82 Crore.
Table Standalone Financial Performance, Cost Structure, and Cash Flow Profile (FY 2024–25 vs. FY 2025–26)
| Standalone Financial Metric | FY 2024–25 | FY 2025–26 | YoY Delta (%) / bps |
| Revenue from Operations (₹ Lakhs) | 402,222.00 | 435,053.00 | +8.16% |
| Value of Production (VoP) (₹ Lakhs) | 390,463.00 | 423,858.00 | +8.55% |
| Cost of Materials Consumed (₹ Lakhs) | (203,600.00) | (231,984.00) | +13.94% |
| Material Cost as % of VoP | 52.14% | 54.73% | +259 bps |
| Employee Benefits Expense (₹ Lakhs) | (82,621.00) | (83,506.00) | +1.07% |
| Employee Costs as % of Revenue | 20.54% | 19.19% | -135 bps |
| Other Expenses (₹ Lakhs) | (67,519.00) | (93,656.00) | +38.71% |
| — Provision for Onerous Contracts | (2,000.11) | (23,257.52) | +1,062.81% |
| — Liquidated Damages & Recoveries | (1,847.89) | (6,788.78) | +267.38% |
| EBITDA (PBDIT) (₹ Lakhs) | 53,098.00 | 32,786.00 | -38.25% |
| EBITDA Margin (%) | 13.20% | 7.54% | -566 bps |
| Operating Profit (PBIT) (₹ Lakhs) | 45,974.00 | 24,447.00 | -46.82% |
| PBIT Margin (%) | 11.43% | 5.62% | -581 bps |
| Profit Before Tax (PBT) (₹ Lakhs) | 40,543.00 | 19,908.00 | -50.90% |
| Profit After Tax (PAT) (₹ Lakhs) | 29,419.00 | 14,750.00 | -49.86% |
| Net Profit Margin (%) | 7.31% | 3.39% | -392 bps |
| Return on Equity (ROE) (%) | 10.31% | 5.07% | -524 bps |
| Return on Capital Employed (ROCE) (%) | 11.57% | 5.93% | -564 bps |
| Asset Turnover Ratio (x) | 0.69x | 0.63x | -8.70% |
| Financial Leverage Multiplier (x) | 2.05x | 2.40x | +17.07% |
| Operating Cash Flow (CFO) (₹ Lakhs) | 8,941.37 | 12,639.19 | +41.36% |
| Gross Capital Expenditure (₹ Lakhs) | (19,336.79) | (37,875.64) | +95.87% |
| Gross Free Cash Flow (FCFF) (₹ Lakhs) | (10,395.42) | (25,236.45) | -142.76% (Deficit Widened) |
| Closing Order Book (₹ Crore) | 14,610.00 | 15,896.00 | +8.80% |
The compression in DuPont ROE from 10.31% to 5.07% was driven by the net margin falling by 392 bps to 3.39%, compounded by an asset turnover contraction from 0.69x to 0.63x. Increased leverage (2.40x vs. 2.05x) partially offset this decline.
The margin compression was driven by two factors:
* Material Input Consumption: Cost of materials consumed rose +13.94% YoY, consuming 54.73% of Value of Production (+259 bps), driven by input price inflation and supply bottlenecks in imported rail assemblies.
* Long-Cycle Execution Provisions: Note 37 (Other Expenses) absorbed ₹23,257.52 Lakhs in Ind AS 37 Provision for Onerous Contracts (+1,062.81%) on fixed-price transit contracts, alongside ₹6,788.78 Lakhs in Liquidated Damages (LD) and customer penalties (+267.38%). Together, these items represented ₹30,046.30 Lakhs in costs (compared to ₹3,848.00 Lakhs in FY 2024–25), exceeding the net contraction in Standalone PBT (-₹20,634.94 Lakhs).
Working capital tied up ₹33,322.65 Lakhs of operational cash. Trade Receivables Days expanded to 172 days (Trade Receivables rose to ₹227,436.51 Lakhs), with a single public-sector customer accounting for ₹98,057.77 Lakhs (43.11% of net receivables). Contract Assets under Ind AS 115 unbilled work-in-progress locked up an additional ₹71,549.81 Lakhs in Rail & Metro contracts. While BEML recognized ₹67,647.33 Lakhs in percentage-of-completion revenue, only ₹47,398.70 Lakhs met formal billing criteria, generating a ₹20,248.63 Lakhs unbilled gap. The resulting operational Cash Conversion Cycle spans 211.6 to 226.0 days, and 297.3 days when including unbilled Contract Assets.
To fund this cash deficit and its ₹37,875.64 Lakhs CapEx program, BEML increased short-term bank borrowings +33.66% YoY to ₹29,199.14 Lakhs (up 4.8x over 24 months), while Current Financial Liabilities to Banks jumped from ₹8,852.36 Lakhs to ₹38,781.02 Lakhs. ROCE dropped 564 bps to 5.93%, falling below the company's actuarial benchmark discount rate of 7.39% and turning the economic spread negative.
Infrastructure Footprint and Supply Chain Topology
BEML operates across four specialized manufacturing complexes, supplemented by an active greenfield mega-complex currently under construction:
* Bengaluru Complex (Karnataka): Primary center for Rail & Metro and Aerospace. Facilities include a Japanese SNK High-Precision Machining Centre for high-speed bogie structures, a Gantry-type Robotic Laser Welding Workshop for car shells, European EN 15085 welding certification, and a KIADB Aerospace SEZ logistics warehouse (101,176 sq. meters; capitalized at ₹5,126 Lakhs).
* Kolar Gold Fields (KGF) Complex (Karnataka): Focuses on Mining & Construction machinery and Rail Unit-II. Facilities include automated Robotic Welding Cells, an HMV Axle Assembly Shop, and a dedicated 28.35-acre heavy vehicle test track established in 2004. Real estate matters involve ongoing title reconciliation on 114 freehold acres and 1,109 leased acres from Bharat Gold Mines Limited (BGML).
* Mysuru Complex (Karnataka): Manufactures off-highway dump trucks (35T to 205T), heavy diesel powertrains, the prototype 1,500 HP Main Battle Tank engine, and HAL Light Combat Helicopter (LCH) fuselages. Legal title to 302.26 acres remains with BEML pending transfer to BEML Land Assets Limited pursuant to demerger proceedings.
* Palakkad Complex (Kerala): Hub for tactical defence mobility. Produces 6x6, 8x8, 10x10, and 12x12 chassis for Sarvatra bridges, Pinaka and Akash missile launchers, and radar vehicles. Completed a new High Mobility Vehicle (HMV) assembly hangar to support the 270-unit MoD contract.
* BRAHMA Greenfield Complex (Bhopal, Madhya Pradesh): Greenfield transit facility under construction to expand production capacity for high-speed trainsets (Train B28), suburban EMUs, and driverless metro trainsets. The development accounted for Standalone CWIP rising to ₹27,632.71 Lakhs (Building CWIP: ₹18,382.91 Lakhs; Machinery CWIP: ₹9,249.80 Lakhs) and capital contract commitments of ₹16,463.52 Lakhs.
Domestic revenue represented 95.75% of sales (₹397,771 Lakhs across 28 States and 8 Union Territories). Total exports contracted -40.93% YoY to ₹17,650.45 Lakhs (4.25% of turnover), though physical exports rose +78.98% to ₹7,553 Lakhs as deemed exports dropped -60.65% to ₹10,098 Lakhs. Foreign exchange earnings generated ₹412.64 Crore against outgo of ₹390.20 Crore (net surplus of ₹22.44 Crore). BEML maintains an export order backlog of USD 107 Million (USD 119 Million as of July 2026) across 71 to 73 countries, supported by an active ₹2,000 Crore bid pipeline. Global deliveries included dump trucks to Oman, mining chassis to Uzbekistan and the Russian Federation, and an LOI for 48 metro cars for the Congo Phase-1 Metro Project.
Total procurement reached ₹4,489.33 Crore, with 74% sourced domestically and 26% imported. Direct imports accounted for ₹49,477.56 Lakhs (12% of revenue). Micro and Small Enterprises (MSEs) accounted for 31% of domestic sourcing (₹1,391.89 Crore across 2,021 vendors), with 100% of 49,105 MSE invoices settled within the statutory 45-day window. Sourcing through the Government e-Marketplace (GeM) reached ₹2,820.37 Crore. A Board-level Procurement Committee met 33 times to review single-source contracts exceeding ₹200 Lakhs, and ₹5,140.95 Crore in purchase orders were covered by Central Vigilance Commission (CVC) Integrity Pacts.
R&D expenditure expanded +149.6% YoY to ₹25,134.72 Lakhs, representing 5.78% of revenue. Expensed R&D in the P&L totaled ₹21,300.84 Lakhs, while capitalized R&D additions reached ₹3,833.88 Lakhs, including ₹2,119.80 Lakhs in Intangibles Under Development for Train B28 High-Speed Rail know-how. BEML relocated its Central Research Facility (CRF) to the Indian Institute of Science (IISc) campus under a Tripartite Master Research Agreement with the Foundation for Science, Innovation and Development (FSID). In-house developed platforms generated over 91% of total turnover, with foreign technology imports reported as NIL for the past three years. BEML secured 24 IPRs (including 7 patents granted) in FY 2025–26, bringing its active driveline portfolio to 9 granted patents and 2 new filings in 2025.
Indigenisation levels stand at >97% for HMV platforms, >95% for mainline defence platforms, >90% for mining machinery, and >95% for conventional rail rolling stock. However, Metro cars lag at 65% to 66% domestic content, leaving BEML exposed to foreign-sourced electrical propulsion aggregates, traction motors, and CBTC signaling systems.
The corporate workforce contracted -40.1% over the past decade from 8,221 to 4,923 personnel as of March 31, 2026, though FY 2025–26 saw a net addition of 168 employees to support rail execution. Employee costs totaled ₹83,506.35 Lakhs (19.19% of revenue), consisting of ₹56,365.28 Lakhs in salaries and bonus, ₹13,560.39 Lakhs in retirement funds (Gratuity contributions surged +247.0% to ₹5,943.85 Lakhs under updated Labour Code ceilings), and ₹7,508.06 Lakhs in net staff welfare. The workforce comprises 2,061 Executives (41.86%) and 2,862 Workers (58.14%), reflecting an Executive-to-Worker ratio of 1 : 1.39. Permanent staff (4,151 personnel) are 100% unionized, with zero man-days lost to industrial disputes and an LTIFR safety rating of 0.00 across all operations.
Contingent liabilities totaled ₹48,966.05 Lakhs (17.92% of net worth), including ₹22,459.77 Lakhs in disputed statutory demands (with ₹2,907.46 Lakhs deposited under protest), ₹24,213.19 Lakhs in unacknowledged commercial legal claims, and ₹2,240.20 Lakhs in provisional liquidated damages for expired delivery dates. In insolvency matters, the Official Liquidator of defunct joint venture BEML Midwest Limited filed an application under Section 66 of the IBC before NCLT Hyderabad, alleging fraudulent trading and claiming ₹81.51 Crore plus interest against BEML and nominee directors.
HDIN Institutional Verdict
BEML Limited entered FY 2026–27 with strong top-line visibility supported by an order backlog of ₹15,896 Crore, providing a book-to-bill ratio of 3.65x (or 3.83x against executed sales). Management has guided for executable revenue of approximately ₹5,500 Crore in FY 2026–27 with a targeted 150 bps operating margin recovery.
However, forensic analysis reveals a mismatch between order backlog expansion and underlying cash conversion. Rather than representing an asset-light transformation, BEML's operational pivot from Mining & Construction into long-cycle transit projects has lengthened working capital cycles and increased cost risks:
Table Segmental Operating Architecture, Risk Profiles, and Financial Dynamics: Mining & Construction vs. Rail & Metro
| Operational / Financial Attribute | Mining & Construction | Rail & Metro Expansion |
| Revenue & Delivery Cycle | Short-cycle procurement; open competitive tenders | Multi-year gestation; percentage-of-completion (POC) milestone delivery |
| Profitability Drivers | High-margin aftermarket spares & Annual Maintenance Contracts (AMCs) | Fixed-price turnkey engineering bids; volume-dependent execution |
| Domestic Indigenisation | >90% local components & domestic sourcing | 65% – 66% local content; higher imported subsystem dependency |
| Balance Sheet Asset Footprint | Standard direct trade receivable billing | Heavy unbilled Work-in-Progress (WIP) and contract asset drag |
| FY26 Operational Realization | Segment turnover contracted -19% YoY | Absorbed ~₹300 Cr in cumulative penalties & onerous contract provisions |
1. Competitive Tendering vs. Order Assurance: Unlike specialized single-mandate defence entities, BEML secures 60% of total sales through open competitive bidding (over 73% under competition mode). In the Rail & Metro vertical, public-sector and urban transit entities procure via milestone L1 tenders. The absence of long-term order guarantees from Indian Railways introduces delivery cyclicality, while competition from international OEMs (Alstom, Siemens) and domestic rolling stock peers pressures baseline margins.
2. The Aftermarket Cash Buffer: Profitability remains tied to the Mining & Construction aftermarket, where Spare Parts (₹87,032.91 Lakhs) and Equipment Servicing (₹13,118.59 Lakhs) generated ₹100,151.50 Lakhs (24.11% of product and service sales). This aftermarket income helped buffer cash flow during the coal-sector procurement slowdown. In contrast, the Rail & Metro business lacks an established high-margin aftermarket base, leaving it dependent on lump-sum vehicle deliveries.
3. Long-Cycle Contract Provisions: Fixed-price transit contracts with limited cost-escalation mechanisms leave the company vulnerable to component inflation and execution delays. The ₹300.46 Crore combined impact of Ind AS 37 onerous contract provisions (₹23,257.52 Lakhs) and liquidated damages (₹6,788.78 Lakhs) was the direct cause of the 50.90% pre-tax earnings contraction.
4. Working Capital Expansion: BEML's negative Free Cash Flow to Firm of -₹25,236.45 Lakhs reflects balance sheet cash absorption. Unbilled Contract Assets reached ₹71,549.81 Lakhs, and net Trade Receivables expanded to ₹227,436.51 Lakhs (172 DSO), with 43.11% concentrated in a single public-sector client. Converting these assets into cash depends on completing technical staging and customer site acceptance tests for Bengaluru Metro Phase-2 and Vande Bharat Sleeper trainsets.
5. Governance Constraints: BEML's corporate governance health score of 69/100 reflects compliance gaps in board composition. Chaired by an executive CMD, the Board operated with only 2 Independent Directors out of 9 members on March 31, 2026 (22.2% vs. the statutory 50% threshold mandated by SEBI LODR Regulation 17), with zero Independent Directors from April 17, 2026 until subsequent approvals, and no Woman Independent Director throughout the year. While internal financial controls (IFCoFR) received clean certifications and the CAG issued a "Nil Comments" review, reliance on ministerial appointment cycles creates recurring regulatory compliance liabilities.
Restoring operating profitability toward historical EBITDA margins of 11–13% depends on management's ability to clear vehicle testing bottlenecks, reduce liquidated damage charges on train deliveries, and accelerate customer milestone collections to shorten its 211-to-226-day Cash Conversion Cycle.
Presentation Download & Video Access:
- Presentation Download: Click the PDF download link under 'Related Topics' to access the full institutional presentation of this report.
- Video Link: Click this link to watch the HDIN analyst briefing on YouTube.
About HDIN Research:
HDIN Research is a premier global market intelligence and strategic advisory firm specializing in institutional-grade financial analysis, supply chain audits, and macroeconomic forecasting. Our dedicated sector analysts deliver actionable, data-driven insights tailored for private equity, hedge funds, and corporate strategy teams. Visit us at http://www.hdinresearch.com.
2026 AI Transparency Footer:
"This intelligence report was authored by HDIN Research analysts following a rigorous audit of official corporate filings. AI was utilized for massive-scale data synthesis and structural drafting, ensuring 100% inclusion of reported data points. All strategic insights, financial modeling, and final verdicts were verified by our editorial board to ensure professional accuracy and compliance with 2026 Google Search E-E-A-T standards."