Renishaw plc: Captive Vertical Integration Drives Record Operating Leverage Near Miskin Hub as 300 bps Margin Expansion Shields £291m Liquidity Moat
Date : 2026-10-12
Reading : 431
HDIN Executive Takeaways
1. Operating leverage contributed 440 bps to operating margin as constant-currency revenue expanded 17.3% to a record £815.8m, propelled by a cyclical upturn in semiconductor position encoders (+29.2% CER) and metal additive manufacturing (+45.8% CER).
2. Vertical integration anchored at the primary Miskin, South Wales fabrication plant and Gloucestershire surface-mount technology hubs insulated intellectual property, yet generated a 220 bps foreign exchange margin drag due to an operational mismatch between 64.3% UK headcount and 96.3% overseas revenue.
3. Institutional governance faces structural concentration as the founding McMurtry and Deer families consolidated a 50.25% controlling stake via Deltam Holdings Limited, alongside non-compliance with the UK Corporate Governance Code regarding the 14-year tenure of Board Chair Sir David Grant.
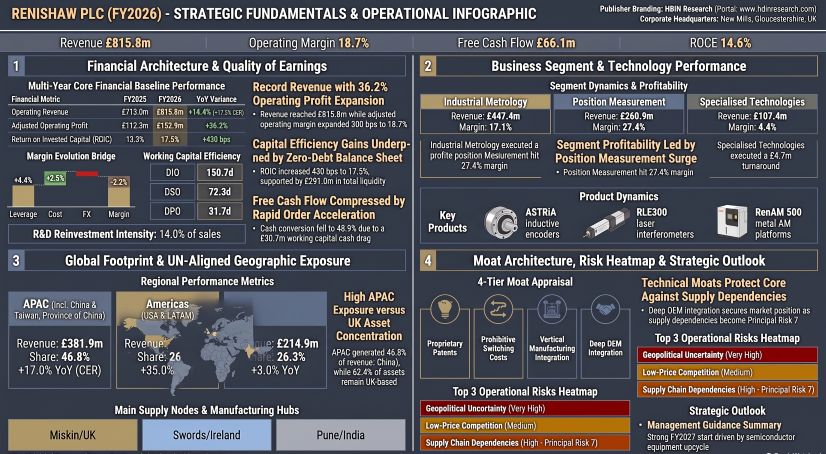
Figure RENISHAW PLC (FY2026)- STRATEGIC FUNDAMENTALS & OPERATIONAL INFOGRAPHIC
Segmental Realities and Margin Progression
Renishaw plc [LSE: RSW] restructured its corporate reporting architecture in FY2026, disbanding its legacy two-segment framework into three market-aligned operating divisions: Industrial Metrology (IM), Position Measurement (PM), and Specialised Technologies (ST). Consolidated revenue grew 14.4% reported (17.3% CER) to £815.8m, while Adjusted Operating Profit expanded 36.2% to £152.9m, lifting Adjusted Operating Margin by 300 bps to 18.7%.
The underlying gross margin (excluding engineering costs and adjusting items) contracted 210 bps from 61.7% to 59.6%. Mix dilution accounted for a 90 bps decline on a constant-currency basis due to an elevated proportion of assembled capital equipment relative to higher-margin consumables, probes, and styli. Foreign currency movements removed a net 120 bps from gross margin. Operating profit outturn absorbed £17.6m in statutory adjusting items, comprising £14.9m in restructuring redundancies under the Cost Reduction Programme, a £2.0m loss of office payment to former Group Finance Director Allen Roberts, and a £0.7m closure charge for the neurological drug delivery division.
Table Consolidated Divisional Performance Breakdown (FY2026)
Revenue generation remains heavily hardware-centric. Under IFRS 15 disaggregation, goods, capital equipment, and installation generated £739.4m (90.6% of turnover), while aftermarket services, maintenance, and software licenses represented £76.4m (9.4%). Operating working capital absorption rose to £31.3m on a statutory basis (£30.7m adjusted), driven by a net trade receivables surge of 25.8% to £161.6m and an inventory build of 14.0% to £181.7m. Consequently, statutory cash flow from operations decreased 25.3% to £110.5m, pulling free cash flow conversion down to 48.9% of statutory operating profit (£66.1m FCF vs £96.2m in FY2025).
Past-due gross receivables rose 41.1% to £39.6m, triggering an expansion in credit loss allowances to £10.5m. Within inventories, Work-in-Progress (WIP) grew 19.4% to £37.8m, with £37.4m (99.0%) concentrated within the UK parent company. This accumulation reflects manufacturing ramps to fulfill committed order backlogs: customer advances increased 164.4% to £14.8m, and unsatisfied performance obligations rose 57.8% to £23.2m. Inventory provisions stood at £27.4m (15.1% of gross holdings), with income statement write-downs moderating to £0.1m.
Return on Invested Capital (ROIC) rose 430 bps to 17.5%, outperforming the Group's 15.0% hurdle rate, as operating profit expanded 36.2% on a flat average invested capital base of £698.1m. Headline ROCE reached 14.6% (14.9% Adjusted). Liquid funds totaled £291.0m (£148.3m cash; £142.6m bank deposits >3 months), leaving the Group with net cash of £277.5m after deducting £2.0m in un-covenanted Japanese borrowings and £11.5m in IFRS 16 lease liabilities. Cash holdings represent 27.7% of total capital employed, imposing an estimated 700 bps return drag. In response, the Board declared an extraordinary 70.0p per share special dividend (£50.9m cash outlay), alongside an ordinary dividend increase of 5.0% to 82.0p (£59.7m), bringing FY2026 total distributions above £110m.
Infrastructure Layout and Regional Moats
Renishaw's competitive positioning relies on a captive vertical manufacturing infrastructure that diverges from the fabless model of industrial automation peers. Mechanical machining is concentrated at its 460,000-square-foot primary manufacturing plant in Miskin, South Wales, which houses multi-axis CNC cells and metal additive manufacturing production lines. Electronics assembly, surface-mount technology (SMT) printed circuit boards, and cleanroom optoelectronics are integrated across Gloucestershire sites at New Mills, Woodchester, and Stonehouse.
Renishaw Global Operational Footprint:
• United Kingdom: Global HQ, Miskin machining hub, Gloucestershire SMT/cleanrooms; £285.6m non-current operating assets (62.4% of Group total), 3,251 employees (64.3% of workforce).
• Swords, Ireland: High-precision machining and European assembly hub operated by Renishaw (Ireland) DAC; holds £5.5m IAS 19 scheme surplus backed by property charges.
• Pune, India: Machining of tool-setting arms and cables at Raisoni Industrial Estate; physical climate exposure managed through multi-site contingency buffers.
• Komenda, Slovenia: 50% JV in RLS Merilna tehnika d.o.o. and captive subsidiary Renishaw Tehnicni Inženiring d.o.o.; custom ASIC development and magnetic encoders.
• Pliezhausen, Germany: Renishaw GmbH distribution center and warehouse undergoing committed logistics expansion.
• Downstream Network: 57 direct commercial offices and Technology Centres spanning 36 countries.
Table Geographical Revenue Disaggregation (FY2026 vs FY2025)
Gross engineering expenditure was £113.9m (14.0% of revenue), consisting of £65.1m in pure R&D and £48.8m in other engineering. Capitalized development additions totaled £9.9m, offset by £4.5m in amortization, £3.8m in project impairments, and £0.9m in project disposals. Net development capitalization had a £0.7m pre-tax P&L impact.
Gross Engineering Accounting Reconciliation (FY2026):
£65.1m Pure Research & Development (New Products/Processes)
+ £48.8m Other Engineering (Maintenance, Regulatory, Compliance)
────────
£113.9m Total Gross Engineering Spend (14.0% of Group Revenue)
- £9.9m Capitalized Internally Generated Development (Note 12)
+ £4.5m Amortization of Capitalized Development
+ £3.8m Impairment of Capitalized Development Projects
+ £0.9m Disposal of Development Intangibles (Drug Delivery)
- £5.2m Research & Development Expenditure Credit (RDEC Deduction)
────────
£107.9m Net Engineering Cost Charged to Statutory Cost of Sales
Technology initiatives centered on semiconductor motion systems and automated shopfloor metrology:
* Position Measurement: Introduced 1.5D optical encoders for advanced packaging and hybrid bonding, alongside the RLE300 laser interferometer for sub-nanometer wafer inspection and lithography. Management notes OEM qualification cycles will defer material revenue realization until FY2028. Commercialized the ASTRiA inductive encoder line under a Minimum Viable Product framework to target harsh robotics and aerospace flight-control applications.
* Industrial Metrology: Deployed the RMP400S multi-purpose probe (touch-trigger, scanning, surface finish) and RUP60 ultrasonic thickness sensor for on-machine CNC verification. On 9 June 2026, Renishaw acquired the remaining 30% of Metrology Software Products Limited (MSP) for £2.2m (£1.96m net cash inflow acquired), integrating NC-Checker and NC-Partmaster into MODUS IM and CARTO ecosystems to capture CNC controller integration value.
* Specialised Technologies: Unveiled TEMPUS technology (enabling laser firing during recoater transit to deliver up to 3x build speeds) and the LIBERTAS software suite for supportless metal additive manufacturing on RenAM 500 platforms.
Operations depend on critical materials, prompting the Board to designate Supply Chain Dependencies as Principal Risk 7 (Velocity: HIGH, Appetite: LOW). Vulnerabilities include rare earths for permanent magnet assemblies across 5-axis heads and RLS rotary scales, raw metals (aluminum and steel represent ~29% of Scope 3 purchased goods emissions), and specialized optoelectronic semiconductors. Mitigation initiatives involve dual-sourcing mandates, multi-site buffer dashboards, transitioning aluminum to 100% recycled content (-20.5% emissions intensity), and engineering redesigns of component-constrained circuits.
HDIN Institutional Verdict
Renishaw’s vertical manufacturing infrastructure delivers operating leverage during industrial upturns (+4.4%pt in FY2026), but its operational structure exhibits persistent macroeconomic and corporate governance friction:
Table HDIN Forensic Risk Matrix
The establishment of Deltam Holdings Limited on 26 November 2025 consolidated 50.25% of voting control (36,575,098 ordinary shares) across the McMurtry family trusts (72.12% interest, positive control over ordinary resolutions) and Deer family entities (27.88% interest, negative veto over special resolutions). Family representation on the Board comprises co-founder John Deer (52-year tenure), Richard McMurtry, Camille Deer (appointed without external search consultants), and observer Ben McMurtry. Independent directors comprise 44% of the Board (excluding the Chair), below the 50% threshold under Code Provision 11.
Furthermore, Chair Sir David Grant has served on the Board for 14 years, creating non-compliance with Code Provision 19 (9-year cap). The Board confirmed compliance under UKLR 6.6.1(13) that business operations remain independent of Deltam Holdings, and independent director appointments remain protected under dual-voting structures.
Long-Term Incentive Plan (PSP) Calibration (Effective FY2027):
• CEO Award Cap: 200% of base salary (£787.5k base) | CFO Award Cap: 175% of base salary (£525k base)
• Holding Period: 3-year performance vesting period + 2-year post-vesting holding lock
• Financial Metrics Weighting (80% Total):
- 50% Adjusted EPS CAGR (Threshold: 3% [0% vest] ➔ Stretch: 13% [100% vest])
- 30% Average ROIC (Threshold: 13% [0% vest] ➔ Stretch: 19% [100% vest])
• Strategic & Commercial KPIs Weighting (20% Total):
- 20% Commercialization of emerging lines (margin ≥20%) & 'One Renishaw' operating metrics
• Non-Financial / ESG: Strictly 0% weighting in LTIP (isolated to 10% in Annual STI)
Balance sheet health remains sound, characterized by zero net debt, a self-sufficient UK pension fund insured by a £127.7m buy-in policy, and the full settlement of in-year restructuring costs. However, management must address two structural risks in FY2027: resolving the implementation pause on its global Microsoft Dynamics 365 ERP deployment, and countering low-price Asian competition across Greater China, which accounts for 27.0% of revenue (£220.1m). While the introduction of the Performance Share Plan at the 2026 AGM aligns executive pay with ROIC and EPS growth, institutional investors must weigh this capital efficiency against the governance influence of the Deltam controlling block.
Presentation Download & Video Access:
- Presentation Download: Click the PDF download link under 'Related Topics' to access the full institutional presentation of this report.
- Video Link: Click this link to watch the HDIN analyst briefing on YouTube.
About HDIN Research:
HDIN Research is a premier global market intelligence and strategic advisory firm specializing in institutional-grade financial analysis, supply chain audits, and macroeconomic forecasting. Our dedicated sector analysts deliver actionable, data-driven insights tailored for private equity, hedge funds, and corporate strategy teams. Visit us at http://www.hdinresearch.com.
2026 AI Transparency Footer:
"This intelligence report was authored by HDIN Research analysts following a rigorous audit of official corporate filings. AI was utilized for massive-scale data synthesis and structural drafting, ensuring 100% inclusion of reported data points. All strategic insights, financial modeling, and final verdicts were verified by our editorial board to ensure professional accuracy and compliance with 2026 Google Search E-E-A-T standards."
1. Operating leverage contributed 440 bps to operating margin as constant-currency revenue expanded 17.3% to a record £815.8m, propelled by a cyclical upturn in semiconductor position encoders (+29.2% CER) and metal additive manufacturing (+45.8% CER).
2. Vertical integration anchored at the primary Miskin, South Wales fabrication plant and Gloucestershire surface-mount technology hubs insulated intellectual property, yet generated a 220 bps foreign exchange margin drag due to an operational mismatch between 64.3% UK headcount and 96.3% overseas revenue.
3. Institutional governance faces structural concentration as the founding McMurtry and Deer families consolidated a 50.25% controlling stake via Deltam Holdings Limited, alongside non-compliance with the UK Corporate Governance Code regarding the 14-year tenure of Board Chair Sir David Grant.
Figure RENISHAW PLC (FY2026)- STRATEGIC FUNDAMENTALS & OPERATIONAL INFOGRAPHIC
Segmental Realities and Margin Progression
Renishaw plc [LSE: RSW] restructured its corporate reporting architecture in FY2026, disbanding its legacy two-segment framework into three market-aligned operating divisions: Industrial Metrology (IM), Position Measurement (PM), and Specialised Technologies (ST). Consolidated revenue grew 14.4% reported (17.3% CER) to £815.8m, while Adjusted Operating Profit expanded 36.2% to £152.9m, lifting Adjusted Operating Margin by 300 bps to 18.7%.
The underlying gross margin (excluding engineering costs and adjusting items) contracted 210 bps from 61.7% to 59.6%. Mix dilution accounted for a 90 bps decline on a constant-currency basis due to an elevated proportion of assembled capital equipment relative to higher-margin consumables, probes, and styli. Foreign currency movements removed a net 120 bps from gross margin. Operating profit outturn absorbed £17.6m in statutory adjusting items, comprising £14.9m in restructuring redundancies under the Cost Reduction Programme, a £2.0m loss of office payment to former Group Finance Director Allen Roberts, and a £0.7m closure charge for the neurological drug delivery division.
Table Consolidated Divisional Performance Breakdown (FY2026)
| Financial Metric | Industrial Metrology (IM) | Position Measurement (PM) | Specialised Technologies (ST) | Consolidated Total |
| Reported Revenue (£m) | £447.4 | £260.9 | £107.4 | £815.8 |
| Reported YoY Growth (%) | +3.9% | +25.8% | +43.1% | +14.4% |
| Constant Exchange Rate (CER) Growth (%) | +6.7% | +29.2% | +45.8% | +17.3% |
| Segment Revenue Share (%) | 54.8% (~55%) | 32.0% (~32%) | 13.2% (~13%) | 100.0% |
| Addressable Market (TAM) | £3.4bn | £2.3bn | £1.3bn | £7.0bn |
| Market Share / TAM Penetration (%) | 13.2% | 11.3% | 8.3% | 11.7% |
| Statutory Operating Profit (£m) | £66.4 | £67.2 | £1.7 | £135.3 |
| Adjusting Items Added (£m) | £10.3 | £4.2 | £3.0 | £17.6 |
| Adjusted Operating Profit (£m) | £76.7 | £71.5 | £4.7 | £152.9 |
| Adjusted Operating Margin (%) | 17.1% | 27.4% | 4.4% | 18.7% |
| Adjusted Margin YoY Change (bps) | -40 bps | +490 bps | +1,760 bps | +300 bps |
| Pure R&D Spend (£m) | £35.9 | £17.9 | £11.3 | £65.1 |
| R&D Intensity (% of Segment Revenue) | 8.0% | 6.9% | 10.5% | 8.0% |
| Depreciation, Amortisation & Impairments (£m) | £20.0 | £18.4 | £4.0 | £42.4 |
| Share of JV Profits (£m) | £0.4 (MSP) | £3.6 (RLS) | £0.0 | £4.0 |
Revenue generation remains heavily hardware-centric. Under IFRS 15 disaggregation, goods, capital equipment, and installation generated £739.4m (90.6% of turnover), while aftermarket services, maintenance, and software licenses represented £76.4m (9.4%). Operating working capital absorption rose to £31.3m on a statutory basis (£30.7m adjusted), driven by a net trade receivables surge of 25.8% to £161.6m and an inventory build of 14.0% to £181.7m. Consequently, statutory cash flow from operations decreased 25.3% to £110.5m, pulling free cash flow conversion down to 48.9% of statutory operating profit (£66.1m FCF vs £96.2m in FY2025).
Past-due gross receivables rose 41.1% to £39.6m, triggering an expansion in credit loss allowances to £10.5m. Within inventories, Work-in-Progress (WIP) grew 19.4% to £37.8m, with £37.4m (99.0%) concentrated within the UK parent company. This accumulation reflects manufacturing ramps to fulfill committed order backlogs: customer advances increased 164.4% to £14.8m, and unsatisfied performance obligations rose 57.8% to £23.2m. Inventory provisions stood at £27.4m (15.1% of gross holdings), with income statement write-downs moderating to £0.1m.
Return on Invested Capital (ROIC) rose 430 bps to 17.5%, outperforming the Group's 15.0% hurdle rate, as operating profit expanded 36.2% on a flat average invested capital base of £698.1m. Headline ROCE reached 14.6% (14.9% Adjusted). Liquid funds totaled £291.0m (£148.3m cash; £142.6m bank deposits >3 months), leaving the Group with net cash of £277.5m after deducting £2.0m in un-covenanted Japanese borrowings and £11.5m in IFRS 16 lease liabilities. Cash holdings represent 27.7% of total capital employed, imposing an estimated 700 bps return drag. In response, the Board declared an extraordinary 70.0p per share special dividend (£50.9m cash outlay), alongside an ordinary dividend increase of 5.0% to 82.0p (£59.7m), bringing FY2026 total distributions above £110m.
Infrastructure Layout and Regional Moats
Renishaw's competitive positioning relies on a captive vertical manufacturing infrastructure that diverges from the fabless model of industrial automation peers. Mechanical machining is concentrated at its 460,000-square-foot primary manufacturing plant in Miskin, South Wales, which houses multi-axis CNC cells and metal additive manufacturing production lines. Electronics assembly, surface-mount technology (SMT) printed circuit boards, and cleanroom optoelectronics are integrated across Gloucestershire sites at New Mills, Woodchester, and Stonehouse.
Renishaw Global Operational Footprint:
• United Kingdom: Global HQ, Miskin machining hub, Gloucestershire SMT/cleanrooms; £285.6m non-current operating assets (62.4% of Group total), 3,251 employees (64.3% of workforce).
• Swords, Ireland: High-precision machining and European assembly hub operated by Renishaw (Ireland) DAC; holds £5.5m IAS 19 scheme surplus backed by property charges.
• Pune, India: Machining of tool-setting arms and cables at Raisoni Industrial Estate; physical climate exposure managed through multi-site contingency buffers.
• Komenda, Slovenia: 50% JV in RLS Merilna tehnika d.o.o. and captive subsidiary Renishaw Tehnicni Inženiring d.o.o.; custom ASIC development and magnetic encoders.
• Pliezhausen, Germany: Renishaw GmbH distribution center and warehouse undergoing committed logistics expansion.
• Downstream Network: 57 direct commercial offices and Technology Centres spanning 36 countries.
Table Geographical Revenue Disaggregation (FY2026 vs FY2025)
| Destination Region | FY2025 (£m) | FY2026 (£m) | FY2026 Share (%) | Reported YoY (%) | CER YoY (%) |
| Asia-Pacific (APAC) | £337.7 | £381.9 | 46.8% | +13.1% | +17.0% |
| — Mainland China | £186.5 | £220.1 | 27.0% | +18.0% | — |
| — Japan | £49.3 | £51.0 | 6.3% | +3.4% | — |
| — Rest of APAC | £101.9 | £110.8 | 13.6% | +8.7% | — |
| Americas | £167.5 | £219.0 | 26.8% | +30.7% | +35.0% |
| — United States | £142.9 | £192.9 | 23.6% | +35.0% | — |
| — Rest of Americas | £24.6 | £26.1 | 3.2% | +6.1% | — |
| EMEA | £207.8 | £214.9 | 26.3% | +3.4% | +3.0% |
| — Germany | £55.7 | £59.3 | 7.3% | +6.4% | — |
| — United Kingdom | £34.0 | £30.0 | 3.7% | -11.9% | — |
| — Rest of EMEA | £118.1 | £125.6 | 15.4% | +6.4% | — |
| Total Group Consolidated | £713.0 | £815.8 | 100.0% | +14.4% | +17.3% |
Gross engineering expenditure was £113.9m (14.0% of revenue), consisting of £65.1m in pure R&D and £48.8m in other engineering. Capitalized development additions totaled £9.9m, offset by £4.5m in amortization, £3.8m in project impairments, and £0.9m in project disposals. Net development capitalization had a £0.7m pre-tax P&L impact.
Gross Engineering Accounting Reconciliation (FY2026):
£65.1m Pure Research & Development (New Products/Processes)
+ £48.8m Other Engineering (Maintenance, Regulatory, Compliance)
────────
£113.9m Total Gross Engineering Spend (14.0% of Group Revenue)
- £9.9m Capitalized Internally Generated Development (Note 12)
+ £4.5m Amortization of Capitalized Development
+ £3.8m Impairment of Capitalized Development Projects
+ £0.9m Disposal of Development Intangibles (Drug Delivery)
- £5.2m Research & Development Expenditure Credit (RDEC Deduction)
────────
£107.9m Net Engineering Cost Charged to Statutory Cost of Sales
Technology initiatives centered on semiconductor motion systems and automated shopfloor metrology:
* Position Measurement: Introduced 1.5D optical encoders for advanced packaging and hybrid bonding, alongside the RLE300 laser interferometer for sub-nanometer wafer inspection and lithography. Management notes OEM qualification cycles will defer material revenue realization until FY2028. Commercialized the ASTRiA inductive encoder line under a Minimum Viable Product framework to target harsh robotics and aerospace flight-control applications.
* Industrial Metrology: Deployed the RMP400S multi-purpose probe (touch-trigger, scanning, surface finish) and RUP60 ultrasonic thickness sensor for on-machine CNC verification. On 9 June 2026, Renishaw acquired the remaining 30% of Metrology Software Products Limited (MSP) for £2.2m (£1.96m net cash inflow acquired), integrating NC-Checker and NC-Partmaster into MODUS IM and CARTO ecosystems to capture CNC controller integration value.
* Specialised Technologies: Unveiled TEMPUS technology (enabling laser firing during recoater transit to deliver up to 3x build speeds) and the LIBERTAS software suite for supportless metal additive manufacturing on RenAM 500 platforms.
Operations depend on critical materials, prompting the Board to designate Supply Chain Dependencies as Principal Risk 7 (Velocity: HIGH, Appetite: LOW). Vulnerabilities include rare earths for permanent magnet assemblies across 5-axis heads and RLS rotary scales, raw metals (aluminum and steel represent ~29% of Scope 3 purchased goods emissions), and specialized optoelectronic semiconductors. Mitigation initiatives involve dual-sourcing mandates, multi-site buffer dashboards, transitioning aluminum to 100% recycled content (-20.5% emissions intensity), and engineering redesigns of component-constrained circuits.
HDIN Institutional Verdict
Renishaw’s vertical manufacturing infrastructure delivers operating leverage during industrial upturns (+4.4%pt in FY2026), but its operational structure exhibits persistent macroeconomic and corporate governance friction:
Table HDIN Forensic Risk Matrix
| Risk Factor & Category | Risk Velocity | Risk Appetite | Forensic Finding & Audit Observation |
| 1. Deltam Ownership Concentration | STRUCTURAL | N/A | Dual-veto bicameral family lock; independent NEDs below 50%. |
| 2. Board Chair Tenure Code Non-Compliance | GOVERNANCE | LOW | 14-year tenure breaches UK Corporate Governance Code Provision 19. |
| 3. Currency Asymmetry Exposure | MEDIUM | BALANCED | -2.2%pt margin drag; 96.3% non-UK sales vs. 64.3% UK staff. |
| 4. Working Capital Cash Absorption | HIGH | LOW | Statutory FCF fell 31.3% as trade receivables expanded 25.8%. |
| 5. Asian Low-Cost Threat (Principal Risk 2) | MEDIUM | BALANCED | Pricing pressure in Mainland China (£220.1m, 27.0% of Group sales). |
The establishment of Deltam Holdings Limited on 26 November 2025 consolidated 50.25% of voting control (36,575,098 ordinary shares) across the McMurtry family trusts (72.12% interest, positive control over ordinary resolutions) and Deer family entities (27.88% interest, negative veto over special resolutions). Family representation on the Board comprises co-founder John Deer (52-year tenure), Richard McMurtry, Camille Deer (appointed without external search consultants), and observer Ben McMurtry. Independent directors comprise 44% of the Board (excluding the Chair), below the 50% threshold under Code Provision 11.
Furthermore, Chair Sir David Grant has served on the Board for 14 years, creating non-compliance with Code Provision 19 (9-year cap). The Board confirmed compliance under UKLR 6.6.1(13) that business operations remain independent of Deltam Holdings, and independent director appointments remain protected under dual-voting structures.
Long-Term Incentive Plan (PSP) Calibration (Effective FY2027):
• CEO Award Cap: 200% of base salary (£787.5k base) | CFO Award Cap: 175% of base salary (£525k base)
• Holding Period: 3-year performance vesting period + 2-year post-vesting holding lock
• Financial Metrics Weighting (80% Total):
- 50% Adjusted EPS CAGR (Threshold: 3% [0% vest] ➔ Stretch: 13% [100% vest])
- 30% Average ROIC (Threshold: 13% [0% vest] ➔ Stretch: 19% [100% vest])
• Strategic & Commercial KPIs Weighting (20% Total):
- 20% Commercialization of emerging lines (margin ≥20%) & 'One Renishaw' operating metrics
• Non-Financial / ESG: Strictly 0% weighting in LTIP (isolated to 10% in Annual STI)
Balance sheet health remains sound, characterized by zero net debt, a self-sufficient UK pension fund insured by a £127.7m buy-in policy, and the full settlement of in-year restructuring costs. However, management must address two structural risks in FY2027: resolving the implementation pause on its global Microsoft Dynamics 365 ERP deployment, and countering low-price Asian competition across Greater China, which accounts for 27.0% of revenue (£220.1m). While the introduction of the Performance Share Plan at the 2026 AGM aligns executive pay with ROIC and EPS growth, institutional investors must weigh this capital efficiency against the governance influence of the Deltam controlling block.
Presentation Download & Video Access:
- Presentation Download: Click the PDF download link under 'Related Topics' to access the full institutional presentation of this report.
- Video Link: Click this link to watch the HDIN analyst briefing on YouTube.
About HDIN Research:
HDIN Research is a premier global market intelligence and strategic advisory firm specializing in institutional-grade financial analysis, supply chain audits, and macroeconomic forecasting. Our dedicated sector analysts deliver actionable, data-driven insights tailored for private equity, hedge funds, and corporate strategy teams. Visit us at http://www.hdinresearch.com.
2026 AI Transparency Footer:
"This intelligence report was authored by HDIN Research analysts following a rigorous audit of official corporate filings. AI was utilized for massive-scale data synthesis and structural drafting, ensuring 100% inclusion of reported data points. All strategic insights, financial modeling, and final verdicts were verified by our editorial board to ensure professional accuracy and compliance with 2026 Google Search E-E-A-T standards."