Smiths Group plc: Portfolio Divestments Realize £3.3bn Enterprise Value as Net Cash Position Reaches £1,747m
Date : 2026-10-15
Reading : 236
HDIN Executive Takeaways
1. Smiths Group plc [LSE: SMIN] executed a major balance sheet transformation in FY2026, divesting Smiths Interconnect (£1.3bn EV) and Smiths Detection (£2.0bn EV) to generate £3,245m in net investing cash proceeds and swing its capital structure from net debt of £462m to net cash of £1,747m.
2. The Group reallocated capital toward secular niches through the £165m acquisition of Chicago-based DRC Heat Transfer, while eliminating 100% of UK defined benefit pension liabilities via bulk buy-ins and buy-outs and initiating the formal divestiture of its £153m US asbestos liability.
3. Headline operating margin across continuing operations (John Crane and Flex-Tek) reached 20.6% (+20 bps organically), although statutory operating cash flows contracted 47.1% to £241m due to £149m in working capital absorption and £182m in non-headline restructuring, deal, and legacy litigation costs.
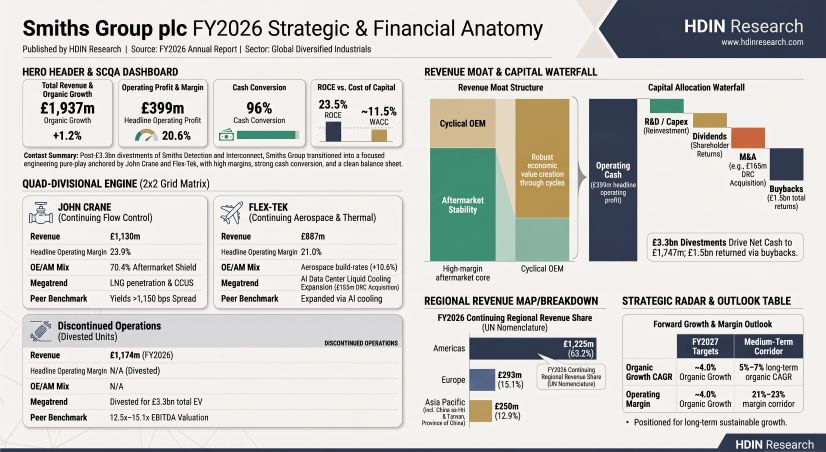
Figure Smiths Group plc FY2026 Strategic & Financial Anatomy
Segmental Realities and Margin Dynamics
During FY2026, Smiths Group plc transitioned its corporate reporting to present Smiths Detection and Smiths Interconnect as discontinued operations under IFRS 5 following their sale for an aggregate enterprise value (EV) of £3.34bn (Detection to CVC Capital Partners for £2.0bn EV at 12.5x FY2025 EBITDA; Interconnect to Molex for £1.3bn EV at 15.1x FY2025 EBITDA; plus £40m agreed EV across Flex-Tek non-core units).
Continuing operations—comprising John Crane (58% of continuing revenue) and Flex-Tek (42%)—delivered reported top-line revenue of £1,937m, up 2.1% YoY (FY2025: £1,898m represented). Organic revenue growth decelerated to +1.2% (FY2025: +3.8%; FY2024: +5.9%), weighed down by an estimated £20m top-line deferral in John Crane due to Middle East site access closures and a 3.6% organic contraction in Flex-Tek Construction caused by depressed US housing starts (-0.8%) and building permits (-2.1%).
Headline operating profit (HOP) for continuing operations expanded 2.7% reported and 1.9% organically to £399m (FY2025: £388m). However, continuing statutory operating profit fell 16.6% to £289m (FY2025: £347m) after absorbing £110m in non-headline charges, including a £57m settlement loss on the Smiths Industries Pension Scheme (SIPS) buy-in, £27m in Acceleration Plan restructuring, and £33m of acquired intangibles amortisation, partially offset by a £30m non-headline actuarial credit on John Crane, Inc. (JCI) asbestos provisions.
Total Group statutory profit after tax reached £1,972m (FY2025: £292m), reflecting £1,690m in statutory pre-tax gains on disposal (£877m from Interconnect, £807m from Detection, £6m from Flex-Tek units). Both major divestments qualified under the UK Substantial Shareholdings Exemption (SSE), exempting £1,684m from UK corporation tax and yielding a statutory effective tax rate (ETR) on discontinued operations of 2.8% and a Total Group statutory ETR of 6.7%.
Table Continuing Operations Revenue & Margin Bridge (FY2026)
Table Divisional Financial Performance, End-Market Disaggregation, and Margin Structure
Flex-Tek's headline operating margin compressed 60 bps reported (and 80 bps organically) to 21.0%, reflecting adverse operational gearing in US residential construction, project completions, and the unhedged drag of US tariffs on UK-manufactured engineering products.
Across cash conversion, Total Group statutory cash generated from operations fell 36.8% YoY from £592m to £374m, and net cash inflow from operating activities dropped 47.1% to £241m (FY2025: £456m). This divergence from statutory net income (£1,972m) was driven by:
* Non-cash/investing disposal gains of £(1,690)m.
* A £149m operating working capital and provision cash outflow: £(57)m inventory build (buffer stocks for aerospace ramps and energy delivery), £(77)m receivables drag (extended DSO of 72.0 days; 78.2 days adjusted for £33m off-balance-sheet non-recourse factoring), £(27)m provision spend, offset by +£12m payables.
* A £182m non-headline operating cash leakage, including £109m in disposal/separation costs paid, £27m restructuring payments, and £12m in net asbestos defense cash spend.
Continuing operations converted 96% of HOP into headline operating cash flow (£384m). Reported Free Cash Flow (FCF) reached £256m (FY2025: £336m), after £67m in organic capex, £41m in principal lease payments, £8m in surplus asset sales, and adding back £114m in discontinued separation fees and £2m in foundation funding.
Infrastructure Layout and Regional Moats
On 1 April 2026, the Group deployed £165m in cash to acquire 100% of DRC Heat Transfer, securing an entry multiple of ~1.81x annualized sales (£91m pro-forma run-rate; £35.5m revenue and £12m operating profit delivered during four months of ownership). The transaction fair value allocated £109m to identifiable intangible assets (including £91m to customer relationships amortized over 15 years and order backlog) and £32m to goodwill, assuming £4m in IFRS 16 lease liabilities. DRC positions Flex-Tek within high-density AI data center liquid cooling architectures—an addressable market expanding at a 20% to 25% CAGR through 2030.
Under IAS 36 testing at 31 May 2026, consolidated goodwill stood at £417m (down 58.9% from £1,016m in FY2025 following the derecognition of £623m from Detection and £252m from Interconnect). John Crane carries £129m in goodwill, while Flex-Tek holds £288m (including £32m from DRC). Pre-tax discount hurdles were elevated to 14.0% for John Crane (FY2025: 11.8%) and 15.4% for Flex-Tek (FY2025: 13.6%), alongside long-term GDP terminal growth rates of 2.5% and 2.0%, respectively. Both Cash-Generating Units (CGUs) demonstrated substantial impairment headroom, leading the Audit & Risk Committee to de-escalate goodwill recoverability as a key source of estimation uncertainty.
Continuing RD&E expenditure totaled £64m (3.3% of continuing sales), with John Crane deploying £41m (3.6% of sales) in customer-specific application engineering and £17m (1.5% of sales) in cash R&D. The Group maintained an asset-light R&D accounting standard: 100% of continuing RD&E was expensed directly through the P&L, leaving £0m in capitalized development intangibles on the balance sheet post-separation (derecognizing £209m in historical gross development costs and £72m NBV sold with Detection). Tangible PP&E capex of £39m represented a 1.77x coverage ratio over PP&E depreciation (£22m), reflecting the commissioning of nine extreme-condition test rigs for high-pressure hydrogen and supercritical CO2 seals.
Balance Sheet De-Risking and Capital Architecture
The £3,245m in net cash proceeds received from disposals permitted a fundamental balance sheet de-risking:
All funded UK defined benefit pension obligations have been neutralized. The TI Group Pension Scheme (TIGPS) converted existing buy-ins into complete buy-outs in May 2026, derecognizing £778m of scheme liabilities and matching assets. The SIPS completed a £760m full-scheme bulk annuity buy-in with M&G in July 2026, covering all 17,000 members with £1,102m in qualifying annuity policies. Management applied an asset ceiling restriction of £(59)m, bringing the balance sheet carrying surplus to £nil and capping forward FY2027 global DB pension cash contributions at ≤£10m.
Simultaneously, the Board launched a formal marketing process to divest the legacy US asbestos liabilities of John Crane, Inc. If executed, the transaction will eliminate the £153m balance sheet liability (which carries a 10-year undiscounted gross exposure of £187m and an annual cash burn of £12m) and insulate continuing operations from US mass-tort litigation.
The Group's capital allocation hierarchy returned £988m to shareholders in FY2026 via £839m in share buybacks and £149m in ordinary dividends (+5.4% YoY DPS increase to 48.5p; 2.8x headline dividend cover; 75th consecutive year of payment). Total buybacks authorized across FY2025–FY2026 reached £3.0bn (£500m general, £1.0bn Interconnect, £1.5bn Detection), reducing the issued share count by 10.3% in FY2026 to 295,807,098 shares. Year-end Parent Company distributable reserves stood at £1,989m.
HDIN Institutional Verdict
The operational and accounting evidence from FY2026 confirms that Smiths Group plc has largely addressed its historic conglomerate discount. The disposals of Detection and Interconnect monetized cyclical assets at peak multiples (12.5x and 15.1x EBITDA) while shielding £1,684m in capital gains from corporate tax. The resulting entity operates with £1,747m in net cash, an undrawn \$800m revolving credit facility to May 2030, and zero public bond maturities until the February 2027 €650m Eurobond (which will be settled via cash on hand).
However, institutional investors should weigh several operational considerations heading into FY2027:
1. Cash Conversion Drag: Continuing operations generated £256m in Free Cash Flow (a 45% headline operating profit conversion rate), dampened by working capital absorption (£149m) and separation costs (£109m). With transaction friction dropping away in FY2027, working capital velocity—specifically DSO (72.0 days reported; 78.2 days factoring-adjusted) and finished buffer inventory (£164m)—must normalize to achieve management's guided "low 90%s" cash conversion target.
2. End-Market Phasing Constraints: Guided FY2027 organic growth of ~4.0% relies on an H2 recovery in John Crane following Middle East disruptions and an H1 conversion of Flex-Tek's ~65% aerospace order backlog. Weakness in US residential construction (-3.6% organic in FY2026) remains an active headwind to Flex-Tek margins, which contracted 80 bps organically.
3. Governance and Capital Deployment Scrutiny: The removal of ROCE hurdles from executive LTIP grants (replaced by EPS at 40%, Relative TSR at 20%, Revenue at 20%, and FCF at 20%) alongside the removal of operating margin gates from the AIP increases the burden on the Board's Investment Committee to deploy the remaining cash windfall. The DRC transaction indicates accretive M&A discipline, but reinvesting net cash while sustaining a Continuing ROCE of 23.5% (against an 11.0%–12.0% post-tax WACC) remains critical to sustaining a pure-play multiple re-rating.
Presentation Download & Video Access:
- Presentation Download: Click the PDF download link under 'Related Topics' to access the full institutional presentation of this report.
- Video Link: Click this link to watch the HDIN analyst briefing on YouTube.
About HDIN Research:
HDIN Research is a premier global market intelligence and strategic advisory firm specializing in institutional-grade financial analysis, supply chain audits, and macroeconomic forecasting. Our dedicated sector analysts deliver actionable, data-driven insights tailored for private equity, hedge funds, and corporate strategy teams. Visit us at http://www.hdinresearch.com.
2026 AI Transparency Footer:
"This intelligence report was authored by HDIN Research analysts following a rigorous audit of official corporate filings. AI was utilized for massive-scale data synthesis and structural drafting, ensuring 100% inclusion of reported data points. All strategic insights, financial modeling, and final verdicts were verified by our editorial board to ensure professional accuracy and compliance with 2026 Google Search E-E-A-T standards."
1. Smiths Group plc [LSE: SMIN] executed a major balance sheet transformation in FY2026, divesting Smiths Interconnect (£1.3bn EV) and Smiths Detection (£2.0bn EV) to generate £3,245m in net investing cash proceeds and swing its capital structure from net debt of £462m to net cash of £1,747m.
2. The Group reallocated capital toward secular niches through the £165m acquisition of Chicago-based DRC Heat Transfer, while eliminating 100% of UK defined benefit pension liabilities via bulk buy-ins and buy-outs and initiating the formal divestiture of its £153m US asbestos liability.
3. Headline operating margin across continuing operations (John Crane and Flex-Tek) reached 20.6% (+20 bps organically), although statutory operating cash flows contracted 47.1% to £241m due to £149m in working capital absorption and £182m in non-headline restructuring, deal, and legacy litigation costs.
Figure Smiths Group plc FY2026 Strategic & Financial Anatomy
Segmental Realities and Margin Dynamics
During FY2026, Smiths Group plc transitioned its corporate reporting to present Smiths Detection and Smiths Interconnect as discontinued operations under IFRS 5 following their sale for an aggregate enterprise value (EV) of £3.34bn (Detection to CVC Capital Partners for £2.0bn EV at 12.5x FY2025 EBITDA; Interconnect to Molex for £1.3bn EV at 15.1x FY2025 EBITDA; plus £40m agreed EV across Flex-Tek non-core units).
Continuing operations—comprising John Crane (58% of continuing revenue) and Flex-Tek (42%)—delivered reported top-line revenue of £1,937m, up 2.1% YoY (FY2025: £1,898m represented). Organic revenue growth decelerated to +1.2% (FY2025: +3.8%; FY2024: +5.9%), weighed down by an estimated £20m top-line deferral in John Crane due to Middle East site access closures and a 3.6% organic contraction in Flex-Tek Construction caused by depressed US housing starts (-0.8%) and building permits (-2.1%).
Headline operating profit (HOP) for continuing operations expanded 2.7% reported and 1.9% organically to £399m (FY2025: £388m). However, continuing statutory operating profit fell 16.6% to £289m (FY2025: £347m) after absorbing £110m in non-headline charges, including a £57m settlement loss on the Smiths Industries Pension Scheme (SIPS) buy-in, £27m in Acceleration Plan restructuring, and £33m of acquired intangibles amortisation, partially offset by a £30m non-headline actuarial credit on John Crane, Inc. (JCI) asbestos provisions.
Total Group statutory profit after tax reached £1,972m (FY2025: £292m), reflecting £1,690m in statutory pre-tax gains on disposal (£877m from Interconnect, £807m from Detection, £6m from Flex-Tek units). Both major divestments qualified under the UK Substantial Shareholdings Exemption (SSE), exempting £1,684m from UK corporation tax and yielding a statutory effective tax rate (ETR) on discontinued operations of 2.8% and a Total Group statutory ETR of 6.7%.
Table Continuing Operations Revenue & Margin Bridge (FY2026)
| Bridge Dimension | FY2025 Base | Foreign Exchange Drag | M&A Scope Net Impact | Organic Performance | FY2026 Reported | Variance / Net Shift |
| Continuing Revenue (£m) | £1,898m | -£32m | +£49m | +£22m (+1.2%) | £1,937m | +£39m (+2.1%) |
| Headline Operating Margin (%) | 20.5% | -20 bps | +10 bps | +20 bps (+1.9% profit) | 20.6% | +10 bps |
Table Divisional Financial Performance, End-Market Disaggregation, and Margin Structure
| Segment / Financial Dimension | FY2025 (Represented) | FY2026 Reported | Organic Change (%) | Reported Change (%) | Headline Margin (FY26) |
| John Crane | £1,115m | £1,130m | +2.3% | +1.4% | 23.9% (+10 bps) |
| — Original Equipment (OE) | £322m | £334m | +4.1% | +3.2% | — |
| — Aftermarket (AM) / Services | £793m | £796m | +1.9% | +0.7% | 70.4% mix share |
| — Energy End-Market (Total) | £702m | £712m | +2.5% | +1.3% | — |
| — Industrial End-Market (Total) | £413m | £418m | +2.0% | +1.5% | — |
| Flex-Tek | £783m | £807m | (0.4)% | +3.1% | 21.0% ((60) bps) |
| — Aerospace (Fluid Conveyance) | £210m | £227m | +10.6% | +8.1% | — |
| — Construction (HVAC / Ducting) | £371m | £359m | (3.6)% | (3.3)% | — |
| — Thermal Solutions (Heating) | £202m | £221m | (6.2)% | +9.4% | (incl. DRC £35.5m) |
| Central Costs | £(46)m | £(41)m | (10.7)% | (11.2)% | — |
| Total Continuing Operations | £1,898m | £1,937m | +1.2% | +2.1% | 20.6% (+10 bps) |
| Discontinued Operations | £1,438m | £1,220m | +8.8% | (15.2)% | — |
| Total Group Consolidated | £3,336m | £3,157m | — | (5.4)% | — |
Flex-Tek's headline operating margin compressed 60 bps reported (and 80 bps organically) to 21.0%, reflecting adverse operational gearing in US residential construction, project completions, and the unhedged drag of US tariffs on UK-manufactured engineering products.
Across cash conversion, Total Group statutory cash generated from operations fell 36.8% YoY from £592m to £374m, and net cash inflow from operating activities dropped 47.1% to £241m (FY2025: £456m). This divergence from statutory net income (£1,972m) was driven by:
* Non-cash/investing disposal gains of £(1,690)m.
* A £149m operating working capital and provision cash outflow: £(57)m inventory build (buffer stocks for aerospace ramps and energy delivery), £(77)m receivables drag (extended DSO of 72.0 days; 78.2 days adjusted for £33m off-balance-sheet non-recourse factoring), £(27)m provision spend, offset by +£12m payables.
* A £182m non-headline operating cash leakage, including £109m in disposal/separation costs paid, £27m restructuring payments, and £12m in net asbestos defense cash spend.
Continuing operations converted 96% of HOP into headline operating cash flow (£384m). Reported Free Cash Flow (FCF) reached £256m (FY2025: £336m), after £67m in organic capex, £41m in principal lease payments, £8m in surplus asset sales, and adding back £114m in discontinued separation fees and £2m in foundation funding.
Infrastructure Layout and Regional Moats
On 1 April 2026, the Group deployed £165m in cash to acquire 100% of DRC Heat Transfer, securing an entry multiple of ~1.81x annualized sales (£91m pro-forma run-rate; £35.5m revenue and £12m operating profit delivered during four months of ownership). The transaction fair value allocated £109m to identifiable intangible assets (including £91m to customer relationships amortized over 15 years and order backlog) and £32m to goodwill, assuming £4m in IFRS 16 lease liabilities. DRC positions Flex-Tek within high-density AI data center liquid cooling architectures—an addressable market expanding at a 20% to 25% CAGR through 2030.
Under IAS 36 testing at 31 May 2026, consolidated goodwill stood at £417m (down 58.9% from £1,016m in FY2025 following the derecognition of £623m from Detection and £252m from Interconnect). John Crane carries £129m in goodwill, while Flex-Tek holds £288m (including £32m from DRC). Pre-tax discount hurdles were elevated to 14.0% for John Crane (FY2025: 11.8%) and 15.4% for Flex-Tek (FY2025: 13.6%), alongside long-term GDP terminal growth rates of 2.5% and 2.0%, respectively. Both Cash-Generating Units (CGUs) demonstrated substantial impairment headroom, leading the Audit & Risk Committee to de-escalate goodwill recoverability as a key source of estimation uncertainty.
Continuing RD&E expenditure totaled £64m (3.3% of continuing sales), with John Crane deploying £41m (3.6% of sales) in customer-specific application engineering and £17m (1.5% of sales) in cash R&D. The Group maintained an asset-light R&D accounting standard: 100% of continuing RD&E was expensed directly through the P&L, leaving £0m in capitalized development intangibles on the balance sheet post-separation (derecognizing £209m in historical gross development costs and £72m NBV sold with Detection). Tangible PP&E capex of £39m represented a 1.77x coverage ratio over PP&E depreciation (£22m), reflecting the commissioning of nine extreme-condition test rigs for high-pressure hydrogen and supercritical CO2 seals.
Balance Sheet De-Risking and Capital Architecture
The £3,245m in net cash proceeds received from disposals permitted a fundamental balance sheet de-risking:
| Balance Sheet / Tail-Risk Metric | FY2025 Baseline | FY2026 Reported | Accounting & Structural Trajectory |
| Consolidated Cash & Liquid Deposits | £195m | £2,956m | £2,856m held in deposits maturing ≤ 3 months |
| Gross Borrowings & Leases | £(667)m | £(1,204)m | Includes €650m 2027 bond (£554m) & €650m 2033 bond (£537m) |
| Net Cash / (Net Debt) | £(462)m | +£1,747m | Leverage shifted to (3.9)x EBITDA; target policy ≤ 2.0x |
| UK Defined Benefit Pension Status | +£128m (Surplus) | £nil | 100% de-risked: TIGPS bought out; SIPS £760m bulk annuity buy-in |
| Funded Schemes Net Deficit | +£114m | £(4)m | Net position across closed US (£2m surplus) and overseas plans |
| Unfunded Pension & Healthcare | £(82)m | £(44)m | £38m derecognized via Detection/Interconnect sales |
| JCI US Asbestos Discounted Provision | £191m | £153m | £187m undiscounted; 10-yr Bates White actuarial model; sales process active |
| Titeflex CSST Subrogation Provision | £20m | £29m | £63m undiscounted (£22m post-tax); lightning puncture claims |
| Uncertain Tax Positions (Audits) | £35m | £16m | HMRC and IRS international transfer pricing exposure |
All funded UK defined benefit pension obligations have been neutralized. The TI Group Pension Scheme (TIGPS) converted existing buy-ins into complete buy-outs in May 2026, derecognizing £778m of scheme liabilities and matching assets. The SIPS completed a £760m full-scheme bulk annuity buy-in with M&G in July 2026, covering all 17,000 members with £1,102m in qualifying annuity policies. Management applied an asset ceiling restriction of £(59)m, bringing the balance sheet carrying surplus to £nil and capping forward FY2027 global DB pension cash contributions at ≤£10m.
Simultaneously, the Board launched a formal marketing process to divest the legacy US asbestos liabilities of John Crane, Inc. If executed, the transaction will eliminate the £153m balance sheet liability (which carries a 10-year undiscounted gross exposure of £187m and an annual cash burn of £12m) and insulate continuing operations from US mass-tort litigation.
The Group's capital allocation hierarchy returned £988m to shareholders in FY2026 via £839m in share buybacks and £149m in ordinary dividends (+5.4% YoY DPS increase to 48.5p; 2.8x headline dividend cover; 75th consecutive year of payment). Total buybacks authorized across FY2025–FY2026 reached £3.0bn (£500m general, £1.0bn Interconnect, £1.5bn Detection), reducing the issued share count by 10.3% in FY2026 to 295,807,098 shares. Year-end Parent Company distributable reserves stood at £1,989m.
HDIN Institutional Verdict
The operational and accounting evidence from FY2026 confirms that Smiths Group plc has largely addressed its historic conglomerate discount. The disposals of Detection and Interconnect monetized cyclical assets at peak multiples (12.5x and 15.1x EBITDA) while shielding £1,684m in capital gains from corporate tax. The resulting entity operates with £1,747m in net cash, an undrawn \$800m revolving credit facility to May 2030, and zero public bond maturities until the February 2027 €650m Eurobond (which will be settled via cash on hand).
However, institutional investors should weigh several operational considerations heading into FY2027:
1. Cash Conversion Drag: Continuing operations generated £256m in Free Cash Flow (a 45% headline operating profit conversion rate), dampened by working capital absorption (£149m) and separation costs (£109m). With transaction friction dropping away in FY2027, working capital velocity—specifically DSO (72.0 days reported; 78.2 days factoring-adjusted) and finished buffer inventory (£164m)—must normalize to achieve management's guided "low 90%s" cash conversion target.
2. End-Market Phasing Constraints: Guided FY2027 organic growth of ~4.0% relies on an H2 recovery in John Crane following Middle East disruptions and an H1 conversion of Flex-Tek's ~65% aerospace order backlog. Weakness in US residential construction (-3.6% organic in FY2026) remains an active headwind to Flex-Tek margins, which contracted 80 bps organically.
3. Governance and Capital Deployment Scrutiny: The removal of ROCE hurdles from executive LTIP grants (replaced by EPS at 40%, Relative TSR at 20%, Revenue at 20%, and FCF at 20%) alongside the removal of operating margin gates from the AIP increases the burden on the Board's Investment Committee to deploy the remaining cash windfall. The DRC transaction indicates accretive M&A discipline, but reinvesting net cash while sustaining a Continuing ROCE of 23.5% (against an 11.0%–12.0% post-tax WACC) remains critical to sustaining a pure-play multiple re-rating.
Presentation Download & Video Access:
- Presentation Download: Click the PDF download link under 'Related Topics' to access the full institutional presentation of this report.
- Video Link: Click this link to watch the HDIN analyst briefing on YouTube.
About HDIN Research:
HDIN Research is a premier global market intelligence and strategic advisory firm specializing in institutional-grade financial analysis, supply chain audits, and macroeconomic forecasting. Our dedicated sector analysts deliver actionable, data-driven insights tailored for private equity, hedge funds, and corporate strategy teams. Visit us at http://www.hdinresearch.com.
2026 AI Transparency Footer:
"This intelligence report was authored by HDIN Research analysts following a rigorous audit of official corporate filings. AI was utilized for massive-scale data synthesis and structural drafting, ensuring 100% inclusion of reported data points. All strategic insights, financial modeling, and final verdicts were verified by our editorial board to ensure professional accuracy and compliance with 2026 Google Search E-E-A-T standards."