Arxis, Inc.: Balance Sheet De-leveraging Follows IPO as Gross Margin Reaches 51.84%
1. Arxis, Inc. deployed $946.0 million of $1,227.8 million net Initial Public Offering proceeds to prepay floating debt, moving H1 2026 GAAP net income to $48.4 million as gross margin expanded 565 basis points to 51.84%.
2. Sole-source positioning spans >11,000 platform positions across 78 global production facilities, buffering program cancellations while exposing production schedules to aerospace qualification lead times and Department of War cybersecurity mandates.
3. Financial sponsor Arcline Investment Management, L.P. commands 98.70% voting control via 20-vote Class B common stock, retaining capital extraction rights via an 85% Tax Receivable Agreement and uncapped advisory reimbursements.
Figure Arxis Inc Form S-1 Executive Synthesis & Financial Engine Audit
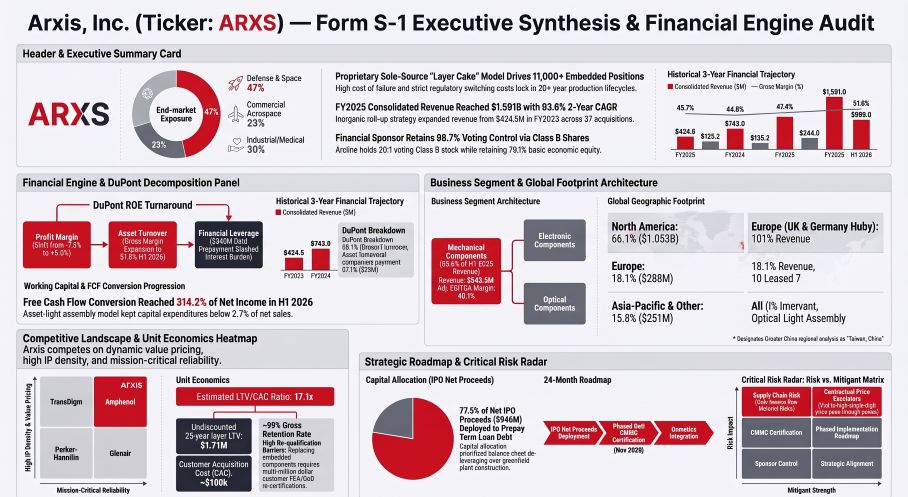 Segmental Operating Architecture and De-leveraging Dynamics
Arxis, Inc. [NASDAQ: ARXS] operates as a decentralized, engineer-led precision manufacturing conglomerate comprising 48 operating business units and 52 customer-facing commercial brands. The enterprise coordinates sales incentives, cross-selling initiatives, and pricing discipline through its proprietary operating management system, Arxis EDGE (Empower Data-Driven Growth and Execution). Across its operating history, the business has scaled through programmatic mergers and acquisitions (37 acquisitions executed since 2019), culminating in its April 16, 2026 corporate reorganization and Initial Public Offering, followed by the August 17, 2026 stock-funded acquisition of Omnetics Connector Corporation for ~$770 million.
Operating results are reported through two reportable segments under ASC 280: Electronic Components (29 business units) and Mechanical Components (19 business units). Segment cost of revenue excludes depreciation and amortization.
Table CONSOLIDATED & SEGMENTAL FINANCIAL PERFORMANCE AUDIT (FY 2023 – H1 2026)
(in thousands of USD, except percentages and basis points)
|
Segment / Financial Metric |
FY2023 |
FY2024 |
FY2025 |
2-Year CAGR |
H1 2025 |
H1 2026 |
YoY Change |
|---|---|---|---|---|---|---|---|
|
Electronic Components Segment |
|||||||
|
Revenue |
$229,842 |
$360,515 |
$704,997 |
+75.14% |
$347,957 |
$416,116 |
+19.59% |
|
Segment Share of Total Revenue |
54.15% |
48.52% |
44.31% |
-984 bps |
44.58% |
43.36% |
-122 bps |
|
Segment Cost of Revenue |
$116,112 |
$173,413 |
$335,217 |
+69.91% |
$160,516 |
$190,710 |
+18.81% |
|
Segment Adjusted EBITDA |
$66,044 |
$129,044 |
$274,995 |
+104.05% |
$144,384 |
$180,954 |
+25.33% |
|
Segment Adjusted EBITDA Margin |
28.73% |
35.80% |
39.01% |
+1,028 bps |
41.50% |
43.49% |
+199 bps |
|
Capital Expenditures |
$7,035 |
$12,595 |
$11,247 |
+26.44% |
$4,391 |
$8,695 |
+98.02% |
|
Mechanical Components Segment |
|||||||
|
Revenue |
$194,653 |
$382,477 |
$886,023 |
+113.35% |
$432,566 |
$543,470 |
+25.64% |
|
Segment Share of Total Revenue |
45.85% |
51.48% |
55.69% |
+984 bps |
55.42% |
56.64% |
+122 bps |
|
Segment Cost of Revenue |
$103,767 |
$195,500 |
$437,067 |
+105.17% |
$218,760 |
$246,250 |
+12.57% |
|
Segment Adjusted EBITDA |
$59,134 |
$114,955 |
$296,309 |
+123.85% |
$143,415 |
$218,150 |
+52.11% |
|
Segment Adjusted EBITDA Margin |
30.38% |
30.05% |
33.44% |
+306 bps |
33.15% |
40.14% |
+699 bps |
|
Capital Expenditures |
$5,467 |
$16,294 |
$31,178 |
+138.80% |
$17,004 |
$13,595 |
-20.05% |
|
Consolidated GAAP Financial Results |
|||||||
|
Total Revenue |
$424,495 |
$742,992 |
$1,591,020 |
+93.60% |
$780,523 |
$959,586 |
+22.94% |
|
Cost of Revenue |
$230,478 |
$411,853 |
$836,304 |
+90.50% |
$419,998 |
$462,142 |
+10.03% |
|
Gross Profit |
$194,017 |
$331,139 |
$754,716 |
+97.23% |
$360,525 |
$497,444 |
+37.98% |
|
Gross Margin |
45.71% |
44.57% |
47.44% |
+173 bps |
46.19% |
51.84% |
+565 bps |
|
Selling, General and Administrative (SG&A) Expenses |
$88,227 |
$156,143 |
$339,081 |
+96.04% |
$149,204 |
$281,950 |
+88.97% |
|
Amortization of Intangible Assets |
$51,469 |
$72,405 |
$138,937 |
+64.30% |
$68,263 |
$72,307 |
+5.92% |
|
Operating Income (EBIT) |
$54,321 |
$102,591 |
$276,698 |
+125.71% |
$143,058 |
$143,187 |
+0.09% |
|
Operating Margin |
12.80% |
13.81% |
17.39% |
+459 bps |
18.33% |
14.92% |
-341 bps |
|
Net Interest Expense |
$124,496 |
$161,052 |
$220,316 |
+33.03% |
$125,616 |
$83,385 |
-33.62% |
|
Other Income, Net |
$(845) |
$(5,461) |
$(5,932) |
NM |
$(4,818) |
$(7,796) |
+61.81% |
|
Income (Loss) Before Taxes |
$(69,330) |
$(53,000) |
$62,314 |
Turnaround |
$22,260 |
$67,598 |
+203.68% |
|
Income Tax Expense (Benefit) |
$(9,412) |
$2,472 |
$16,325 |
NM |
$55,840 |
$19,198 |
-65.62% |
|
GAAP Net Income (Loss) |
$(59,918) |
$(55,472) |
$45,989 |
Turnaround |
$(33,580) |
$48,400 |
Turnaround |
|
GAAP Net Margin |
-14.12% |
-7.47% |
2.89% |
+1,701 bps |
-4.30% |
5.04% |
+934 bps |
|
Total Segment Adjusted EBITDA |
$125,178 |
$243,999 |
$571,304 |
+113.63% |
$287,799 |
$399,104 |
+38.67% |
|
Consolidated Adjusted EBITDA |
$125,178 |
$243,999 |
$571,304 |
+113.63% |
$287,799 |
$386,693 |
+34.36% |
|
Consolidated Adjusted EBITDA Margin |
29.49% |
32.84% |
35.91% |
+642 bps |
36.87% |
40.30% |
+343 bps |
|
Total Capital Expenditures |
$12,502 |
$28,889 |
$42,425 |
+84.21% |
$21,395 |
$22,290 |
+4.18% |
The top-line revenue expansion of 93.60% compound annual growth between FY 2023 and FY 2025 was largely inorganic: acquired entities contributed $724.0 million (85.38%) of the $848.0 million net revenue increase in FY 2025. Consolidated organic revenue growth registered at 8.9% in FY 2025 and accelerated to 19.1% in H1 2026.
By end market, organic growth reflects programmatic pricing power:
* Defense and Space: In FY 2025, revenue expanded via a mid-single-digit percentage increase in pricing combined with a mid-single-digit percentage increase in volume.
* Commercial Aerospace: In FY 2025, revenue was driven primarily by a high-single-digit percentage increase in pricing under aerospace original equipment manufacturer (OEM) production ramp-ups.
* H1 2026 Consolidated Operations: Organic volume expanded in the low-teens percentage range across all end markets, while net realized pricing achieved a mid-single-digit percentage increase.
Revenue recognition under ASC 606 is bifurcated between point-in-time catalog or custom component shipments and over-time cost-to-cost recognized projects:
* Point-in-Time Recognition (Shipment/Delivery): Generated $274,330 thousand (64.62%) in FY 2023, $525,407 thousand (70.71%) in FY 2024, $1,213,014 thousand (76.24%) in FY 2025, $613,404 thousand (78.59%) in H1 2025, and $756,125 thousand (78.80%) in H1 2026.
* Over-Time Recognition (Cost-to-Cost Milestone Billing): Accounted for $150,165 thousand (35.38%) in FY 2023, $217,585 thousand (29.29%) in FY 2024, $378,006 thousand (23.76%) in FY 2025, $167,119 thousand (21.41%) in H1 2025, and $203,461 thousand (21.20%) in H1 2026.
Table GAAP NET INCOME TO CONSOLIDATED ADJUSTED EBITDA RECONCILIATION (in thousands of USD)
|
Reconciliation Line Item |
FY2023 |
FY2024 |
FY2025 |
H1 2025 |
H1 2026 |
Analytical Classification |
|---|---|---|---|---|---|---|
|
GAAP Net Income (Loss) |
$(59,918) |
$(55,472) |
$45,989 |
$(33,580) |
$48,400 |
Reported statutory net income |
|
Interest Expense, Net |
$124,496 |
$161,052 |
$220,316 |
$125,616 |
$83,385 |
Variable-rate debt servicing |
|
Income Tax Expense (Benefit) |
$(9,412) |
$2,472 |
$16,325 |
$55,840 |
$19,198 |
Statutory tax provisions |
|
Depreciation and Amortization |
$65,324 |
$96,303 |
$200,111 |
$98,093 |
$103,556 |
Purchase price allocation (PPA) step-up and property, plant and equipment (PP&E) charges |
|
Acquisition and Integration Costs |
$2,900 |
$25,788 |
$23,313 |
$19,963 |
$1,437 |
Inventory step-up and legal costs |
|
Restructuring Costs |
$1,402 |
$14,108 |
$3,772 |
$2,475 |
$270 |
Facility consolidation |
|
Transaction and Deal Expenses |
$643 |
$3,054 |
$12,695 |
$4,955 |
$9,044 |
Target due diligence fees |
|
Share-Based Compensation |
$0 |
$406 |
$27,259 |
$4,536 |
$109,591 |
Pre-IPO unit modification |
|
Refinancing Costs |
$190 |
$335 |
$0 |
$0 |
$0 |
Syndicated debt restructuring |
|
Other Non-Recurring Adjustments |
$(447) |
$(4,047) |
$21,524 |
$9,901 |
$11,812 |
Tax receivable agreement (TRA) liability and Jacksonville-related items |
|
Consolidated Adjusted EBITDA |
$125,178 |
$243,999 |
$571,304 |
$287,799 |
$386,693 |
Non-GAAP management metric |
Share-based compensation expanded to $109,591 thousand in H1 2026, comprising $73.1 million in immediate incremental charge following the conversion of unvested partnership units into time-based restricted stock awards (RSAs) and restricted stock units (RSUs), $7.5 million in employer payroll taxes on vested units, and $5.4 million associated with the convertible common stock granted to Arcline Arxis Advisory I, L.P. (carrying an aggregate grant-date fair value of $129.68 million, with $124.3 million unrecognized across a 4.8-year horizon). Additional unrecognized compensation on unvested employee RSAs and RSUs totals $239.0 million across 10,414,021 units.
Under classical three-stage DuPont analysis:
* Net Profit Margin transitioned from -7.47% in FY 2024 to +2.89% in FY 2025 (+1,036 bps).
* Asset Turnover increased from 0.1176x in FY 2024 to 0.2412x in FY 2025 (+105.10%), reflecting full-year consolidation of acquired entities (Connector TopCo, Ovation TopCo).
* Financial Leverage remained flat at 2.122x (FY 2024) and 2.111x (FY 2025).
* Return on Equity (ROE) swung from -1.86% in FY 2024 (-3.04% on average equity) to +1.47% in FY 2025 (+1.51% on average equity), an increase of 333 bps driven entirely by operating leverage and fixed-cost absorption.
Free cash flow (FCF) reached $208,771 thousand in FY 2025 (454.0% FCF conversion of GAAP Net Income) and $152,064 thousand in H1 2026 (314.2% conversion):
* Operating Cash Flows: $(7,919) thousand in FY 2023, $70,946 thousand in FY 2024, $251,196 thousand in FY 2025, $68,605 thousand in H1 2025, and $174,354 thousand in H1 2026.
* Capital Expenditures: $12,502 thousand (2.95% of sales) in FY 2023, $28,889 thousand (3.89%) in FY 2024, $42,425 thousand (2.67%) in FY 2025, $21,395 thousand (2.74%) in H1 2025, and $22,290 thousand (2.32%) in H1 2026.
* Cash Flows from Investing: $(12,187) thousand (FY 2023), $(35,276) thousand (FY 2024), $(192,824) thousand (FY 2025), $(171,847) thousand (H1 2025), and $(207,960) thousand (H1 2026).
* Cash Flows from Financing: $15,580 thousand (FY 2023), $62,228 thousand (FY 2024), $78,106 thousand (FY 2025), $171,281 thousand (H1 2025), and $279,224 thousand (H1 2026).
In the April 2026 IPO, the company sold 46,575,000 shares of Class A common stock at $28.00 per share, raising $1,304.1 million gross ($1,220.6 million net of underwriting discounts and direct expenses of $83.5 million; $1,227.8 million total cash net proceeds). Management allocated $946.0 million (77.50%) to prepay the 2025 Term Loan and $274.6 million (22.50%) to general corporate purposes and working capital.
Total liquidity headroom as of June 30, 2026 stands at $1,092.0 million, comprising $494.7 million in cash, an undrawn $396.3 million revolving credit facility, and an undrawn $201.0 million delayed draw term loan (DDTL, expiring February 26, 2027). Net interest expense fell 33.62% YoY in H1 2026 to $83,385 thousand (with Q2 2026 quarterly interest run-rate of $39.4 million, annualizing to ~$155M–$160M versus $220.3 million in FY 2025). Variable debt stands at $1,733.7 million; every 100 basis point increase in Term SOFR generates an incremental $17.34 million in annual interest charges.
Infrastructure Layout, Sourcing Architecture and Operational Buffer
Arxis, Inc. operates 78 manufacturing facilities globally (61 domestic and 17 international), encompassing 57 leased sites (73.08%) and 21 owned sites (26.92%). The company employs approximately 6,800 individuals (73% domestic, with 11% of the global base represented by works councils or collective bargaining agreements in Germany, the Czech Republic, and Canada).
Table GEOGRAPHIC REVENUE & ASSET MATRIX (in thousands of USD, UN Classification Compliant)
|
Geographic Entity / Area |
FY2023 Revenue |
FY2024 Revenue |
FY2025 Revenue |
2-Year CAGR |
FY2025 Revenue Share |
Long-Lived Assets (Dec. 31, 2025) |
|---|---|---|---|---|---|---|
|
United States of America |
$316,558 |
$539,618 |
$1,051,442 |
+82.26% |
66.09% |
$384,469 (83.11%) |
|
Europe (UK, Germany, Czech Republic) |
$45,759 |
$103,840 |
$287,401 |
+150.60% |
18.06% |
$73,343 (15.85%) |
|
All Other Countries / Regions |
$62,178 |
$99,534 |
$252,177 |
+101.39% |
15.85% |
$4,768 (1.04%) |
|
Total Consolidated Revenue / Long-Lived Assets |
$424,495 |
$742,992 |
$1,591,020 |
+93.60% |
100.00% |
$462,580 (100.00%) |
Includes Asian manufacturing operations. Commercial exposure in Greater China encompassing Taiwan territory is designated
as Taiwan, China (or Taiwan, Province of China) in compliance with United Nations geographic standards.
International customer revenue expanded from 25.43% in FY 2023 to 33.91% in FY 2025, reaching 36.68% in H1 2026. Overseas operations transact in functional currencies including the British Pound (GBP) and the Euro (EUR). Cross-border shipments are governed by the Arms Export Control Act, International Traffic in Arms Regulations (ITAR), and Export Administration Regulations (EAR), enforced by the Bureau of Industry and Security (BIS) and the Office of Foreign Assets Control (OFAC).
Table PROPERTY, PLANT & EQUIPMENT AND OPERATING LEASE SCHEDULE (in thousands of USD)
|
Balance Sheet Asset Caption |
December 31, 2024 ($ thousands) |
December 31, 2025 ($ thousands) |
June 30, 2026 ($ thousands) |
Operational Role |
|---|---|---|---|---|
|
Land |
$61,286 |
$63,336 |
$66,719 |
Freehold land across 21 owned sites |
|
Buildings |
$101,612 |
$109,479 |
$125,811 |
Manufacturing and executive facilities |
|
Leasehold Improvements |
$32,761 |
$38,658 |
$38,342 |
Improvements to 57 leased properties |
|
Machinery, Equipment & Fixtures |
$245,365 |
$284,833 |
$303,160 |
CNC tooling and cleanrooms |
|
Construction in Progress |
$24,961 |
$22,321 |
$19,294 |
Active production-line expansions |
|
Gross Property, Plant & Equipment |
$465,985 |
$518,627 |
$553,326 |
Total gross capital assets |
|
Accumulated Depreciation |
$(62,166) |
$(120,698) |
$(147,841) |
Includes $31.2 million in depreciation and amortization (D&A) expense in H1 2026 |
|
Net Property, Plant & Equipment |
$403,819 |
$397,929 |
$405,485 |
Reported as 5.79% of total assets |
|
Operating Lease Right-of-Use (ROU) Assets |
$53,656 |
$64,651 |
$64,951 |
Capitalized operating lease assets under ASC 842 |
Operating leases maintain initial terms of 3 to 10 years with a weighted-average remaining duration of 6.2 years. Total undiscounted lease payment obligations stand at $85.5 million, with annual operating cash lease payments of approximately $15.8 million.
Production is anchored at primary corporate and specialized sites:
* Corporate Headquarters & Campus: Located at 1332 Blue Hills Avenue, Bloomfield, CT 06002 (acquired via the Kaman/Ovation acquisition). The property is subject to ongoing remediation under the Connecticut Transfer Act, carrying an undiscounted accrued environmental liability of $4.95 million as of June 30, 2026.
* Former Moosup Facility: Located in Moosup, Connecticut; divested in 2014. Following the bankruptcy of the acquiring party, Arxis assumed primary remediation liability with the Connecticut Department of Energy and Environmental Protection (CDEEP), maintaining an accrued environmental remediation reserve of $44.9 million ($45.0 million total reserve). Total combined corporate environmental accruals stand at $51.0 million as of June 30, 2026.
* Oldham Seals Manufacturing Hub: Located in Chichester, England; dedicated to specialized naval elastomeric polymer compounds and submarine seals.
* Omnetics Connector Facility: Located in Minneapolis, Minnesota; focused on Micro-D, Nano-D, and subminiature electronic packaging.
Operating working capital enforces a lean raw-material inventory policy. The raw material stock of $137.3 million supports semi-annual cost of revenue of $462.1 million (under 1.8 months of annualized COGS coverage). Primary critical raw materials include:
1. Rare and Precious Metals: Gold, platinum, and palladium used in high-reliability electronic plating, microelectronic packaging, and hermetic seals.
2. Specialty Alloys: Beryllium-copper, specialized aerospace aluminum, high-grade titanium, and alloy steels for precision flight bearings and flexible drive shafts.
3. Engineered Polymers and Fluoropolymer Resins: Specialized elastomers for naval marine applications, engine fire seals, and radar-absorbing materials.
4. Conflict Minerals: Tantalum, tin, gold, and tungsten (3TG) compliant with Dodd-Frank Section 1502.
5. Per- and Polyfluoroalkyl Substances (PFAS): Chemicals embedded in aerospace seals and lubricants subject to environmental restriction timelines.
Because Arxis utilizes sole-source suppliers for specific specialty alloys and polymer compounds, supplier disruption cannot be resolved via off-the-shelf catalog substitution. Qualifying alternative suppliers requires metallurgical lot validation, first-article inspections (FAI), and recertification across Federal Aviation Administration (FAA), Department of Defense / Department of War (DoD/DoW), European Union Aviation Safety Agency (EASA), and Tier 1 prime engineering standards, a process requiring 6 to 12+ months.
During H1 2026, $19.64 million of revenue was recognized from beginning contract liability balances ($15.08 million in H1 2025; $20.68 million in FY 2025). The company applies the ASC 606 practical expedient exempting disclosure of remaining performance obligations (RPO) on contracts with an original expected duration of one year or less. Production orders are fulfilled, shipped, and billed within 12 months of purchase order issuance.
No single customer accounted for 10% or more of consolidated revenue in FY 2023, FY 2024, or FY 2025, nor did any single debtor represent 10% or more of accounts receivable as of December 31, 2024 or December 31, 2025. In contrast, predecessor entity Connector TopCo, L.P. derived 35% of FY 2023 revenue and 36% of revenue in the period ended September 29, 2024 from its three largest customers prior to roll-up integration.
HDIN Institutional Verdict
Arxis, Inc.’s operational franchise delivers cash conversion and gross margins exceeding 50%, yet institutional analysis reveals clear divergences between operational cash generation and public shareholder protections.
The corporate governance architecture concentrates power with financial sponsor Arcline Investment Management, L.P.:
Table CAPITALIZATION & TOTAL VOTING POWER ALLOCATION (as of September 30, 2026)
| Shareholder Group / Filing Entity | Class A Shares | Class B Shares | Total Basic Shares | Economic (%) | Voting Power (%) |
| Arcline Investment Management Funds | — | 340,676,783 | 340,676,783 | 79.10% | 98.70% |
| • Engineered Polymer Series LP | — | 71,544,608 | 71,544,608 | 16.61% | 20.73% |
| • Hawkeye Series LP | — | 36,689,297 | 36,689,297 | 8.52% | 10.63% |
| • Ovation Series LP | — | 122,746,592 | 122,746,592 | 28.50% | 35.56% |
| • Connector Series LP | — | 91,338,254 | 91,338,254 | 21.21% | 26.46% |
| • Arcline Double Eagle Master Fund-A | — | 18,358,032 | 18,358,032 | 4.26% | 5.32% |
| • Arcline Arxis Advisory I, L.P. | 1 share (Convert.) | — | 1 share | Participating | 1.25% (as-conv.) |
| Public Float (IPO Shareholders) | 46,575,000 | — | 46,575,000 | 10.81% | 0.67% |
| Omnetics Selling Stockholders | 13,351,964 | — | 13,351,964 | 3.10% | 0.19% |
| • Gerald W. Simonson Revocable Trust | 6,627,543 | — | 6,627,543 | 1.54% | 0.10% |
| • Gulf Shore Club LLC | 1,845,083 | — | 1,845,083 | 0.43% | 0.03% |
| • White Willow Bay LLC | 1,845,083 | — | 1,845,083 | 0.43% | 0.03% |
| • The Gary E. Jacobs Revocable Trust | 1,241,922 | — | 1,241,922 | 0.29% | 0.02% |
| • Other Omnetics Sellers (13 parties) | 1,792,333 | — | 1,792,333 | 0.42% | 0.03% |
| Executive Officers & Directors (9) | 5,564,010 | — | 5,564,010 | 1.29% | <0.10% |
| • Kevin Perhamus (President, CEO, Dir.) | 3,573,133 | — | 3,573,133 | 0.83% | <0.10% |
| • Ross Sealfon (President, Mechanical) | 1,102,804 | — | 1,102,804 | 0.26% | <0.10% |
| • Azad Badakhsh (CFO & Treasurer) | 403,865 | — | 403,865 | 0.09% | <0.10% |
| • Jason Roth (President, Electronics) | 395,514 | — | 395,514 | 0.09% | <0.10% |
| • Jennifer Allen (Chief Legal Officer) | 53,694 | — | 53,694 | 0.01% | <0.10% |
| • Stephen Oetgen (Independent Director) | 25,000 | — | 25,000 | <0.01% | <0.10% |
| • Patrick Allen (Audit Committee Chair) | 10,000 | — | 10,000 | <0.01% | <0.10% |
| • Rajeev Amara (Chair) & Shyam Ravindran | — | — | — | — | — |
| Other Pre-IPO / Employee Converted Base | 24,554,125 | — | 24,554,125 | 5.70% | 0.36% |
| Total Basic Common Stock Outstanding | 90,045,099 | 340,676,783 | 430,721,882 | 100.00% | 100.00% |
Public Class A common stock carries 1 vote per share (90,045,099 votes), while Sponsor-held Class B common stock carries 20 votes per share (6,813,535,660 votes), yielding a total voting base of 6,903,580,759 votes. Arcline controls 98.696% of total voting power. The Certificate of Incorporation authorizes 3,500,000,000 Class A shares, 3,500,000,000 Class B shares, 500,000,000 Class C non-voting shares (0 issued), 1 Convertible Common share, and 500,000,000 preferred shares ($0.01 par value).
Mandatory sunset conversion of Class B into Class A occurs only when two cumulative conditions are met:
1. Outstanding Class B shares represent less than 10% of total common stock outstanding; and
2. The Sponsor and permitted transferees cease to retain at least 35% of the Class B shares issued at IPO closing (requiring liquidation of >65% of Arcline's 340.68 million share position).
Secondary float liquidity faces systematic supply pressure:
* Immediate Float Injection (October 2026): The Form S-1 registration registers 13,351,964 Class A shares for Omnetics selling stockholders. Of these, 4,422,677 shares (33.12%) are unlocked immediately, expanding the public tradable float from 46,575,000 shares to 50,997,677 shares (+9.49% supply increase) with zero proceeds to Arxis.
* Tranche 2 Lock-Up Expiration (April 17, 2027): Unlocks 4,464,643 Omnetics shares alongside the initial vesting cliff for management RSAs/RSUs (+3.0M to 4.0M Class A shares).
* Tranche 3 Final Resale Release (May 15, 2028): Releases the remaining 4,464,644 Omnetics shares (bringing cumulative Omnetics float expansion to 13,351,964 shares, or +28.67% of initial IPO float).
* Tranche 4 Sponsor Window (April 17, 2031): Arcline founder 5-year lock-up lapses across 340,676,783 Class B shares; Sponsor Convertible Stock becomes exercisable for up to 5,250,614 shares subject to a $56.00 stock price hurdle (2.0x IPO price; instrument forfeits if trading remains below $42.00, or 1.5x, for 75% of days through April 17, 2037). Outside founder lock-ups, Sponsor entities hold demand registration rights allowing up to two non-shelf offerings and six shelf takedowns per 12-month period.
Corporate governance exhibits controlled company insulation:
* Board Independence: The board contains five directors, of whom only two (Patrick Allen, former CFO of Collins Aerospace; Stephen Oetgen, former GC/CFO of Golden Gate Capital) are independent under Nasdaq standards (40% independence). Oetgen previously overlapped at Golden Gate Capital when Arcline founders Rajeev Amara (Chairman) and Shyam Ravindran served there.
* Committee Exemptions: Arxis utilizes Nasdaq controlled company exemptions to operate without a majority independent board, an independent Compensation Committee (Rajeev Amara, Chair; Shyam Ravindran, Stephen Oetgen), or an independent Nominating Committee (Shyam Ravindran, Chair; Rajeev Amara, Stephen Oetgen). The Audit Committee comprises Patrick Allen (Chair), Stephen Oetgen, and Sponsor CEO Rajeev Amara.
* Sponsor Negative Consents: Under the Stockholders Agreement, as long as Arcline retains 10% voting power, it holds contractual veto rights over 20 corporate actions, including M&A, hiring/firing the CEO or CFO, debt incurrence, annual budgets, dividend distributions, and auditor appointments.
* Elimination of Performance Vesting: During the reorganization, historical executive incentive units (MIUs, GPUs, VCBs)—which previously required capital return hurdles on sponsor exit—had all operational performance conditions removed. Units converted into RSAs and RSUs subject strictly to time-based service vesting:
* Kevin Perhamus (CEO): 1,939,464 vested Class A shares; 1,357,902 unvested RSAs.
* Ross Sealfon (President, Mechanical): 315,237 vested Class A shares; 775,067 unvested RSAs.
* Azad Badakhsh (CFO): 36,784 vested Class A shares; 331,081 unvested RSAs.
* Jason Roth (President, Electronics): 68,196 vested Class A shares; 204,591 unvested RSAs.
* Jennifer Allen (CLO): 0 vested Class A shares; 53,694 unvested RSAs.
Forensic examination of related-party transactions and cash-leakage mechanisms confirms capital extraction by the controlling sponsor:
1. Convertible-Related Tax Receivable Agreement (TRA): Obligates Arxis to pay Arcline Arxis Advisory I, L.P. 85% of cash tax savings realized from compensation deductions under Section 83(b). As of June 30, 2026, Arxis accrued a $13.28 million ($13,277,000) liability. Payments are due 125 days post-tax filing. If deductions are disallowed by the IRS, Arcline faces no clawback or refund obligation.
2. Advisory and Expense Allocations: Historical advisory fees paid to Arcline totaled $1.45 million in FY 2023 ($1.83M incurred), $0.89 million in FY 2024 ($2.16M incurred), $3.49 million in FY 2025 ($3.17M incurred; $0.58M unpaid at year-end), $1.99 million in H1 2025 ($1.83M incurred), and $1.40 million in H1 2026 ($1.67M incurred). The post-IPO agreement replaces percentage fees with uncapped expense reimbursements covering Arcline Value Creation Group charges and allocable payroll, bonuses, and benefits for Arcline personnel.
3. Pre-IPO Executive Debt Cancellation: Notes receivable from corporate officers totaled $28.5 million as of December 31, 2025. During H1 2026, $22.5 million was settled: $5.0 million was paid in cash, $17.5 million was erased via non-cash surrender and cancellation of private membership equity units, and the remaining $6.0 million was reclassified into Additional Paid-In Capital as contra-equity.
4. Historical Sponsor Capital Extractions: In FY 2025, Arxis distributed $350.0 million in debt-funded cash directly to Arcline affiliates (out of $363.8 million total distributions), concurrent with syndicating $2.81 billion under the 2025 Credit Agreement and receiving a $385.0 million equity contribution to retire Ovation debt. In September 2024, the Arxis Businesses Transaction recorded $2,389.9 million in non-cash equity consideration to combine IPS, Quantic, Qnnect, and Ovation under common control.
5. Sponsor Debt & Guarantees: Historical 10.0% PIK convertible notes of $49.62 million (including $14.62 million PIK interest) were paid to Arcline affiliates in February 2025. An unsecured $5.5 million note payable (SOFR + 3.50% due April 19, 2030) remains outstanding to an Arcline affiliate. All credit facility debt ($1.73B principal) is non-recourse to Arcline and secured by a first-priority lien on company assets.
6. Off-Balance Sheet Liabilities: In November 2024, Arxis divested a Jacksonville, Florida business, retaining an unlimited performance guarantee on a customer contract expiring December 2028 (contract value ~$30M). The customer alleged breach and claimed damages of $48.35 million as of June 30, 2026 (up from $9.0M at year-end 2025). Arxis holds an accrued litigation reserve of $9.0 million, with a contractual indemnity cap against the buyer limited to $10.0 million. Additional exposure includes an appealed $22.0 million jury verdict arising from a K-Max helicopter accident.
Internal controls over financial reporting revealed a historical material weakness related to accounting for complex non-routine transactions during the consolidation of IPS, Quantic, Qnnect, and Ovation. Management declared the weakness remediated following the hiring of Chief Accounting Officer Ryan Jankowski and external technical specialists. However, under newly public company exemptions, Arxis will not provide an independent auditor attestation report under SOX 404(b) until its Form 10-K for the fiscal year ending December 31, 2027. On June 20, 2025, the company replaced predecessor auditor RSM US LLP with KPMG LLP, who identified revenue audit evidence across decentralized sites as a Critical Audit Matter (CAM).
HDIN Research concludes that while Arxis, Inc. possesses a defensible industrial component moat with multi-decade platform stickiness, public equity serves as a junior economic instrument behind a private equity controlled structure. Institutional investors must evaluate the enterprise not merely on top-line defense tailwinds, but against ongoing secondary share issuance, 85% TRA cash leakage, and a compliance timetable highlighted by the November 2028 Department of War CMMC certification deadline across its 61 domestic sites.
Presentation Download & Video Access
- Presentation Download: Click the PDF download link under 'Related Topics' to access the full institutional presentation of this report.
- Video Link: Click this link to watch the HDIN analyst briefing on YouTube.
About HDIN Research
HDIN Research is a premier global market intelligence and strategic advisory firm specializing in institutional-grade financial analysis, supply chain audits, and macroeconomic forecasting. Our dedicated sector analysts deliver actionable, data-driven insights tailored for private equity, hedge funds, and corporate strategy teams. Visit us at http://www.hdinresearch.com.
2026 AI Transparency Footer
This intelligence report was authored by HDIN Research analysts following a rigorous audit of official corporate filings. AI was utilized for massive-scale data synthesis and structural drafting, ensuring 100% inclusion of reported data points. All strategic insights, financial modeling, and final verdicts were verified by our editorial board to ensure professional accuracy and compliance with 2026 Google Search E-E-A-T standards.