Accenture plc: Global Delivery Realignment Near India Hubs Offsets Consulting Pricing Drag as Managed Services Revenue Hits 50.3%
Date : 2026-10-19
Reading : 483
HDIN Executive Takeaways
1. Managed Services surpassed Consulting to generate 50.28% ($37.30B) of net revenue ($74.18B, +6.47% USD) in FY2026, driven by multi-year cloud and platform operations, while consolidated book-to-bill stabilized at 1.14x against an expanding $37.0B Remaining Performance Obligation backlog.
2. Delivery infrastructure rotated aggressively toward offshore hubs, with India expanding to 19% of consolidated net PP&E (up 500 bps YoY), helping hold payroll cost per employee flat (+0.24% to $58,778) and expanding GAAP operating margin by 70 bps to 15.38%.
3. Aggressive inorganic capital deployment ($4.94B across 17 acquisitions) and share buybacks ($7.52B) drove tangible net worth down -70.53% to $1.84B, financed by doubling long-term debt to $10.00B, while late-year pricing deflation and federal contracting headwinds flag conversion friction for FY2027.
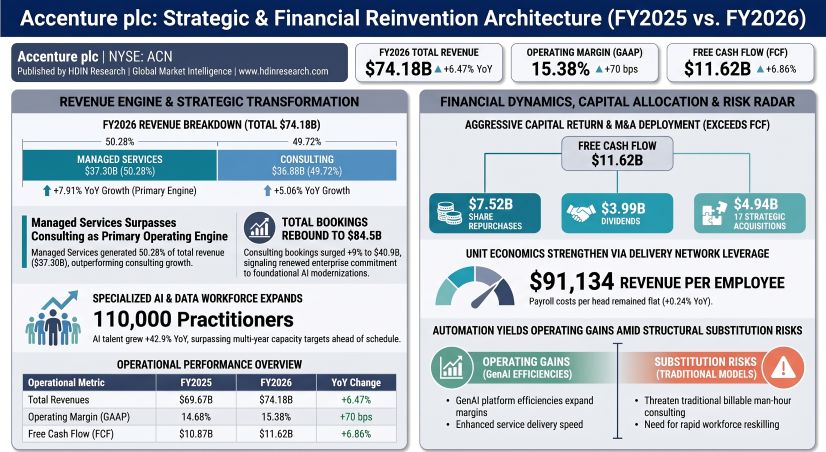
Figure Accenture plc Strategic & Financial Reinvention Architecture (FY2025 vs FY2026)
 Segmental Realities, Booking Divergence, and Margin Compression
Accenture plc [NYSE: ACN] generated consolidated net revenues of $74,183,445 thousand in FY2026, up 6.47% in USD (+5% in local currency) from $69,672,977 thousand in FY2025. Revenue growth outpaced ending headcount growth (+4.49% to 814,000) by 198 basis points, decoupling top-line expansion from linear headcount scaling.
Table ACN CONSOLIDATED REVENUE & BACKLOG DYNAMICS
The operational profile inverted as Managed Services crossed 50% of firmwide revenue, expanding +7.91% USD (+6% local currency) to $37,300,129 thousand (50.28% mix), while Consulting grew +5.06% USD (+3% local currency) to $36,883,316 thousand (49.72% mix).
Table Revenue Breakdown by Service Type, Industry Group, and Geographic Market (FY2025–FY2026)
Total New Bookings reached $84.50B (+4.84% USD, +3% local currency), bouncing back from $80.60B in FY2025. Consulting bookings rebounded +8.78% USD (+6% local currency) to $40.90B, lifting the Consulting book-to-bill ratio from 1.07x to 1.11x. Conversely, Managed Services bookings slowed to +1.63% USD (0% flat in local currency) at $43.70B, contracting its book-to-bill from 1.24x to 1.17x (and down from 1.39x in FY2024).
Operating expenses totaled $62,777,485 thousand (84.62% of revenue, down 70 bps). Gross margin expanded +14 bps to 32.05% as Cost of Services ($50,407,847 thousand) grew 6.26%, aided by lower client-facing payroll costs as a percentage of revenue. Sales & Marketing fell 35 bps to 9.76% ($7,243,476 thousand), while General & Administrative expenses jumped +10.75% to $4,818,621 thousand (6.50% of revenue, +26 bps) on transaction fees and IT infrastructure. Business optimization charges dropped 50.02% to $307,541 thousand, contributing 47 bps of the GAAP operating margin expansion to 15.38% ($11,405,960 thousand). Adjusted operating income grew 8.05% to $11,713,501 thousand (15.79% adjusted operating margin, +23 bps).
Effective tax rates rose to 25.1% GAAP (24.9% adjusted), an increase of 140 bps, driven by higher foreign tax rates (+4.4% / +$493.6M across non-U.S. regions), local taxes in India (+1.3% / +$150.1M), U.S. state taxes (+1.2% / +$141.2M), and OECD Pillar Two compliance, partly offset by the Irish statutory differential (-3.1% / -$358.0M) and U.S. Foreign-Derived Intangible Income deductions (-1.4% / -$157.7M). Net income attributable to Accenture plc rose 8.97% to $8,367,056 thousand, with diluted EPS expanding +11.60% to $13.56.
The DuPont ROE expansion (+189 bps to 26.51%) was primarily mechanical, propelled by the equity multiplier rising from 2.10x to 2.33x via long-term debt issuance and share repurchases, while asset turnover fell -5.39%. ROIC compressed -210 bps to 28.00% because invested capital surged +17.86% to $30,531,105 thousand, outstripping NOPAT growth (+9.62% to $8,548,172 thousand) due to the capitalization of $4.94B in cash M&A.
Infrastructure Layout, Labor Arbitrage, and Balance Sheet Reserves
Accenture's delivery network operates across Advanced Technology Centers (ATCs), Intelligent Operations Centers, and Global Reinvention Centers. Operational exposure has structurally relocated toward India, the Philippines, and the United States.
Net Property and Equipment (PP&E) in India rose from 14% of the global total in FY2025 to 19% in FY2026 (net PP&E of $327M, an increase of ~$105M), supporting ATC mega-campuses across Bengaluru, Hyderabad, Chennai, and Pune. Conversely, the U.S. share of net PP&E fell 400 bps to 25% (down from 31% in FY2024).
Deep delivery concentration in lower-cost markets held ending payroll cost per employee flat at $58,778 (+0.24% YoY), even as revenue per employee grew +1.90% to $91,134 on ending headcount (+3.80% to $93,137 on average headcount). Regional payroll consumed 63.0% of revenues in the Americas ($23.03B / $36.55B), 67.4% in EMEA ($18.17B / $26.96B), and 62.1% in Asia Pacific ($6.64B / $10.68B).
Capital expenditures in property and equipment increased +23.78% to $742,748 thousand (1.00% of revenue), leaving Free Cash Flow at $11,620,598 thousand (+6.86% YoY) and Operating Cash Flow at $12,363,346 thousand (+7.75%). Working capital absorbed cash: unbilled contract assets rose +16.23% to $2,439,595 thousand (current: $2,112,355 thousand; non-current: $327,240 thousand), driving a -$1,282,233 thousand operational cash drag. This was counterbalanced by total deferred revenues rising +8.14% to $7,262,260 thousand (current: $6,276,844 thousand; non-current: $985,416 thousand), providing an interest-free operating float.
M&A capital deployment expanded +235.8% YoY to $4,940,884 thousand across 17 transactions (Dragos, Faculty, DLB, Ookla, Alfahealth). Under ASC 805, 91.95% of consideration was capitalized into goodwill ($4,344,095 thousand) and intangibles ($1,125,725 thousand), pushing total goodwill to $26,819,458 thousand (36.44% of total assets) and net intangibles to $2,906,682 thousand. Consequently, Tangible Net Worth plummeted -70.53% to $1,841,116 thousand.
Note 11 reveals that Unrecognized Tax Benefits (UTBs) expanded to $2,529,828 thousand under FIN 48, designated as a Critical Audit Matter by KPMG LLP alongside the ASC 606 cost-to-cost input method on technology contracts. Management explicitly warns that UTBs could increase by approximately $1,300,000 thousand over the next 12 months as transfer pricing audits intensify in key jurisdictions. The bilateral U.S.-Ireland Advance Pricing Agreement has stalled, pushing completion targets back to FY2027 or FY2028.
HDIN Institutional Verdict
Management’s operational narrative emphasizes enterprise reinvention and AI-led efficiency via platforms like GenWizard and SynOps, but corporate disclosures reveal four fundamental structural tensions:
1. The Organic Masking Effect: Of the +5.0% local currency top-line expansion, inorganic acquisitions from the $4.94B cash outlay contributed an estimated 200 to 250 basis points. True organic expansion across the enterprise was approximately 2.5% to 3.0%. Within Consulting (+3% local currency reported), organic expansion stalled at roughly 1.0% to 1.5%, demonstrating that capital deployment masked underlying weakness in discretionary consulting spend.
2. Q4 Pricing Deflation vs. Peak Utilization: Form 10-K Item 7 notes that while full-year pricing was stable, Accenture experienced lower pricing in many business areas during Q4 FY2026. Entering FY2027, work booked from this cohort carries lower baseline contract margins. With workforce utilization already at 93% (near theoretical operational capacity), Accenture cannot absorb pricing concessions purely through higher billable density; margin preservation will require direct delivery automation and continued reliance on lower-cost Indian delivery centers.
3. The AI Man-Hour Cannibalization Paradox: Risk factor Item 1A explicitly states that technological developments have reduced and replaced historical service offerings. The rapid enterprise adoption of auto-code generation and synthetic testing compresses the total billing hours required for application maintenance and ERP rollouts. With approximately 65% of revenue tied to top 18 ecosystem partners (AWS, Microsoft Azure, Google Cloud, SAP, Salesforce, Oracle, ServiceNow), hyperscalers deploying autonomous integration agents directly compress Accenture's traditional time-and-materials integration addressable market.
4. Federal Public Sector Exposure: Accenture Federal Services ($5.16B revenue, down 7.4% from ~$5.57B in FY2025) contracted to 34% of Health & Public Service (from 36%) and 14% of Americas (from 15%). Procurement slowdowns under federal efficiency directives, combined with the active Department of Justice False Claims Act investigation into cloud security compliance controls, position the North American federal practice as an ongoing drag on regional earnings.
Presentation Download & Video Access:
- Presentation Download: Click the PDF download link under 'Related Topics' to access the full institutional presentation of this report.
- Video Link: Click this link to watch the HDIN analyst briefing on YouTube.
About HDIN Research:
HDIN Research is a premier global market intelligence and strategic advisory firm specializing in institutional-grade financial analysis, supply chain audits, and macroeconomic forecasting. Our dedicated sector analysts deliver actionable, data-driven insights tailored for private equity, hedge funds, and corporate strategy teams. Visit us at http://www.hdinresearch.com.
*2026 AI Transparency Footer:
This intelligence report was authored by HDIN Research analysts following a rigorous audit of official corporate filings. AI was utilized for massive-scale data synthesis and structural drafting, ensuring 100% inclusion of reported data points. All strategic insights, financial modeling, and final verdicts were verified by our editorial board to ensure professional accuracy and compliance with 2026 Google Search E-E-A-T standards.*
1. Managed Services surpassed Consulting to generate 50.28% ($37.30B) of net revenue ($74.18B, +6.47% USD) in FY2026, driven by multi-year cloud and platform operations, while consolidated book-to-bill stabilized at 1.14x against an expanding $37.0B Remaining Performance Obligation backlog.
2. Delivery infrastructure rotated aggressively toward offshore hubs, with India expanding to 19% of consolidated net PP&E (up 500 bps YoY), helping hold payroll cost per employee flat (+0.24% to $58,778) and expanding GAAP operating margin by 70 bps to 15.38%.
3. Aggressive inorganic capital deployment ($4.94B across 17 acquisitions) and share buybacks ($7.52B) drove tangible net worth down -70.53% to $1.84B, financed by doubling long-term debt to $10.00B, while late-year pricing deflation and federal contracting headwinds flag conversion friction for FY2027.
Figure Accenture plc Strategic & Financial Reinvention Architecture (FY2025 vs FY2026)
Segmental Realities, Booking Divergence, and Margin CompressionAccenture plc [NYSE: ACN] generated consolidated net revenues of $74,183,445 thousand in FY2026, up 6.47% in USD (+5% in local currency) from $69,672,977 thousand in FY2025. Revenue growth outpaced ending headcount growth (+4.49% to 814,000) by 198 basis points, decoupling top-line expansion from linear headcount scaling.
Table ACN CONSOLIDATED REVENUE & BACKLOG DYNAMICS
|
Financial / Operating Metric |
Latest Period |
Year-over-Year Change / Additional Details |
|---|---|---|
|
Net Revenues |
$74.18B |
+6.47% YoY; +5.00% in local currency |
|
Total New Bookings |
$84.50B |
+4.84% YoY; +3.00% in local currency |
|
Remaining Performance Obligations (RPO) |
$37.00B |
+8.82% YoY; 62% expected to be recognized in the next 12 months |
|
GAAP Operating Margin |
15.38% |
+70 bps YoY; adjusted operating margin: 15.79% |
|
Diluted EPS (GAAP) |
$13.56 |
+11.60% YoY, compared with $12.15 in the prior-year period |
The operational profile inverted as Managed Services crossed 50% of firmwide revenue, expanding +7.91% USD (+6% local currency) to $37,300,129 thousand (50.28% mix), while Consulting grew +5.06% USD (+3% local currency) to $36,883,316 thousand (49.72% mix).
Table Revenue Breakdown by Service Type, Industry Group, and Geographic Market (FY2025–FY2026)
| Operational Dimension / Segment | FY2025 Audited (USD '000) | FY2026 Audited (USD '000) | YoY Change (USD / %) | Local Currency YoY (%) | Segment Margin (FY26 vs FY25) |
| Type of Work | |||||
| Consulting Revenues | $35,106,786 | $36,883,316 | +$1,776,530 (+5.06%) | +3% | — |
| Managed Services Revenues | $34,566,191 | $37,300,129 | +$2,733,938 (+7.91%) | +6% | — |
| Industry Groups | |||||
| Products | $21,197,397 | $22,450,767 | +$1,253,370 (+5.91%) | +4% | 30.26% mix (-16 bps) |
| Health & Public Service | $14,762,837 | $15,170,696 | +$407,859 (+2.76%) | +2% | 20.45% mix (-74 bps) |
| Financial Services | $12,773,856 | $13,959,208 | +$1,185,352 (+9.28%) | +7% | 18.82% mix (+48 bps) |
| Communications, Media & Tech (CMT) | $11,453,982 | $12,673,550 | +$1,219,568 (+10.65%) | +10% | 17.08% mix (+64 bps) |
| Resources | $9,484,905 | $9,929,224 | +$444,319 (+4.68%) | +3% | 13.38% mix (-23 bps) |
| Geographic Markets | |||||
| Americas | $35,056,715 | $36,546,614 | +$1,489,899 (+4.25%) | +4% | 17.09% vs. 15.19% (+190 bps) |
| EMEA | $24,643,957 | $26,958,994 | +$2,315,037 (+9.39%) | +4% | 12.75% vs. 12.54% (+21 bps) |
| Asia Pacific | $9,972,305 | $10,677,837 | +$705,532 (+7.07%) | +8% | 16.16% vs. 18.15% (-199 bps) |
| Total Consolidated | $69,672,977 | $74,183,445 | +$4,510,468 (+6.47%) | +5% | 15.38% vs. 14.68% (+70 bps) |
Total New Bookings reached $84.50B (+4.84% USD, +3% local currency), bouncing back from $80.60B in FY2025. Consulting bookings rebounded +8.78% USD (+6% local currency) to $40.90B, lifting the Consulting book-to-bill ratio from 1.07x to 1.11x. Conversely, Managed Services bookings slowed to +1.63% USD (0% flat in local currency) at $43.70B, contracting its book-to-bill from 1.24x to 1.17x (and down from 1.39x in FY2024).
Operating expenses totaled $62,777,485 thousand (84.62% of revenue, down 70 bps). Gross margin expanded +14 bps to 32.05% as Cost of Services ($50,407,847 thousand) grew 6.26%, aided by lower client-facing payroll costs as a percentage of revenue. Sales & Marketing fell 35 bps to 9.76% ($7,243,476 thousand), while General & Administrative expenses jumped +10.75% to $4,818,621 thousand (6.50% of revenue, +26 bps) on transaction fees and IT infrastructure. Business optimization charges dropped 50.02% to $307,541 thousand, contributing 47 bps of the GAAP operating margin expansion to 15.38% ($11,405,960 thousand). Adjusted operating income grew 8.05% to $11,713,501 thousand (15.79% adjusted operating margin, +23 bps).
Effective tax rates rose to 25.1% GAAP (24.9% adjusted), an increase of 140 bps, driven by higher foreign tax rates (+4.4% / +$493.6M across non-U.S. regions), local taxes in India (+1.3% / +$150.1M), U.S. state taxes (+1.2% / +$141.2M), and OECD Pillar Two compliance, partly offset by the Irish statutory differential (-3.1% / -$358.0M) and U.S. Foreign-Derived Intangible Income deductions (-1.4% / -$157.7M). Net income attributable to Accenture plc rose 8.97% to $8,367,056 thousand, with diluted EPS expanding +11.60% to $13.56.
The DuPont ROE expansion (+189 bps to 26.51%) was primarily mechanical, propelled by the equity multiplier rising from 2.10x to 2.33x via long-term debt issuance and share repurchases, while asset turnover fell -5.39%. ROIC compressed -210 bps to 28.00% because invested capital surged +17.86% to $30,531,105 thousand, outstripping NOPAT growth (+9.62% to $8,548,172 thousand) due to the capitalization of $4.94B in cash M&A.
Infrastructure Layout, Labor Arbitrage, and Balance Sheet Reserves
Accenture's delivery network operates across Advanced Technology Centers (ATCs), Intelligent Operations Centers, and Global Reinvention Centers. Operational exposure has structurally relocated toward India, the Philippines, and the United States.
Net Property and Equipment (PP&E) in India rose from 14% of the global total in FY2025 to 19% in FY2026 (net PP&E of $327M, an increase of ~$105M), supporting ATC mega-campuses across Bengaluru, Hyderabad, Chennai, and Pune. Conversely, the U.S. share of net PP&E fell 400 bps to 25% (down from 31% in FY2024).
Deep delivery concentration in lower-cost markets held ending payroll cost per employee flat at $58,778 (+0.24% YoY), even as revenue per employee grew +1.90% to $91,134 on ending headcount (+3.80% to $93,137 on average headcount). Regional payroll consumed 63.0% of revenues in the Americas ($23.03B / $36.55B), 67.4% in EMEA ($18.17B / $26.96B), and 62.1% in Asia Pacific ($6.64B / $10.68B).
Capital expenditures in property and equipment increased +23.78% to $742,748 thousand (1.00% of revenue), leaving Free Cash Flow at $11,620,598 thousand (+6.86% YoY) and Operating Cash Flow at $12,363,346 thousand (+7.75%). Working capital absorbed cash: unbilled contract assets rose +16.23% to $2,439,595 thousand (current: $2,112,355 thousand; non-current: $327,240 thousand), driving a -$1,282,233 thousand operational cash drag. This was counterbalanced by total deferred revenues rising +8.14% to $7,262,260 thousand (current: $6,276,844 thousand; non-current: $985,416 thousand), providing an interest-free operating float.
M&A capital deployment expanded +235.8% YoY to $4,940,884 thousand across 17 transactions (Dragos, Faculty, DLB, Ookla, Alfahealth). Under ASC 805, 91.95% of consideration was capitalized into goodwill ($4,344,095 thousand) and intangibles ($1,125,725 thousand), pushing total goodwill to $26,819,458 thousand (36.44% of total assets) and net intangibles to $2,906,682 thousand. Consequently, Tangible Net Worth plummeted -70.53% to $1,841,116 thousand.
Note 11 reveals that Unrecognized Tax Benefits (UTBs) expanded to $2,529,828 thousand under FIN 48, designated as a Critical Audit Matter by KPMG LLP alongside the ASC 606 cost-to-cost input method on technology contracts. Management explicitly warns that UTBs could increase by approximately $1,300,000 thousand over the next 12 months as transfer pricing audits intensify in key jurisdictions. The bilateral U.S.-Ireland Advance Pricing Agreement has stalled, pushing completion targets back to FY2027 or FY2028.
HDIN Institutional Verdict
Management’s operational narrative emphasizes enterprise reinvention and AI-led efficiency via platforms like GenWizard and SynOps, but corporate disclosures reveal four fundamental structural tensions:
1. The Organic Masking Effect: Of the +5.0% local currency top-line expansion, inorganic acquisitions from the $4.94B cash outlay contributed an estimated 200 to 250 basis points. True organic expansion across the enterprise was approximately 2.5% to 3.0%. Within Consulting (+3% local currency reported), organic expansion stalled at roughly 1.0% to 1.5%, demonstrating that capital deployment masked underlying weakness in discretionary consulting spend.
2. Q4 Pricing Deflation vs. Peak Utilization: Form 10-K Item 7 notes that while full-year pricing was stable, Accenture experienced lower pricing in many business areas during Q4 FY2026. Entering FY2027, work booked from this cohort carries lower baseline contract margins. With workforce utilization already at 93% (near theoretical operational capacity), Accenture cannot absorb pricing concessions purely through higher billable density; margin preservation will require direct delivery automation and continued reliance on lower-cost Indian delivery centers.
3. The AI Man-Hour Cannibalization Paradox: Risk factor Item 1A explicitly states that technological developments have reduced and replaced historical service offerings. The rapid enterprise adoption of auto-code generation and synthetic testing compresses the total billing hours required for application maintenance and ERP rollouts. With approximately 65% of revenue tied to top 18 ecosystem partners (AWS, Microsoft Azure, Google Cloud, SAP, Salesforce, Oracle, ServiceNow), hyperscalers deploying autonomous integration agents directly compress Accenture's traditional time-and-materials integration addressable market.
4. Federal Public Sector Exposure: Accenture Federal Services ($5.16B revenue, down 7.4% from ~$5.57B in FY2025) contracted to 34% of Health & Public Service (from 36%) and 14% of Americas (from 15%). Procurement slowdowns under federal efficiency directives, combined with the active Department of Justice False Claims Act investigation into cloud security compliance controls, position the North American federal practice as an ongoing drag on regional earnings.
Presentation Download & Video Access:
- Presentation Download: Click the PDF download link under 'Related Topics' to access the full institutional presentation of this report.
- Video Link: Click this link to watch the HDIN analyst briefing on YouTube.
About HDIN Research:
HDIN Research is a premier global market intelligence and strategic advisory firm specializing in institutional-grade financial analysis, supply chain audits, and macroeconomic forecasting. Our dedicated sector analysts deliver actionable, data-driven insights tailored for private equity, hedge funds, and corporate strategy teams. Visit us at http://www.hdinresearch.com.
*2026 AI Transparency Footer:
This intelligence report was authored by HDIN Research analysts following a rigorous audit of official corporate filings. AI was utilized for massive-scale data synthesis and structural drafting, ensuring 100% inclusion of reported data points. All strategic insights, financial modeling, and final verdicts were verified by our editorial board to ensure professional accuracy and compliance with 2026 Google Search E-E-A-T standards.*