KWS SAAT SE & Co. KGaA: Portfolio Pivot Clears Americas Liabilities Near Einbeck as 31-Day Working Capital Extension Pressures Cash Flow
Date : 2026-10-23
Reading : 147
HDIN Executive Takeaways
1. KWS SAAT SE & Co. KGaA [ETR: KWS] completed its strategic exit from Western Hemisphere row-crop operations, lowering Net Debt to €8.7 million (0.03x EBITDA) and extinguishing €123.5 million in third-party bank guarantees.
2. The remaining European core faces severe working capital friction: the Cash Conversion Cycle (CCC) expanded by 31.3 days to 279.4 days, contributing to a 24.2% contraction in Operating Cash Flow to €172.6 million.
3. Headline stability masks earnings dilution: recurring continuing EBIT dropped 12.2% to €215.0 million when stripping out a €29.0 million licensing gain, while gross inventory write-downs reached €75.4 million (16.4% of total inventory).
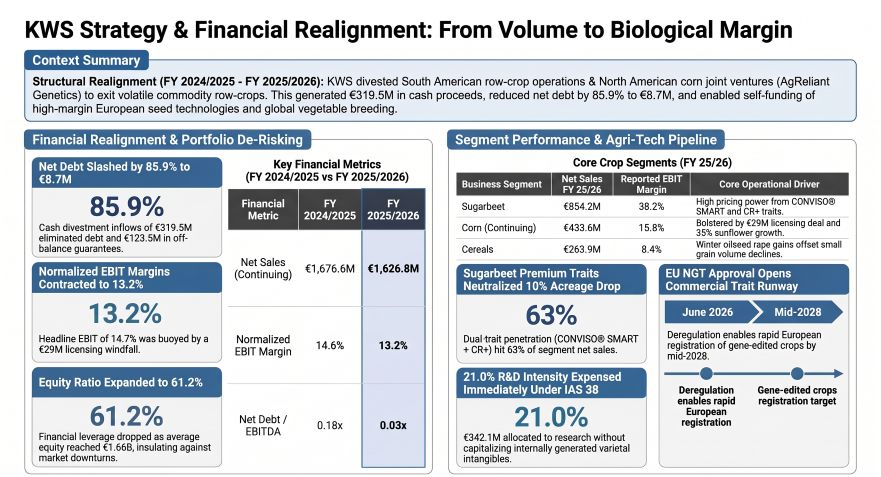
Figure KWS Strategy & Financial Realignment From Volume to Biological Margin
 Segmental Realities and Margin Compression
Consolidated net sales from continuing operations contracted 3.0% (-1.0% on a comparable basis) to €1,626.8 million in FY 2025/2026, driven by a 10% acreage drop in European sugarbeets and soft farm-gate prices. Gross margin dropped 186 basis points to 61.2%, pressured by negative product mix shifts and dilution from the Vegetables expansion phase.
Reported continuing operating income (EBIT) fell 3.5% to €239.0 million (14.7% margin). However, earnings quality was distorted by portfolio disposals: FY 2025/2026 results included a non-recurring €29.0 million EBITDA gain realized on genetic licensing rights from the AgReliant asset deal, while the prior year included a €7.8 million VAT provision reversal. Adjusted for non-recurring gains, property disposals, and a €5.0 million European antitrust legal provision in Cereals, recurring operating EBIT declined 12.2% from €244.9 million to €215.0 million.
Operating performance varied across core divisions:
* Sugarbeet Segment: Net sales fell 2.0% (-0.6% comparable) to €854.2 million. Double-trait varieties (CONVISO® SMART + CR+) reached 63% penetration, mitigating the 10% drop in cultivated area and lifting global sugarbeet market share to 27%. Segment EBIT dropped 11.1% to €326.6 million (38.2% margin) due to fixed breeding absorption.
* Corn Segment: Continuing revenue contracted 5.3% (-1.6% comparable) to €433.6 million. Sunflower hybrid sales surged 35% across drought-impacted Southern Europe, while European corn market share rose to 13%. EBIT jumped 131.5% to €68.5 million, lifted by the €29.0 million licensing windfall (clean EBITDA margin: 14.6% vs. 11.5%).
* Cereals Segment: Net sales were flat at €263.9 million (+0.2% reported; +0.6% comparable). Winter oilseed rape rose to 39% of divisional sales (securing 17% European market share), offsetting declines in hybrid rye (-13%), barley (-9%), and wheat (-2%). EBIT declined 31.1% to €22.1 million (8.4% margin) due to accelerated hybrid wheat R&D and the €5.0 million antitrust provision.
* Vegetables Segment: Net sales fell 6.4% (-6.8% comparable) to €67.5 million, pressured by commercial food service inventory adjustments for U.S. spinach seed. EBITDA losses widened from -€22.0 million to -€25.8 million, while reported EBIT registered -€41.6 million following the prior year's €10.4 million full write-off of the Pop Vriend brand.
* Corporate / Shared Services: Operating losses stood at -€136.6 million, reflecting €51.4 million in pooled basic biotechnological research and central IT costs, offset by €7.5 million in farm receipts.
Table Financial Performance and Valuation Matrix (FY2024/25–FY2025/26)
Working capital absorption deteriorated operating cash conversion. Operating cash flow fell 24.2% to €172.6 million due to a €102.9 million inventory cash draw and €49.0 million in uncollected trade receivables. Days Inventory Outstanding (DIO) rose from 247.8 to 266.6 days, and Days Sales Outstanding (DSO) lengthened from 106.5 to 120.4 days (overdue 1–180 day balances rose from €51.6 million to €67.2 million). Consequently, the Cash Conversion Cycle (CCC) extended 31.3 days to 279.4 days.
Under IAS 2 and IAS 41, balance sheet inventories rose 9.7% to €460.9 million, driven by an accumulation of Work in Progress (WIP), which reached €204.5 million (+54.6% across two fiscal years), alongside €197.9 million in finished goods (+7.8%). Gross inventory write-downs and scrap destruction totaled €75.44 million in FY 2025/2026 (16.4% of total inventory and 12.0% of COGS), caused by germination decay, outcrossing contamination, and crop acreage cuts. Reversals of prior-year write-downs rose to €11.87 million, yielding net inventory impairment charges of €63.58 million.
Table Balance Sheet Inventories, Biological Assets, and Customer-Related Liabilities (FY2024–FY2026)
Infrastructure Layout and Regional Moats
KWS SAAT SE & Co. KGaA operates an infrastructure base comprising €1,130.8 million in noncurrent operating assets across 69 subsidiaries in 31 jurisdictions. Geographic distribution of net sales shows high exposure to European growing cycles:
* Europe (Excl. Germany): €907.2 million (55.8% of Group net sales). France generated €165.9 million (-6.2%), anchored by conditioning facilities in Roye and breeding farms in Mons-en-Pévèle and Champol. Central/Eastern European hubs include Kondratowice and Poznań in Poland.
* Germany: €289.1 million (17.8% of sales). Strategic corporate hub in Einbeck housing central biotechnology, the €25 million Phytopathology Center, and the €56.8 million seed storage complex completed in May 2025, alongside field hubs in Bergen (KWS Lochow), Wohlde, and Wiebrechtshausen.
* North & South America: €254.4 million (15.6% of sales, down from 18.5%). United States contributed €230.9 million (-15.9%), anchored by the Gateway Research Center (GRC) in St. Louis, Missouri, and research greenhouses in Kimberly, Idaho. Brazilian activities in Uberlândia transitioned into tropical vegetable breeding.
* Rest of World: €176.1 million (10.8% of sales, +30.8% nominal growth). Includes operations in Eskişehir (Türkiye), Lipetsk (Russia; €136.7 million external sales; local seed conditioning plant), Kamianets-Podilskyi and Kyiv (Ukraine), and commercial units in Beijing (China).
Capital expenditures in FY 2025/2026 totaled €108.6 million: Germany absorbed €55.2 million (50.8%), Europe ex-Germany €35.6 million (32.8%), the Americas €15.5 million (14.3%), and Rest of World €2.3 million (2.1%). Controlled-environment projects include the Gran Canaria automated greenhouses (Spain) for contra-seasonal breeding cycles and the 10,000 m² Vegetable R&D Center in Andijk (Netherlands).
Table Global Physical Asset Network and Technical Capabilities
Corporate portfolio disposals over the 24-month audit period yielded €319.5 million in cash divestment receipts:
1. South American Corn & Sorghum: Closed July 31, 2024, to GDM Holding S.A. for €308.8 million gross (€271.4 million net cash proceeds), generating a €108.1 million after-tax gain and eliminating volatile Argentine/Brazilian net working capital.
2. North American AgReliant JVs: Divested 50% equity stake to GDM and Limagrain on August 29, 2025, for low triple-digit million USD consideration (€42.8 million cash received in FY 25/26). The transaction generated a €10.0 million equity gain, a €29.0 million operating licensing gain, and extinguished €123.5 million in third-party bank debt guarantees.
3. Genective S.A.: Divested 50% joint operation on January 14, 2025, for €12.5 million (€9.5 million net cash), ending transgenic corn trait research.
The company expenses 100% of internal R&D under IAS 38 (€342.1 million in FY 25/26; 2,031 FTEs, or 38.8% of staff). Zero internal development is capitalized. Balance sheet intangibles (€370.8 million) consist of acquired technology (€202.0 million Pop Vriend germplasm, amortized over 23 remaining years) and €105.4 million in goodwill (€99.6 million allocated to Vegetables, tested via a 14-year DCF model using a 6.07% discount rate). On the regulatory front, the European Parliament’s June 2026 approval of the New Genomic Techniques (NGT) regulation provides a clear path for KWS' non-transgenic CRISPR platforms when the framework takes effect in mid-2028.
HDIN Institutional Verdict
An audit of the filings reveals that KWS' balance sheet de-risking masks an ongoing operational trade-off. By harvesting €319.5 million in cash from its American row-crop exits, management eliminated volatile joint venture losses and reduced net borrowings to €8.7 million. However, this has concentrated group exposure into European growing belts, where KWS generates 73.5% of continuing sales (€1,196.3 million) without a crop-chemical profit engine to offset agricultural volume contractions.
Working capital efficiency presents a clear pressure point: the Cash Conversion Cycle elongated by 31.3 days to 279.4 days. Work in progress inventories expanded 54.6% over two years to €204.5 million, and gross inventory impairments totaled €75.44 million (16.4% of inventories) alongside €34.68 million in return liabilities. Furthermore, while the U.S. pension plan retains a €6.28 million surplus, the domestic German pension carries a €72.10 million unfunded deficit supported only by corporate cash flows. KWS operates with low balance sheet leverage, but resolving working capital bottlenecks in raw-seed WIP and meeting the 2030 commercialization target for its Vegetable segment remain key operational hurdles for the group.
Presentation Download & Video Access:
- Presentation Download: Click the PDF download link under 'Related Topics' to access the full institutional presentation of this report.
- Video Link: Click this link to watch the HDIN analyst briefing on YouTube.
About HDIN Research:
HDIN Research is a premier global market intelligence and strategic advisory firm specializing in institutional-grade financial analysis, supply chain audits, and macroeconomic forecasting. Our dedicated sector analysts deliver actionable, data-driven insights tailored for private equity, hedge funds, and corporate strategy teams. Visit us at http://www.hdinresearch.com.
2026 AI Transparency Footer:
"This intelligence report was authored by HDIN Research analysts following a rigorous audit of official corporate filings. AI was utilized for massive-scale data synthesis and structural drafting, ensuring 100% inclusion of reported data points. All strategic insights, financial modeling, and final verdicts were verified by our editorial board to ensure professional accuracy and compliance with 2026 Google Search E-E-A-T standards."
1. KWS SAAT SE & Co. KGaA [ETR: KWS] completed its strategic exit from Western Hemisphere row-crop operations, lowering Net Debt to €8.7 million (0.03x EBITDA) and extinguishing €123.5 million in third-party bank guarantees.
2. The remaining European core faces severe working capital friction: the Cash Conversion Cycle (CCC) expanded by 31.3 days to 279.4 days, contributing to a 24.2% contraction in Operating Cash Flow to €172.6 million.
3. Headline stability masks earnings dilution: recurring continuing EBIT dropped 12.2% to €215.0 million when stripping out a €29.0 million licensing gain, while gross inventory write-downs reached €75.4 million (16.4% of total inventory).
Figure KWS Strategy & Financial Realignment From Volume to Biological Margin
Segmental Realities and Margin CompressionConsolidated net sales from continuing operations contracted 3.0% (-1.0% on a comparable basis) to €1,626.8 million in FY 2025/2026, driven by a 10% acreage drop in European sugarbeets and soft farm-gate prices. Gross margin dropped 186 basis points to 61.2%, pressured by negative product mix shifts and dilution from the Vegetables expansion phase.
Reported continuing operating income (EBIT) fell 3.5% to €239.0 million (14.7% margin). However, earnings quality was distorted by portfolio disposals: FY 2025/2026 results included a non-recurring €29.0 million EBITDA gain realized on genetic licensing rights from the AgReliant asset deal, while the prior year included a €7.8 million VAT provision reversal. Adjusted for non-recurring gains, property disposals, and a €5.0 million European antitrust legal provision in Cereals, recurring operating EBIT declined 12.2% from €244.9 million to €215.0 million.
Operating performance varied across core divisions:
* Sugarbeet Segment: Net sales fell 2.0% (-0.6% comparable) to €854.2 million. Double-trait varieties (CONVISO® SMART + CR+) reached 63% penetration, mitigating the 10% drop in cultivated area and lifting global sugarbeet market share to 27%. Segment EBIT dropped 11.1% to €326.6 million (38.2% margin) due to fixed breeding absorption.
* Corn Segment: Continuing revenue contracted 5.3% (-1.6% comparable) to €433.6 million. Sunflower hybrid sales surged 35% across drought-impacted Southern Europe, while European corn market share rose to 13%. EBIT jumped 131.5% to €68.5 million, lifted by the €29.0 million licensing windfall (clean EBITDA margin: 14.6% vs. 11.5%).
* Cereals Segment: Net sales were flat at €263.9 million (+0.2% reported; +0.6% comparable). Winter oilseed rape rose to 39% of divisional sales (securing 17% European market share), offsetting declines in hybrid rye (-13%), barley (-9%), and wheat (-2%). EBIT declined 31.1% to €22.1 million (8.4% margin) due to accelerated hybrid wheat R&D and the €5.0 million antitrust provision.
* Vegetables Segment: Net sales fell 6.4% (-6.8% comparable) to €67.5 million, pressured by commercial food service inventory adjustments for U.S. spinach seed. EBITDA losses widened from -€22.0 million to -€25.8 million, while reported EBIT registered -€41.6 million following the prior year's €10.4 million full write-off of the Pop Vriend brand.
* Corporate / Shared Services: Operating losses stood at -€136.6 million, reflecting €51.4 million in pooled basic biotechnological research and central IT costs, offset by €7.5 million in farm receipts.
Table Financial Performance and Valuation Matrix (FY2024/25–FY2025/26)
| Financial Performance & Valuation Matrix | FY 2024/2025 | FY 2025/2026 | Reported YoY Delta | Normalized YoY Delta |
| Net Sales (Continuing Operations) | €1,676.6M | €1,626.8M | -3.0% | -1.0% (Organic) |
| Cost of Goods Sold (COGS) | €619.2M | €631.0M | +1.9% | N/A |
| Gross Profit | €1,057.4M | €995.8M | -5.8% | -5.8% |
| Gross Profit Margin | 63.1% | 61.2% | -186 bps | -186 bps |
| Research & Development (100% Expensed) | €348.95M | €342.06M | -2.0% | -2.0% |
| Operating Income (EBIT - Reported) | €247.6M | €239.0M | -3.5% | N/A |
| Normalized Clean Operating EBIT | €244.9M | €215.0M | N/A | -12.2% |
| Normalized Clean EBIT Margin | 14.6% | 13.2% | N/A | -140 bps |
| EBITDA (Reported / Adjusted) | €350.5M / €337.3M | €343.1M / €314.1M | -2.1% (Reported) | -6.9% (Adjusted) |
| Adjusted EBITDA Margin | 20.4% | 19.3% | N/A | -110 bps |
| Net Income (Continuing Operations) | €140.0M | €158.4M | +13.1% | N/A |
| Group Net Income (Statutory Reported) | €236.3M | €160.8M | -31.9% | -10.5% (Normalized) |
| Operating Cash Flow (Continuing) | €227.7M | €172.6M | -24.2% | -24.2% |
| Free Cash Flow (Continuing) | €123.2M | €122.5M | -0.6% | -0.6% |
| Cash CAPEX (PPE & Intangibles) | €122.0M | €109.5M | -10.2% | -10.2% |
| Cash & Cash Equivalents | €374.0M | €394.4M | +5.5% | +5.5% |
| Total Borrowings (Financial Liabilities) | €435.5M | €403.1M | -7.4% | -7.4% |
| Net Debt | €61.6M | €8.7M | -85.9% | -85.9% |
| Leverage Ratio (Net Debt / EBITDA) | 0.18x | 0.03x | -0.15x | N/A |
| Balance Sheet Equity Ratio | 59.8% | 61.2% | +140 bps | +140 bps |
Working capital absorption deteriorated operating cash conversion. Operating cash flow fell 24.2% to €172.6 million due to a €102.9 million inventory cash draw and €49.0 million in uncollected trade receivables. Days Inventory Outstanding (DIO) rose from 247.8 to 266.6 days, and Days Sales Outstanding (DSO) lengthened from 106.5 to 120.4 days (overdue 1–180 day balances rose from €51.6 million to €67.2 million). Consequently, the Cash Conversion Cycle (CCC) extended 31.3 days to 279.4 days.
Under IAS 2 and IAS 41, balance sheet inventories rose 9.7% to €460.9 million, driven by an accumulation of Work in Progress (WIP), which reached €204.5 million (+54.6% across two fiscal years), alongside €197.9 million in finished goods (+7.8%). Gross inventory write-downs and scrap destruction totaled €75.44 million in FY 2025/2026 (16.4% of total inventory and 12.0% of COGS), caused by germination decay, outcrossing contamination, and crop acreage cuts. Reversals of prior-year write-downs rose to €11.87 million, yielding net inventory impairment charges of €63.58 million.
Table Balance Sheet Inventories, Biological Assets, and Customer-Related Liabilities (FY2024–FY2026)
| Balance Sheet Inventories & Provisions Breakdown | 06/30/2024 (€k) | 06/30/2025 (€k) | 06/30/2026 (€k) | 2-Yr Shift (%) |
| Raw Materials & Consumables | €53,567 | €49,354 | €48,787 | -8.9% |
| Work in Progress (Bulk Unprocessed Seed) | €132,282 | €192,092 | €204,480 | +54.6% |
| Immature Biological Assets (IAS 41) | €6,047 | €7,008 | €4,234 | -30.0% |
| Finished Goods & Commercial Merchandise | €183,528 | €167,592 | €197,926 | +7.8% |
| Rights of Return Assets (IFRS 15) | €5,127 | €4,282 | €5,504 | +7.4% |
| Total Inventory & Biological Assets | €380,551 | €420,328 | €460,931 | +21.1% |
| Refund Liabilities (Customer Returns - Note 7.12) | N/A | €35,447 | €34,675 | -2.2% |
| Contract Liabilities (Customer Prepayments) | N/A | €16,183 | €18,771 | +16.0% |
| Obligations from Sales Transactions | N/A | €12,472 | €13,279 | +6.5% |
Infrastructure Layout and Regional Moats
KWS SAAT SE & Co. KGaA operates an infrastructure base comprising €1,130.8 million in noncurrent operating assets across 69 subsidiaries in 31 jurisdictions. Geographic distribution of net sales shows high exposure to European growing cycles:
* Europe (Excl. Germany): €907.2 million (55.8% of Group net sales). France generated €165.9 million (-6.2%), anchored by conditioning facilities in Roye and breeding farms in Mons-en-Pévèle and Champol. Central/Eastern European hubs include Kondratowice and Poznań in Poland.
* Germany: €289.1 million (17.8% of sales). Strategic corporate hub in Einbeck housing central biotechnology, the €25 million Phytopathology Center, and the €56.8 million seed storage complex completed in May 2025, alongside field hubs in Bergen (KWS Lochow), Wohlde, and Wiebrechtshausen.
* North & South America: €254.4 million (15.6% of sales, down from 18.5%). United States contributed €230.9 million (-15.9%), anchored by the Gateway Research Center (GRC) in St. Louis, Missouri, and research greenhouses in Kimberly, Idaho. Brazilian activities in Uberlândia transitioned into tropical vegetable breeding.
* Rest of World: €176.1 million (10.8% of sales, +30.8% nominal growth). Includes operations in Eskişehir (Türkiye), Lipetsk (Russia; €136.7 million external sales; local seed conditioning plant), Kamianets-Podilskyi and Kyiv (Ukraine), and commercial units in Beijing (China).
Capital expenditures in FY 2025/2026 totaled €108.6 million: Germany absorbed €55.2 million (50.8%), Europe ex-Germany €35.6 million (32.8%), the Americas €15.5 million (14.3%), and Rest of World €2.3 million (2.1%). Controlled-environment projects include the Gran Canaria automated greenhouses (Spain) for contra-seasonal breeding cycles and the 10,000 m² Vegetable R&D Center in Andijk (Netherlands).
Table Global Physical Asset Network and Technical Capabilities
| Physical Asset Network & Technical Functions | Primary Location | Primary Crop Focus | Strategic Mission & Capabilities |
| Global Biotechnology HQ & Plant Pathology | Einbeck, Germany | Sugarbeet, Cereals, Corn | Controls global IP, automated seed X-ray sorting, marker-assisted selection (MAS). |
| Vegetable R&D Central Complex | Andijk, Netherlands | Spinach, Beans, Fruity Crops | 6,600 m² automated greenhouses; seed priming and downstream Peronospora screening. |
| Precision Gene-Editing Center (GRC) | St. Louis, Missouri, US | All commercial crop lines | Targeted double-strand breaks via CRISPR/Cas; validates non-transgenic NGT platforms. |
| Automated Contra-Seasonal Station | Gran Canaria, Spain | Corn, Sunflowers, Vegetables | Accelerated generation advancement; year-round crossing insulated from European winters. |
| Atlantic Seed Processing Anchor | Roye, France | Sugarbeet, Cereals, Corn | High-throughput seed grading, pelletization, and fungicidal chemical seed dressing. |
| Eastern European Conditioning Mill | Lipetsk, Russian Federation | Sugarbeet, Corn, Sunflower | In-country seed grading and packaging to meet local state sourcing mandates. |
| Mediterranean Bridgehead Facility | Eskişehir, Türkiye | Sugarbeet, Warm Vegetables | Processing center for Middle East/North Africa; heat-tolerant trait selection. |
Corporate portfolio disposals over the 24-month audit period yielded €319.5 million in cash divestment receipts:
1. South American Corn & Sorghum: Closed July 31, 2024, to GDM Holding S.A. for €308.8 million gross (€271.4 million net cash proceeds), generating a €108.1 million after-tax gain and eliminating volatile Argentine/Brazilian net working capital.
2. North American AgReliant JVs: Divested 50% equity stake to GDM and Limagrain on August 29, 2025, for low triple-digit million USD consideration (€42.8 million cash received in FY 25/26). The transaction generated a €10.0 million equity gain, a €29.0 million operating licensing gain, and extinguished €123.5 million in third-party bank debt guarantees.
3. Genective S.A.: Divested 50% joint operation on January 14, 2025, for €12.5 million (€9.5 million net cash), ending transgenic corn trait research.
The company expenses 100% of internal R&D under IAS 38 (€342.1 million in FY 25/26; 2,031 FTEs, or 38.8% of staff). Zero internal development is capitalized. Balance sheet intangibles (€370.8 million) consist of acquired technology (€202.0 million Pop Vriend germplasm, amortized over 23 remaining years) and €105.4 million in goodwill (€99.6 million allocated to Vegetables, tested via a 14-year DCF model using a 6.07% discount rate). On the regulatory front, the European Parliament’s June 2026 approval of the New Genomic Techniques (NGT) regulation provides a clear path for KWS' non-transgenic CRISPR platforms when the framework takes effect in mid-2028.
HDIN Institutional Verdict
An audit of the filings reveals that KWS' balance sheet de-risking masks an ongoing operational trade-off. By harvesting €319.5 million in cash from its American row-crop exits, management eliminated volatile joint venture losses and reduced net borrowings to €8.7 million. However, this has concentrated group exposure into European growing belts, where KWS generates 73.5% of continuing sales (€1,196.3 million) without a crop-chemical profit engine to offset agricultural volume contractions.
Working capital efficiency presents a clear pressure point: the Cash Conversion Cycle elongated by 31.3 days to 279.4 days. Work in progress inventories expanded 54.6% over two years to €204.5 million, and gross inventory impairments totaled €75.44 million (16.4% of inventories) alongside €34.68 million in return liabilities. Furthermore, while the U.S. pension plan retains a €6.28 million surplus, the domestic German pension carries a €72.10 million unfunded deficit supported only by corporate cash flows. KWS operates with low balance sheet leverage, but resolving working capital bottlenecks in raw-seed WIP and meeting the 2030 commercialization target for its Vegetable segment remain key operational hurdles for the group.
Presentation Download & Video Access:
- Presentation Download: Click the PDF download link under 'Related Topics' to access the full institutional presentation of this report.
- Video Link: Click this link to watch the HDIN analyst briefing on YouTube.
About HDIN Research:
HDIN Research is a premier global market intelligence and strategic advisory firm specializing in institutional-grade financial analysis, supply chain audits, and macroeconomic forecasting. Our dedicated sector analysts deliver actionable, data-driven insights tailored for private equity, hedge funds, and corporate strategy teams. Visit us at http://www.hdinresearch.com.
2026 AI Transparency Footer:
"This intelligence report was authored by HDIN Research analysts following a rigorous audit of official corporate filings. AI was utilized for massive-scale data synthesis and structural drafting, ensuring 100% inclusion of reported data points. All strategic insights, financial modeling, and final verdicts were verified by our editorial board to ensure professional accuracy and compliance with 2026 Google Search E-E-A-T standards."