ChemoMetec A/S: Automation Fleet Migration Accelerates in Allerød as 55% EBITDA Margin Offsets Transatlantic CGT Bottlenecks
1. ChemoMetec A/S expanded its FY 2025/26 EBITDA margin by 296 basis points to 55.03% despite reported top-line expansion moderating to 3.12% (7.00% constant currency), supported by a 95.10% gross margin and structural workforce rationalization.
2. Contraction in North American consumables (-10.67%) alongside prolonged customer automation validation cycles (3 to 5 years) forced a May 2026 guidance downward revision, shifting operational reliance to the automated XcytoMatic platform (+123.1% instrument expansion).
3. Intangible R&D capitalization reached 99.95% while an IAS 8 prior-period restatement erased DKK 11.7 million from FY 2024/25 net profit, highlighting internal accounting control constraints amid two CFO transitions across two years.
Figure ChemoMetec AS Two-Year Performance & Structural Moat Analvsis (FY 2024/25 vs FY 2025/26)
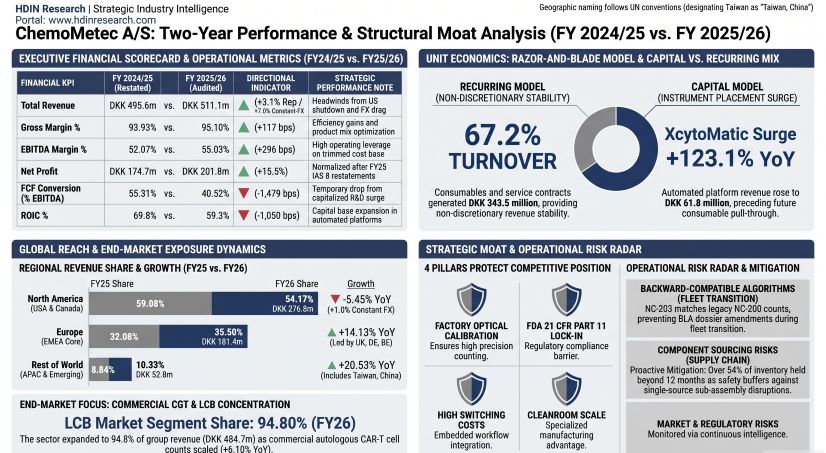 Segmental Performance and Operating Leverage Dynamics
ChemoMetec A/S [CPH: CHEMM] navigated a pronounced operational transition across the 2024/25 and 2025/26 fiscal cycles (fiscal year-end 30 June). Following a cyclical rebound in FY 2024/25 where revenue rose 21.67% to DKK 495.572 million and EBITDA jumped 38.56% to DKK 258.048 million, reported top-line expansion slowed to 3.12% in FY 2025/26, reaching DKK 511.057 million. Foreign exchange translation, primarily driven by US Dollar depreciation against the Danish Krone, created an aggregate 388 basis point currency drag, leaving constant-currency revenue growth at 7.00%.
On 4 May 2026, corporate management downgraded initial FY 2025/26 guidance (DKK 545–565 million revenue; DKK 295–315 million EBITDA) to revised corridors of DKK 505–525 million revenue and DKK 275–290 million EBITDA. The downgrade reflected the Autumn 2025 US Federal Government shutdown, temporary patient throughput contractions across autologous cell and gene therapy (CGT) manufacturing suites, and extended multi-year customer validation timelines for automated platforms. Realized results tracked the midpoints of the revised guidance corridor.
Gross profit expanded 4.40% to DKK 485.994 million, lifting gross margin to 95.10%. Net production costs fell 16.63% to DKK 25.063 million, aided by DKK 38.267 million in capitalized internal production work (up 9.12% from DKK 35.070 million in FY 2024/25; Parent Company capitalized internal work totaled DKK 35.10 million vs. DKK 30.33 million). Raw materials and consumables consumption rose from DKK 54.9 million to DKK 62.1 million.
Staff costs declined 7.43% to DKK 142.477 million as average full-time equivalents (FTEs) fell from 184 (187 in revised historical highlights) to 177, closing the fiscal year at 174 active personnel. The prior fiscal year absorbed DKK 11.8 million in non-recurring severance and organizational restructuring expenses linked to the Ovizio acquisition and global realignment; normalizing FY 2024/25 for this item yields an underlying EBITDA of DKK 269.8 million (54.43% margin). Other external costs climbed 16.28% to DKK 62.266 million, driven by the expansion of direct North American sales infrastructure, travel, and international trade fair representation.
Operating profit (EBIT) grew 6.12% to DKK 250.995 million (49.11% margin), absorbing a 40.52% increase in depreciation and amortization (DKK 30.256 million vs. DKK 21.532 million) as capitalized development assets entered commercial amortization. Net financial items totaled positive DKK 7.178 million, compared to a restated negative DKK 11.514 million in FY 2024/25. Tax expense was DKK 56.337 million (21.80% effective tax rate, versus 23.83% restated in FY 2024/25), generating a consolidated net profit of DKK 201.836 million (+15.54% against restated FY 2024/25 net profit of DKK 174.697 million; +8.28% against the unadjusted historical base of DKK 186.405 million). Basic and diluted earnings per share (EPS) stood at DKK 11.60.
Table Consolidated Financial, Operating, and Cash Flow Analysis (FY2024/25–FY2025/26)
| Consolidated Financial & Operating Ledger | FY 2024/25 (Reported) | FY 2024/25 (Restated) | FY 2025/26 (Audited) | YoY Change (Restated Base) | Key Audit & Strategic Notes |
| Total Revenue (DKK '000) | 495,572 | 495,572 | 511,057 | +3.12% | Constant-FX expansion +7.00%; 388 bps FX drag |
| Analytical Instruments | 143,339 | 143,339 | 161,757 | +12.85% | XcytoMatic platform surged 123.1% to DKK 61.8m |
| Consumables & Disposable Cassettes | 230,792 | 230,792 | 221,816 | -3.89% | US shutdown drag; autologous throughput pause |
| Specialized Services & Software | 117,227 | 117,227 | 121,657 | +3.78% | Maintenance contracts and validation services |
| Other Ancillary Revenue | 4,214 | 4,214 | 5,827 | +38.28% | Freight adjustments and custom accessories |
| Operating Business Areas (DKK '000) | |||||
| Area 1: Life Science, CGT & Bioprocess (LCB) | 456,800 | 456,800 | 484,700 | +6.11% | Share expanded from 92.18% to 94.84% (+266 bps) |
| Area 2: Semen, Beer & Milk QC | 38,772 | 38,772 | 26,357 | -32.02% | Share dropped from 7.82% to 5.16%; SP-100 sunset |
| Revenue Nature Mix (DKK '000) | |||||
| Recurring Revenue (Consumables + Services) | 348,019 | 348,019 | 343,473 | -1.31% | Share contracted 302 bps from 70.23% to 67.21% |
| Non-Recurring Revenue (Instruments + Other) | 147,553 | 147,553 | 167,584 | +13.58% | Share expanded 302 bps from 29.77% to 32.79% |
| Earnings Performance (DKK '000) | |||||
| Gross Profit | 465,509 | 465,509 | 485,994 | +4.40% | Gross margin reached 95.10% (+117 bps) |
| EBITDA | 258,048 | 258,048 | 281,251 | +8.99% | EBITDA margin reached 55.03% (+296 bps) |
| Operating Profit (EBIT) | 236,516 | 236,516 | 250,995 | +6.12% | EBIT margin reached 49.11% (+138 bps) |
| Net Financial Items | +3,497 | -11,514 | +7,178 | N/A | FY25 restated for DKK 15.0m intercompany FX error |
| Net Profit for the Fiscal Year | 186,405 | 174,697 | 201,836 | +15.54% | Net margin expanded 425 bps to 39.50% |
| Balance Sheet & Working Capital (DKK '000) | |||||
| Total Consolidated Assets | 828,046 | 839,461 | 860,899 | +2.55% | DKK 11.4m upward restatement on FY25 inventory |
| Cash and Cash Equivalents | 341,849 | 341,849 | 290,170 | -15.12% | Excludes DKK 3.39m in short-term securities |
| Inventories | 109,336 | 120,751 | 126,214 | +4.52% | DKK 69.0m (54.67%) held with cycle >12 months |
| Raw Materials and Consumables | 82,253 | 93,668 | 100,355 | +7.14% | Strategic buffer against supply bottlenecks |
| Finished Goods and Goods for Resale | 27,083 | 27,083 | 25,859 | -4.52% | Packaged cassettes and assembled instruments |
| Capitalized Indirect Production Costs | 3,000 | 3,000 | 2,550 | -15.00% | Overhead allocation to inventory valuation |
| Trade Receivables | 79,618 | 79,618 | 89,603 | +12.54% | Past due >90 days: DKK 8.8m; loss reserve DKK 1.2m |
| Trade Payables | 16,079 | 16,079 | 38,051 | +136.65% | Supplier credit expansion for automated series |
| Contractual Obligations (Deferred Revenue) | 54,863 | 54,863 | 47,477 | -13.46% | 12-month prepaid GMP service & validation tiers |
| Net Working Capital (NWC Definition) | 109,407 | 120,822 | 132,359 | +9.55% | Working capital expanded by DKK 11.5m YoY |
| Days Sales Outstanding (DSO) | 58.6 days | 58.6 days | 64.0 days | +5.4 days | Extended collection cycles on automated units |
| Days Inventory Outstanding (DIO) | 612.7 days | 676.7 days | 727.4 days | +50.7 days | Average DIO: 711.7 days; multi-year safety stocks |
| Days Payables Outstanding (DPO) | 90.1 days | 90.1 days | 219.3 days | +129.2 days | Structural elongation of raw material vendor terms |
| Cash Flow & Capital Deployment (DKK '000) | |||||
| Cash Flow from Operating Activities (OCF) | 207,449 | 207,449 | 210,356 | +1.40% | Tax paid: DKK 61.5m; NWC drag: DKK 12.6m |
| Tangible Capital Expenditure (PP&E) | -29,867 | -29,867 | -28,311 | -5.21% | Allerød campus modernization and CNC tooling |
| Intangible Capital Expenditure (R&D/Software) | -34,868 | -34,868 | -68,091 | +95.28% | XM50, SMS robotics, and XM Octopus software |
| Total Organic Capital Expenditure | -64,735 | -64,735 | -96,402 | +48.92% | CapEx intensity reached 18.86% of total revenue |
| Acquisition Outlay (Ovizio SA Acquisition) | -20,785 | -20,785 | 0 | -100.0% | Closed Oct 2024 for EUR 2.8m (DKK 21.1m) |
| Organic Free Cash Flow (FCF) | 142,714 | 142,714 | 113,954 | -20.15% | FCF conversion of EBITDA compressed to 40.52% |
| Return on Invested Capital (ROIC) | 71.0% | 69.8% | 59.3% | -1,050 bps | Invested capital expanded 20.06% to DKK 462.0m |
| Return on Equity (ROE) | 30.1% | 30.7% | 28.0% | -270 bps | Total equity base rose to DKK 725.4 million |
| Net Cash Position | 335,444 | 335,445 | 285,582 | -14.86% | Bank cash DKK 290.2m + securities DKK 3.4m |
| Net Cash to EBITDA Multiple | -1.3x | -1.3x | -1.0x | +0.3x | Zero financial bank borrowings; lease debt DKK 4.6m |
| Proposed Equity Dividend (DKK '000) | 121,817 | 121,817 | 0 | -100.0% | Distribution suspended (DKK 7.0/sh paid for FY25) |
| Treasury Share Buyback Outlay (DKK '000) | 0 | 0 | 38,554 | N/A | 105,000 shares acquired at DKK 367.18/share |
Segment allocations show the Life Sciences, Cell & Gene Therapy, and Bioprocessing (LCB) core business area generating DKK 484.7 million in FY 2025/26 (94.84% of revenue), expanding 6.11% YoY. Core LCB consumables held steady at DKK 197.4 million (compared to DKK 199.1 million in FY 2024/25, a 0.86% contraction). Conversely, Business Area 2 (production control of animal semen, beer, and milk) contracted 32.02% to DKK 26.357 million (5.16% of revenue), with consumables in this segment dropping 22.95% (-DKK 7.27 million to DKK 24.41 million). ChemoMetec ceased active sales of the SP-100 instrument (total global livestock semen cell counting market estimated at DKK 50–100 million) and merged beer (YC-100) and somatic milk counting (SCC-100) into Area 2, maintaining SP1 cassette production strictly to harvest cash flows from the mature installed base.
Consolidated recurring revenue (consumables plus service agreements) contracted by 302 basis points from 70.23% to 67.21% of group turnover. This shift was governed by capital instrument placements (+12.85%) outpacing recurring revenue (-1.31%). Because customer adoption of automated cell counting systems requires a 12-to-24-month qualification cycle and up to 48 months for full commercial deployment, consumable utilization lags initial instrument placement. Service and validation contracts increased 3.78% to DKK 121.657 million, while year-end contractual deferred service liabilities totaled DKK 47.477 million (down from DKK 54.863 million in FY 2024/25).
Geographic Footprint and Manufacturing Architecture
ChemoMetec operates a highly export-oriented commercial footprint, generating over 97% of consolidated turnover outside Denmark across more than 100 countries. No single client accounts for more than 10% of gross revenue, though the corporate customer roster encompasses virtually all top-50 global pharmaceutical and biotechnology entities.
In North America, FY 2025/26 revenue contracted 5.45% in reported DKK to DKK 276.829 million (+1.00% constant currency, reflecting a 645 basis point dollar translation drag). Instrument sales fell 3.32% to DKK 77.250 million due to volume slowdowns in older NC-200 and NC-3000 units, even as regional XcytoMatic platform sales expanded 59.7% to DKK 33.7 million. Regional consumable turnover declined 10.67% to DKK 115.692 million, driven by the Autumn 2025 US Federal Government shutdown and temporary drops in treated patient volumes across commercial CAR-T sites. Services were stable at DKK 79.725 million (-0.68%), and other revenue totaled DKK 4.162 million (+33.61%). Consumables and services represented over 70% of total North American turnover. To support deployment, ChemoMetec reorganized the United States into four autonomous commercial regions, expanding its direct team to 34 full-time employees (out of 52 total international field staff) and opening a regional office in San Francisco to supplement hubs in Long Island, Boston, and San Diego.
European turnover grew 14.13% to DKK 181.422 million, representing 35.50% of group revenue with minimal currency variance due to the DKK/EUR peg. Instruments expanded 28.60% to DKK 59.314 million, with XcytoMatic generating DKK 23.9 million (40.3% of regional equipment revenue) while the NC-202 remained the primary unit volume contributor. Consumables climbed 5.96% to DKK 80.052 million, led by commercial CAR-T cell therapy batches in Belgium (+33% regional consumables) and the UK. Services rose 11.72% to DKK 40.599 million, and other sales reached DKK 1.457 million (+53.85%). The top five European markets generated 72% of regional turnover. Performance highlights include the United Kingdom (+18.0% to DKK 39.3 million, with instrument sales up 117% and XcytoMatic delivering DKK 5.6 million), Germany (+62.4% to DKK 30.7 million, instrument turnover up >120% with bioprocessing comprising 25% of placements), and France (+50.4% to DKK 17.9 million, where the NC-202 accounted for 52% and XcytoMatic 29% of equipment revenue). Conversely, the Netherlands contracted 18.4% to DKK 19.9 million due to site consolidations, while Denmark fell DKK 9.5 million to approximately DKK 11.6 million after a major domestic customer shuttered its cell therapy operations. Direct subsidiaries operate via ChemoMetec GmbH in Germany, ChemoMetec SAS in France, and Ovizio Imaging Systems SA in Belgium.
Rest of World (ROW / Asia-Pacific) revenue rose 20.53% to DKK 52.807 million (~+23% constant currency), accounting for 10.33% of consolidated turnover. Instruments jumped 45.50% to DKK 25.193 million, consumables rose 1.34% to DKK 26.072 million, services advanced 115.70% to DKK 1.333 million, and other sales totaled DKK 208 thousand (+36.84%). The top five markets represented 81% of ROW revenue: China expanded 37.8% to DKK 16.4 million (equipment sales grew >180%), Japan rose 38.8% to DKK 13.6 million (instruments +35%, consumables +13%), South Korea fell 12.5% to DKK 4.9 million, Singapore grew 157% to DKK 4.4 million, and Taiwan contracted 10.3% to DKK 3.5 million. Distribution in ROW is executed through indirect third-party distributors supported technically by Allerød-based product managers.
Physical manufacturing is concentrated at the corporate campus in Allerød, Denmark (Gydevang 43), operating on 100% green electricity. Property, plant, and equipment carrying value reached DKK 126.6 million following the refurbishment of an adjacent property acquired in 2021. Core manufacturing capabilities include:
* Cassette Manufacturing: Fully automated single-use cassette assembly lines in Allerød. A newly commissioned line fully automated foil-bag packaging into secondary cartons. Machinery was converted from pneumatic air to servo-controlled, power-steered systems to reduce scrap and power consumption.
* Slide and Cuvette Fabrication: Disposable 2- and 8-chamber glass slides for legacy NC-250 and NC-3000 instruments are sourced from a specialized partner in the Netherlands. In late 2024, ChemoMetec verticalized glass fabrication by commissioning an in-house semi-automated manufacturing unit in Allerød to produce glass analysis chambers for the relaunched Xcyto 5.
* Test Kits and Calibration Lines: Manufacturing of analytical verification test kits used in annual GMP preventative maintenance is executed on an upgraded automated line commissioned in Allerød during FY 2025/26.
* Outsourcing Ecosystem: Cassette shells are precision-molded by external Danish injection molding contractors using automated tooling. Liquid fluorophores and reagents are formulated by an outsourced contract chemical manufacturer in Denmark, while ChemoMetec retains 100% of analytical quality control release testing in-house. Printed circuit boards and optics are sourced from European Tier-1 sub-suppliers.
* Maritime Supply Route: Transatlantic logistics between Allerød and the US distribution warehouse on Long Island, New York, rely almost exclusively on containerized sea freight, mitigating carbon emissions and shipping cost volatility. The 10-to-20-day ocean transit cycle necessitates higher localized safety stocks.
* Balance Sheet Buffer: Inventories held with an expected realization cycle exceeding 12 months rose to DKK 69.0 million (54.67% of total stock) at 30 June 2026, up from a restated DKK 63.0 million (and DKK 44.0 million originally reported) in FY 2024/25. Finished goods fell 4.52% to DKK 25.859 million, while raw materials rose 7.14% to DKK 100.355 million. Annual inventory write-downs dropped to DKK 350 thousand (0.28% of stock), down from DKK 1.220 million in FY 2024/25 and DKK 2.040 million in FY 2023/24, with zero historical reversals.
ChemoMetec holds 26 patent families and 172 issued patents globally (including 26 in the US), up from 24 families and 163 patents in FY 2024/25. The technology portfolio was expanded via the October 2024 acquisition of Ovizio Imaging Systems SA for EUR 2.8 million (DKK 21.1 million), which added 15 engineering specialists in Belgium and proprietary digital holographic label-free microscopy. Platform specifications and commercialization schedules are outlined below:
Table R&D AND COMMERCIAL PLATFORM SPECIFICATION MATRIX
|
System / Unit |
Analytical Engine |
Launch Window |
Commercial Alignment |
|---|---|---|---|
|
NucleoCounter® NC-200 (Legacy) |
Dual-fluorescence; Via1-Cassette; 45–50-second cycle time |
Introduced in 2011; commercial end-of-sale in April 2027; support expires in 2029 |
Fleet retirement target; 16-year commercial run; support expires in 2029 |
|
NucleoCounter® NC-202 (Bridge) |
Advanced optical train; Via2-Cassette; 25-second cycle time |
Active baseline; currently in commercial distribution |
European best-seller; standardized mammalian cell counting |
|
NucleoCounter® NC-203 (Next-Gen) |
AI contrast/brightfield plus fluorescence; cassette mechanism |
Soft launch in 1H FY2025; scaled shipments in 2H FY2025 and FY2026 |
Direct replacement for NC-200, with backward-compatible counting algorithms |
|
Cleanroom Module NC 007-GT |
Fan-free processing; wireless tablet; docks under NC-203 |
R&D started in FY2026; commercial release targeted for 2027 |
Eliminates turbulence in Grade A/B cleanrooms; supports external data logging |
|
XcytoMatic® 30 (XM30) & XM R1 |
Reusable quartz flow cuvette; auto-wash; automated fluidics |
Commercialized; XM R1 barcode module to be bundled in 2H 2026 |
Replaces single-use plastics, reducing their use by 95%–97%; supports OEM robotic cells |
|
XcytoMatic® 40 (XM40) |
Semi-automated; 24-sample carousel; capacity of up to 100 million cells/mL |
Commercialized; driving bioprocess sales in Germany and the UK |
Bioprocess replacement for legacy multi-sample carousels being phased out |
|
XcytoMatic® 50 & Sample Management System (SMS) |
96-well microplate; internal robotic arm; automatic plate conveyor |
Prototype targeted for Q2 FY2027; serial production in FY2028 |
Replaces manual sample handling; delayed from FY2026 to prioritize NC-203 |
|
XM Octopus® Enterprise Suite |
Cloud-based fleet control; 21 CFR Part 11 compliance; open APIs for LIMS/MES |
Development underway; commercial launch deferred to mid-2027 |
Eliminates cleanroom laptops; enables centralized remote audit trails |
ChemoMetec established strategic integration alliances to embed the XM30 into broader laboratory workflows:
* Tecan Group: Co-engineered integration of the XM30 into the Tecan Fluent® automated liquid handling workstation, validated at Atanis Biotech AG for automated cell culture and continuous allergy testing (FAST-PASE).
* Roche Diagnostics: Executed a co-development agreement linking the Roche Cedex Bio Analyzer with the XM30 to integrate enzymatic metabolite assays with automated fluorescence cell counting.
HDIN Institutional Verdict
ChemoMetec displays exceptional gross profitability (95.10%) and robust cash generation, supported by a net cash balance of DKK 285.582 million (DKK 290.170 million cash plus DKK 3.390 million liquid securities against DKK 4.6 million total lease liabilities). However, forensic analysis reveals accounting, governance, and operational complexities that warrant investor scrutiny.
The company's earnings resilience is partially supported by aggressive R&D capitalization under IAS 38. In FY 2025/26, ChemoMetec incurred DKK 66.676 million in organic development costs, of which DKK 66.640 million was capitalized on the balance sheet, representing a capitalization rate of 99.95% (compared to 97.54% in FY 2024/25, when DKK 31.672 million of DKK 32.472 million was capitalized). Pure research expensed directly to the P&L dropped to DKK 36 thousand from DKK 800 thousand. Intangible assets rose 36.04% to DKK 208.192 million (comprising DKK 71.488 million in completed projects, DKK 125.352 million in development in progress, DKK 3.991 million in patents and licenses, and DKK 7.361 million in Ovizio goodwill), representing 24.18% of total assets. Deloitte flagged development asset valuation as a Key Audit Matter (WACC: 7.9% in FY 2025/26; 8.0% in FY 2024/25). While zero impairment was booked, the ongoing commercialization of the XM50 and XM Octopus will translate these capitalized balances into higher P&L amortization charges in FY 2027/28 and FY 2028/29.
Operational inventory metrics also diverge from standard manufacturing averages. Days Inventory Outstanding (DIO) expanded by 50.7 days to 727.4 days (calculated against net COGS), with average DIO reaching 711.7 days. While standard industrial benchmarks would interpret >700 days DIO as an indicator of product obsolescence, ChemoMetec uses inventory buffering as a strategic moat. Management holds DKK 69.0 million of stock (54.67% of total carrying inventory) with expected realization beyond 12 months to insulate biopharmaceutical clients against component stockouts. However, the accumulation of raw materials (DKK 100.355 million) during a period of slowing consumable sales (-3.89%) highlights the working capital absorption required to support its dual product lines. Days Sales Outstanding (DSO) lengthened from 58.6 to 64.0 days, while Days Payables Outstanding (DPO) expanded to 219.3 days (from 90.1 days), reflecting extended vendor financing on raw material procurement.
Corporate governance disclosures reveal structural internal control constraints. In the annual reports, ChemoMetec explicitly notes: *"ChemoMetec’s organisation is relatively small, with relatively few employees to undertake administrative tasks such as bookkeeping, accounting records and reconciliations. The limited size of the organisation makes it difficult to maintain proper segregation of duties in some areas."*
This vulnerability led to a prior-period accounting error correction under IAS 8 in FY 2025/26:
* Currency Translation Adjustment: DKK 15.0 million pre-tax in foreign exchange losses on intercompany balances between subsidiaries with different functional currencies was erroneously booked directly to equity rather than the income statement in FY 2024/25. Restating this increased FY 2024/25 financial expenses from -DKK 2.373 million to -DKK 17.373 million.
* Inventory Intercompany Profit Elimination: Subsidiary inventory failed to eliminate intra-group profit margins, understating FY 2024/25 ending inventory by DKK 11.415 million. This was corrected by raising opening inventories from DKK 109.336 million to DKK 120.751 million with an offsetting credit to the equity currency reserve.
* Bottom-Line Earnings Revision: After a DKK 3.302 million tax correction, FY 2024/25 consolidated net profit was restated downward by DKK 11.708 million (from DKK 186.405 million to DKK 174.697 million), reducing reported EPS from DKK 10.71 to DKK 10.04. In the Parent Company accounts, FX corrections were partially embedded in revenue (+DKK 9.2 million correction) and financial items (-DKK 16.8 million), lowering parent net profit by DKK 6.0 million to DKK 258.1 million.
Governance oversight is further complicated by Board composition and auditor tenure:
* Board Independence: Two of five board members (40%) are non-independent under Nasdaq Copenhagen rules. Deputy Chairman Martin Glensbjerg is a co-founder and former senior employee within the five-year cooling-off window. Board Chairman Niels Thestrup is non-independent as a partner in Kønig Advokater I/S, which provides legal counsel to ChemoMetec.
* Related-Party Legal Retainers: Note 5.6 discloses legal fees paid to Kønig Advokater I/S of DKK 645 thousand in FY 2025/26, DKK 499 thousand in FY 2024/25, and DKK 785 thousand in FY 2023/24, with outstanding trade payables owed to the firm of DKK 600 thousand at 30 June 2026 (down from DKK 2.43 million in FY 2024/25).
* Committee Entrenchment: Chairman Niels Thestrup sits on all three standing committees: Audit (chaired by Betina Hagerup), Nomination (chaired by Kristine Færch), and Remuneration (chaired by Peter Reich). Placing a non-independent commercial service provider on the Audit Committee departs from institutional corporate governance best practices.
* Executive Turnover: Martin Helbo Behrens (born 1992) became CEO in March 2024. Kim Nicolajsen was appointed CFO on 1 July 2024 and stepped down on 3 August 2026. Phillip Massie Price (born 1992) assumed the CFO role in August 2026. This followed DKK 4.34 million in termination payments to outgoing executives in FY 2023/24.
* Auditor Tenure and Independence: Statutory auditor Deloitte Statsautoriseret Revisionspartnerselskab has served continuously for 24 years (appointed 31 August 2001). In FY 2025/26, non-audit fees accounted for 56.5% of Deloitte's remuneration (DKK 796 thousand non-audit vs. DKK 613 thousand audit), compared to 55.0% in FY 2024/25 (DKK 683 thousand non-audit vs. DKK 559 thousand audit).
* Unhedged FX Exposure (Note 4.7): ChemoMetec does not employ derivative hedging. Balance sheet net currency exposure at 30 June 2026 totaled DKK 104.574 million (USD net 55.223 million; EUR net 43.943 million; GBP net 5.408 million), creating a DKK 10.457 million pre-tax sensitivity per 10% currency swing. In the Parent Company balance sheet, unhedged USD exposure stood at DKK 125.9 million due to DKK 131.0 million in intercompany balances from ChemoMetec Inc., yielding a DKK 12.6 million pre-tax sensitivity.
Capital allocation shifted in May 2026: after paying a dividend of DKK 7.00 per share (DKK 121.817 million, 69.73% of restated net profit) for FY 2024/25, the Board eliminated the dividend for FY 2025/26 (0% payout). The company redirected cash flow into an open-market Share Buy-Back Programme (authorizing up to 500,000 shares / 2.87% of share capital, capped at DKK 100 million). By 30 June 2026, ChemoMetec had repurchased 105,000 shares for DKK 38.554 million (average price DKK 367.18 per share; expanding to 201,600 shares or 1.16% of capital by 6 September 2026). This repurchase activity coincided with a 38.03% decline in ChemoMetec's share price from DKK 584.50 to DKK 362.20 during the fiscal year. Insider purchases mirrored this repositioning: all seven directors and executives increased their shareholdings (net insider acquisitions totaled 76,275 shares in FY 2025/26, with Martin Glensbjerg acquiring 71,400 shares) with zero insider sales recorded.
At the shareholder level, BlackRock, Inc. remains the sole disclosed institutional investor holding ≥5% of the 17,402,479 total issued shares (all single-class, one-vote shares; no ownership caps). SEB Investment Management AB / SEBinvest A/S, which held ≥5% at 30 June 2025, trimmed its position below the 5% threshold during FY 2025/26. Total registered shareholders rose from 15,901 (97.4% capital coverage) to 18,848 (95.8% capital coverage). Management confirmed no claims or threats of claims at the balance sheet date under Note 5.3; warranty provisions stood at DKK 3.65 million in FY 2025/26 (down from DKK 4.68 million in FY 2024/25), with zero provisions recorded for IP infringement or patent litigation.
For FY 2026/27, corporate guidance targets revenue of DKK 545–575 million (+6.6% to +12.5% reported growth) and EBITDA of DKK 300–315 million (+6.7% to +12.0% growth, preserving a 54.8% to 55.0% EBITDA margin corridor). The forward trajectory relies on an expanded DKK 120 million investment envelope (up from DKK 96.4 million organic CapEx and ~DKK 100 million in FY 2025/26). Operational delivery requires successful commercialization of the NC-203 to replace the installed NC-200 base ahead of its April 2027 end-of-sale and 2029 support termination dates, resolving 3-to-5-year enterprise customer validation cycles for automated platforms, and managing integration timelines for the delayed XM50 and Sample Management System into FY 2027/28.
Presentation Download & Video Access:
* Presentation Download: Click the PDF download link under 'Related Topics' to access the full institutional presentation of this report.
* Video Link: Click this link to watch the HDIN analyst briefing on YouTube.
About HDIN Research:
HDIN Research is a premier global market intelligence and strategic advisory firm specializing in institutional-grade financial analysis, supply chain audits, and macroeconomic forecasting. Our dedicated sector analysts deliver actionable, data-driven insights tailored for private equity, hedge funds, and corporate strategy teams. Visit us at http://www.hdinresearch.com.
2026 AI Transparency Footer:
"This intelligence report was authored by HDIN Research analysts following a rigorous audit of official corporate filings. AI was utilized for massive-scale data synthesis and structural drafting, ensuring 100% inclusion of reported data points. All strategic insights, financial modeling, and final verdicts were verified by our editorial board to ensure professional accuracy and compliance with 2026 Google Search E-E-A-T standards."