Changsha Technology Research Institute of BeiDou Industry Safety Group Co., Ltd.: Defense Instrumentation Pivot Toward Commercial LEO Constellations and Export Markets Expands Operating Backlog as Capacity Hits 124.27%
Date : 2026-10-19
Reading : 368
HDIN Executive Takeaways
1. Operating cash flow conversion reached 119.21% of net profit in 2025 following State Council prompt-payment enforcement, balancing structural H1 operating cash burn of -RMB 55.23M caused by defense procurement cycles where over 70% of revenue is recognized in H2.
2. Capacity utilization based on quota labor hours reached 124.27% in 2026 H1, accelerating an RMB 578.87M STAR Market IPO capital allocation to add 9,100 m² of operational floor space across facilities in Changsha and Xi'an.
3. Provisional defense pricing accounted for 25.23% of 2025 revenue, exposing receivables to multi-year retrospective audit adjustments across state defense accounts where receivables aged over two years climbed to RMB 66.24M.
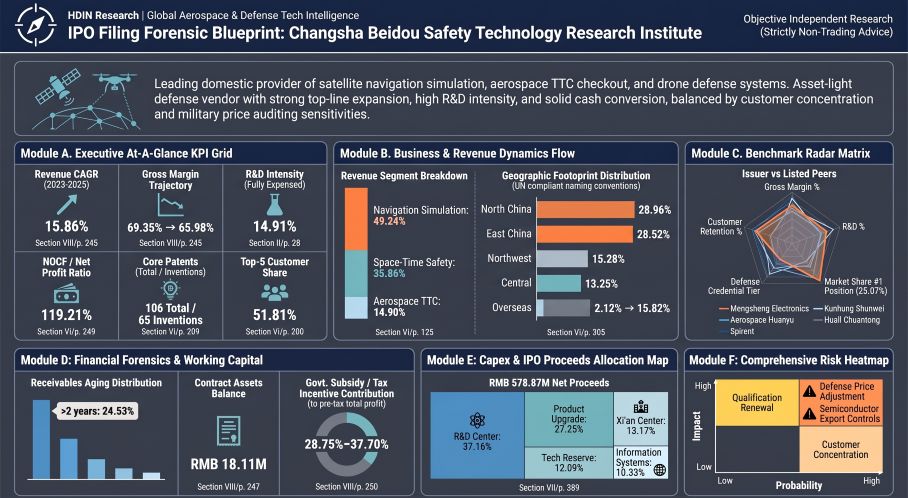
Figure IPO Filing Forensic Blueprint Changsha Beidou Safety Technology Research Institute
 Segmental Operating Dynamics and Gross Margin Bifurcation
Changsha Technology Research Institute of BeiDou Industry Safety Group Co., Ltd. [STAR: Pending] generated revenue of RMB 285.04M in 2023, RMB 323.42M in 2024 (+13.46% YoY), RMB 382.60M in 2025 (+18.30% YoY), and RMB 142.31M in 2026 H1. Retrospective accounting adjustments executed in October 2026 revised 2025 revenue upward by RMB 1.71M (+0.45%) and 2024 revenue downward by RMB 1.88M (-0.58%) due to delivery cut-off timing. Consolidated gross margin shifted from 69.35% in 2023 to 63.35% in 2024 (-600 bps), 59.92% in 2025 (-343 bps), and recovered to 65.98% in 2026 H1 (+606 bps).
Margin dilution through 2025 was driven by project mix within Navigation Simulation Test Systems (45.46% gross margin in 2025), where large integration contracts—including project PC-PRJ103762 for Jinwei IC (RMB 14.99M revenue; 35.58% gross margin) and project PC-PRJ103348 for China Aerospace Science and Industry Corporation [CASIC] (RMB 7.71M revenue; 33.07% gross margin)—required external procurement of dark room chambers, vector signal generators, SLT test rigs, and EMI receivers. Gross margin recovered to 65.98% in 2026 H1 due to standalone Navigation Signal Simulators rising to 39.71% of total revenue at a 77.92% gross margin.
Cost of Goods Sold (COGS) expanded from RMB 86.74M in 2023 to RMB 117.91M in 2024 (+35.91%) and RMB 152.84M in 2025 (+29.63%), totaling RMB 48.09M in 2026 H1.
Pricing dynamics diverged across product categories. Drone Countermeasure Devices experienced an ASP increase of 233.16% in 2025 to RMB 339.8k per set, reaching RMB 503.7k per set in 2026 H1, driven by military-grade anti-drone interception systems and high-specification export configurations. Satellite TTC Ground Checkout unit prices decreased from RMB 966.4k per set in 2023 to RMB 721.0k in 2025 and RMB 634.9k in 2026 H1 as customer procurement transitioned from non-recurring prototype designs to series checkout instruments for commercial LEO constellations.
Table Product-Line Sales Volume, Average Selling Price, and Revenue (FY2023–H1 2026)
Fixed-type military supplies executed under provisional pricing models expanded materially in 2025. Final contract prices are subject to military pricing audits, with retrospective adjustments recognized in the profit and loss statement during the period of formal certification.
Table Provisional-Pricing Contract Revenue and Revenue Contribution (FY2023–H1 2026)
Infrastructure Layout, Supply Chain Localization, and Capital Deployment
Production capacity evaluated by Quota Labor Hours demonstrates continuous over-utilization across all reporting intervals, driven by assembly line overtime and the deployment of engineering R&D staff to system integration workflows.
Table Production Capacity, Labor-Hour Utilization, and Expansion Strategy (FY2023–H1 2026)
The company's operating footprint is anchored by an owned 41,010.87 m² manufacturing facility in Yuelu District, Changsha (held via Matrix Equipment), an owned 2,935.60 m² research facility in CEC Software Park Phase I, Changsha, and a 27,864.47 m² industrial land parcel in Xiangjiang New District. Regional operations are conducted through leased space in Hangchuang International Plaza C Tower in Xi'an National Civil Aerospace Industrial Base (Xi'an Tianheng), alongside customer liaison and engineering offices in Beijing (Fengtai/Chaoyang), Shanghai (Songjiang), Shenzhen, and Chongqing.
To relieve capacity constraints, the company formulated an RMB 578.87M STAR Market capital deployment structure across five designated projects totaling RMB 610.81M in gross capital requirements.
Table Fundraising Proceeds Allocation and Investment Project Plan
Raw material procurement expanded from RMB 93.74M in 2023 to RMB 165.08M in 2025. Sourcing is executed on demand based on specific sales Bill of Materials (BOM), supplemented by a rolling safety stock buffer of specialized FPGA chips.
Table Procurement Breakdown by Category and Supplier Sourcing (FY2023–H1 2026)
To counter foreign semiconductor export licensing constraints, the company transitioned its simulator architecture from separate "Host + DSP + FPGA" setups to a single ARM+FPGA SoC design, and subsequently to an RFSOC direct-sampling architecture. It also launched an RMB 10.15M domestic RF System-in-Package (SiP) project and finished a 100% domestic component redesign of the C1 module in 2024.
Top five customer concentration accounted for 47.25% (2023), 42.88% (2024), 51.81% (2025), and 50.22% (2026 H1) of revenue, with no single customer group exceeding 18.8%. Sales are conducted through direct contracting (>94.98% to 99.58% of revenue).
Table Top Five Customers by Sales Revenue and Customer Concentration (FY2023–H1 2026)
Geographic revenue reflects defense industry clustering in North China and East China, with export sales expanding to 15.82% of total revenue in 2026 H1. All territorial metrics follow United Nations geographic nomenclature.
Table Regional Revenue Breakdown and Customer Concentration (FY2023–H1 2026)
HDIN Institutional Verdict
Forensic analysis indicates that the company's balance sheet contains minimal debt risk, with an asset-liability ratio between 19.57% and 23.47%, zero long-term bank debt, and an interest coverage ratio above 190x across all reported periods. Liquidity is supported by RMB 504.72M in cash and structured wealth instruments as of June 30, 2026.
Operating cash flow conversion highlights an operational scissor gap driven by defense delivery seasonality. In 2023–2025, operating cash flow expanded to RMB 130.15M (119.21% of net profit), supported by prompt-payment regulations for SMEs and an RMB 34.44M increase in customer advances. Conversely, 2026 H1 generated -RMB 55.23M in net operating cash flow due to the timing mismatch of steady operational expenditures (RMB 54.42M in H1 payroll; RMB 24.79M in taxes) against seasonal collections, combined with an RMB 28.07M inventory build and RMB 53.36M in supplier payables settlements.
Receivables balances represent the core asset exposure. Accounts receivable book value plus contract assets totaled RMB 253.62M in 2026 H1 (26.73% of current assets). The aging schedule displays structural aging, with accounts aged over two years reaching RMB 66.24M by year-end 2025 (24.53% of portfolio balance), with over 70% concentrated across units of CETC, CASIC, and China Aerospace Science and Technology Corporation [CASC].
Earnings purity shows dependence on policy-driven state incentives. Government subsidies and tax benefits (15% High-Tech Enterprise income tax status and VAT software refunds exceeding a 3% effective rate per CaiShui [2011] No. 100) constituted between 24.12% and 37.70% of total pre-tax profit. Core deducted net profit attributable to parent expanded at a 23.33% CAGR from RMB 75.50M in 2023 to RMB 93.12M in 2025. DuPont decomposition confirms that Return on Equity (13.10% in 2025) is driven by net profit margins (28.13% in 2025), while asset turnover decreased from 0.4300x to 0.3534x due to asset expansion outpacing top-line recognition. Financial leverage remained conservative at an equity multiplier of 1.3146x in 2025. R&D accounting reflects zero capitalization (100% expensed directly into profit and loss). Cumulative R&D spending from 2023 to 2025 totaled RMB 147.80M (14.91% of revenue), exceeding the STAR Market Criterion #1 threshold (5.00% or RMB 80.00M).
The company's governance structure centers on seven joint actual controllers—Zhong Xiaopeng (19.41%), Ming Dexiang (19.41%), Liu Zhijian (16.73%), Tian Mei (15.37%), Yang Jianwei (11.78%), Qiao Chunjie (8.65%), and Liu Chunyang (8.65%)—who hold 58.56% of pre-IPO voting control via holding entities Guoke Defense (39.57%), Changsha Tianquan (12.96%), and four ESOP platforms (6.03%: Changsha Langlu 2.01%, Hunan Daocai 1.85%, Changsha Hangce 1.52%, and Changsha Jianshan Landian 0.64%). Institutional investors include Dachen PE Group (10.22%), CETC Investment (4.10%), defense/regional funds (11.55%), and cyber/industrial venture capital funds (2.16%).
Five of the six core technical scientists (Ming Dexiang, Zhong Xiaopeng, Liu Zhijian, Yang Jianwei, Qiao Chunjie) are former research personnel and faculty members at the National University of Defense Technology (NUDT) who completed formal military transition protocols between 2015 and 2018. The issuer holds 106 authorized patents (65 invention patents; 45 original and 20 transferred) and 109 software copyrights, with zero co-owned patents and no recorded intellectual property disputes with military or academic institutions.
Historical nominee holding arrangements were remediated: equity held by founders' relatives in Guoke Defense was transferred back by April 2018, and partnership shares held by six nominee individuals across three ESOP platforms were refunded and notarized by the Changsha Notary Public Office in May 2023. All Valuation Adjustment Mechanisms (VAM) and investor buyback rights were retroactively annulled, and the Supervisory Board was replaced on August 5, 2025, with governance authority transferred to the Board Audit Committee in compliance with revised PRC Company Law provisions.
Presentation Download & Video Access
- Presentation Download: Click the PDF download link under 'Related Topics' to access the full institutional presentation of this report.
- Video Link: Click this link to watch the HDIN analyst briefing on YouTube.
About HDIN Research
HDIN Research is a premier global market intelligence and strategic advisory firm specializing in institutional-grade financial analysis, supply chain audits, and macroeconomic forecasting. Our dedicated sector analysts deliver actionable, data-driven insights tailored for private equity, hedge funds, and corporate strategy teams. Visit us at http://www.hdinresearch.com.
2026 AI Transparency Footer
"This intelligence report was authored by HDIN Research analysts following a rigorous audit of official corporate filings. AI was utilized for massive-scale data synthesis and structural drafting, ensuring 100% inclusion of reported data points. All strategic insights, financial modeling, and final verdicts were verified by our editorial board to ensure professional accuracy and compliance with 2026 Google Search E-E-A-T standards."
1. Operating cash flow conversion reached 119.21% of net profit in 2025 following State Council prompt-payment enforcement, balancing structural H1 operating cash burn of -RMB 55.23M caused by defense procurement cycles where over 70% of revenue is recognized in H2.
2. Capacity utilization based on quota labor hours reached 124.27% in 2026 H1, accelerating an RMB 578.87M STAR Market IPO capital allocation to add 9,100 m² of operational floor space across facilities in Changsha and Xi'an.
3. Provisional defense pricing accounted for 25.23% of 2025 revenue, exposing receivables to multi-year retrospective audit adjustments across state defense accounts where receivables aged over two years climbed to RMB 66.24M.
Figure IPO Filing Forensic Blueprint Changsha Beidou Safety Technology Research Institute
Segmental Operating Dynamics and Gross Margin BifurcationChangsha Technology Research Institute of BeiDou Industry Safety Group Co., Ltd. [STAR: Pending] generated revenue of RMB 285.04M in 2023, RMB 323.42M in 2024 (+13.46% YoY), RMB 382.60M in 2025 (+18.30% YoY), and RMB 142.31M in 2026 H1. Retrospective accounting adjustments executed in October 2026 revised 2025 revenue upward by RMB 1.71M (+0.45%) and 2024 revenue downward by RMB 1.88M (-0.58%) due to delivery cut-off timing. Consolidated gross margin shifted from 69.35% in 2023 to 63.35% in 2024 (-600 bps), 59.92% in 2025 (-343 bps), and recovered to 65.98% in 2026 H1 (+606 bps).
Margin dilution through 2025 was driven by project mix within Navigation Simulation Test Systems (45.46% gross margin in 2025), where large integration contracts—including project PC-PRJ103762 for Jinwei IC (RMB 14.99M revenue; 35.58% gross margin) and project PC-PRJ103348 for China Aerospace Science and Industry Corporation [CASIC] (RMB 7.71M revenue; 33.07% gross margin)—required external procurement of dark room chambers, vector signal generators, SLT test rigs, and EMI receivers. Gross margin recovered to 65.98% in 2026 H1 due to standalone Navigation Signal Simulators rising to 39.71% of total revenue at a 77.92% gross margin.
Cost of Goods Sold (COGS) expanded from RMB 86.74M in 2023 to RMB 117.91M in 2024 (+35.91%) and RMB 152.84M in 2025 (+29.63%), totaling RMB 48.09M in 2026 H1.
Pricing dynamics diverged across product categories. Drone Countermeasure Devices experienced an ASP increase of 233.16% in 2025 to RMB 339.8k per set, reaching RMB 503.7k per set in 2026 H1, driven by military-grade anti-drone interception systems and high-specification export configurations. Satellite TTC Ground Checkout unit prices decreased from RMB 966.4k per set in 2023 to RMB 721.0k in 2025 and RMB 634.9k in 2026 H1 as customer procurement transitioned from non-recurring prototype designs to series checkout instruments for commercial LEO constellations.
Table Product-Line Sales Volume, Average Selling Price, and Revenue (FY2023–H1 2026)
| Product Line & Form | Metric | 2023 FY | 2024 FY | 2024 YoY | 2025 FY | 2025 YoY | 2026 H1 |
| Navigation Signal Simulators | Sales Volume (sets) | 164 | 203 | +23.78% | 218 | +7.39% | 121 |
| (Finished Equipment) | ASP (RMB 10k/set) | 41.26 | 41.82 | +1.34% | 36.67 | -12.31% | 46.62 |
| Revenue (RMB 10k) | 6,767.15 | 8,488.60 | +25.44% | 7,993.47 | -5.83% | 5,641.40 | |
| Drone Countermeasure Devices | Sales Volume (sets) | 248 | 209 | -15.73% | 203 | -2.87% | 49 |
| (Finished Equipment) | ASP (RMB 10k/set) | 12.49 | 10.20 | -18.31% | 33.98 | +233.16% | 50.37 |
| Revenue (RMB 10k) | 3,096.39 | 2,131.64 | -31.16% | 6,897.93 | +223.60% | 2,468.31 | |
| Drone Countermeasure Modules | Sales Volume (pcs) | 241 | 159 | -34.02% | 189 | +18.87% | 86 |
| (Components) | ASP (RMB 10k/pc) | 9.37 | 13.87 | +48.07% | 19.29 | +39.03% | 14.92 |
| Revenue (RMB 10k) | 2,257.91 | 2,205.66 | -2.31% | 3,645.11 | +65.26% | 1,283.49 | |
| Satellite TTC Ground Checkout | Sales Volume (sets) | 5 | 25 | +400.00% | 19 | -24.00% | 12 |
| (Finished Equipment) | ASP (RMB 10k/set) | 96.64 | 91.19 | -5.64% | 72.10 | -20.93% | 63.49 |
| Revenue (RMB 10k) | 483.19 | 2,279.66 | +371.80% | 1,369.92 | -39.91% | 761.91 |
Fixed-type military supplies executed under provisional pricing models expanded materially in 2025. Final contract prices are subject to military pricing audits, with retrospective adjustments recognized in the profit and loss statement during the period of formal certification.
Table Provisional-Pricing Contract Revenue and Revenue Contribution (FY2023–H1 2026)
| Provisional Pricing Indicators (RMB 10k / %) | 2023 FY | 2024 FY | 2025 FY | 2026 H1 |
| Provisional-Price Contract Revenue | 5,272.97 | 4,898.01 | 10,951.96 | 3,150.62 |
| Total Operating Revenue | 28,503.70 | 32,341.53 | 38,259.71 | 14,231.17 |
| Provisional-Price Contract Share of Revenue | 14.92% | 12.92% | 25.23% | 19.59% |
Infrastructure Layout, Supply Chain Localization, and Capital Deployment
Production capacity evaluated by Quota Labor Hours demonstrates continuous over-utilization across all reporting intervals, driven by assembly line overtime and the deployment of engineering R&D staff to system integration workflows.
Table Production Capacity, Labor-Hour Utilization, and Expansion Strategy (FY2023–H1 2026)
| Capacity Metric (Labor Hours) | 2023 FY | 2024 FY | 2025 FY | 2026 H1 | Expansion Strategy |
| Rated Capacity (Quota Hours) | 136,803.34 | 147,575.67 | 149,524.89 | 72,046.87 | +8,100 m² HQ facility (Changsha) |
| Actual Production Labor Hours | 159,062.55 | 175,325.93 | 185,213.69 | 89,531.67 | +1,000 m² facility (Xi'an) |
| Capacity Utilization Rate | 116.27% | 118.80% | 123.87% | 124.27% | Normalizes utilization to 85%–95% |
The company's operating footprint is anchored by an owned 41,010.87 m² manufacturing facility in Yuelu District, Changsha (held via Matrix Equipment), an owned 2,935.60 m² research facility in CEC Software Park Phase I, Changsha, and a 27,864.47 m² industrial land parcel in Xiangjiang New District. Regional operations are conducted through leased space in Hangchuang International Plaza C Tower in Xi'an National Civil Aerospace Industrial Base (Xi'an Tianheng), alongside customer liaison and engineering offices in Beijing (Fengtai/Chaoyang), Shanghai (Songjiang), Shenzhen, and Chongqing.
To relieve capacity constraints, the company formulated an RMB 578.87M STAR Market capital deployment structure across five designated projects totaling RMB 610.81M in gross capital requirements.
Table Fundraising Proceeds Allocation and Investment Project Plan
| No. | Project Name | Total Investment (RMB 10k) | Proceeds Allocation (RMB 10k) | Proceeds Share | Executing Legal Entity | Horizon | Capex Focus |
| 1 | Product Upgrade & Industrialization | 16,928.58 | 15,773.20 | 27.25% | Matrix Equipment / Matrix Electronics | 4 Years (2024–2027) | Facilities: RMB 40.29M; Equipment: RMB 81.04M; Working Cap: RMB 31.93M |
| 2 | Xi'an Industry-R&D Integration | 7,621.32 | 7,621.32 | 13.17% | Xi'an Tianheng | 3 Years (2026–2028) | Lease/Renovation: RMB 3.81M; Equipment: RMB 27.83M; R&D/Labor: RMB 32.81M |
| 3 | R&D Center Project | 23,551.81 | 21,513.19 | 37.16% | Parent Issuer / Matrix Equipment | 4 Years (2024–2027) | Construction: RMB 71.55M; R&D Equipment: RMB 64.93M; Salaries: RMB 75.75M |
| 4 | Information Systems Construction | 5,979.00 | 5,979.00 | 10.33% | Parent Issuer / Matrix Equipment | 3 Years (2026–2028) | IT Infrastructure: RMB 51.80M; Local AI System: RMB 3.00M; IT Salaries: RMB 2.40M |
| 5 | Strategic Tech Reserve Fund | 7,000.00 | 7,000.00 | 12.09% | Parent Issuer & Subsidiaries | Flexible | Dedicated to next-generation PNT, quantum navigation, and SiP packaging |
| -- | Total Proceeds Allocation | 61,080.71 | 57,886.71 | 100.00% | -- | -- | Capex: 60.10%; R&D/Staff: 25.10%; Working Cap: 14.80% |
Raw material procurement expanded from RMB 93.74M in 2023 to RMB 165.08M in 2025. Sourcing is executed on demand based on specific sales Bill of Materials (BOM), supplemented by a rolling safety stock buffer of specialized FPGA chips.
Table Procurement Breakdown by Category and Supplier Sourcing (FY2023–H1 2026)
| Procurement Category (RMB 10k / %) | 2023 FY Amount | 2023 Share | 2024 FY Amount | 2024 Share | 2025 FY Amount | 2025 Share | 2026 H1 Amount | 2026 H1 Share | Sourcing Details |
| Accessories & Supporting Equip. | 5,281.73 | 56.35% | 6,948.25 | 61.57% | 8,932.36 | 54.11% | 3,592.09 | 52.09% | Industrial PCs, dark chambers, receivers, antennas |
| Electronic Components (Chips) | 1,624.67 | 17.33% | 1,076.86 | 9.54% | 2,105.80 | 12.76% | 1,455.26 | 21.10% | FPGAs, DSPs, ADC/DAC, RF filters |
| Modules & Sub-assemblies | 1,113.65 | 11.88% | 2,259.77 | 20.02% | 3,345.68 | 20.27% | 937.25 | 13.59% | High-frequency RF, computing, and clock modules |
| Structural Parts & Fixtures | 669.00 | 7.14% | 569.37 | 5.04% | 1,307.30 | 7.92% | 554.96 | 8.05% | Chassis, enclosures, mechanical fixtures |
| Outsourced Services & Other | 653.20 | 6.97% | 403.94 | 3.58% | 764.64 | 4.63% | 322.67 | 4.68% | PCBA assembly, SMT mounting, screening |
| Total Procurement | 9,373.52 | 100.00% | 11,286.04 | 100.00% | 16,507.76 | 100.00% | 6,895.74 | 100.00% | Top 5 vendor share: 18.30%–32.49% |
To counter foreign semiconductor export licensing constraints, the company transitioned its simulator architecture from separate "Host + DSP + FPGA" setups to a single ARM+FPGA SoC design, and subsequently to an RFSOC direct-sampling architecture. It also launched an RMB 10.15M domestic RF System-in-Package (SiP) project and finished a 100% domestic component redesign of the C1 module in 2024.
Top five customer concentration accounted for 47.25% (2023), 42.88% (2024), 51.81% (2025), and 50.22% (2026 H1) of revenue, with no single customer group exceeding 18.8%. Sales are conducted through direct contracting (>94.98% to 99.58% of revenue).
Table Top Five Customers by Sales Revenue and Customer Concentration (FY2023–H1 2026)
| Period | Rank | Customer Name / Consolidated Entity | Sales Amount (RMB 10k) | Revenue Share | Delivered Products / Scope |
| 2026 H1 | 1 | CASIC | 2,671.66 | 18.77% | Navigation Signal Simulators |
| 2 | Hanuman Import & Export Co., Ltd | 1,229.12 | 8.64% | Drone Countermeasure Equipment (Export) | |
| 3 | CASC | 1,172.41 | 8.24% | Satellite TTC Ground Checkout, Simulators | |
| 4 | Shanghai Sinan Navigation | 1,055.58 | 7.42% | Navigation Simulation Test Systems | |
| 5 | Universal Service Obligation Fund Committee | 1,018.18 | 7.15% | Drone Countermeasure Products (Export) | |
| -- | -- | Top 5 Total (2026 H1) | 7,146.94 | 50.22% | Consolidated across tier-1 defense & export clients |
| 2025 FY | 1 | CETC | 7,179.32 | 18.76% | Drone Countermeasures, Simulators, Modules |
| 2 | CASC | 6,036.41 | 15.78% | Satellite TTC Ground Checkout, Simulators | |
| 3 | Zhejiang Ruitong Electronics | 2,290.65 | 5.99% | Drone Countermeasure Equipment | |
| 4 | AVIC | 2,196.52 | 5.74% | Drone Countermeasures, Simulators | |
| 5 | NORINCO | 2,119.80 | 5.54% | Countermeasures, Simulators, Augmentation | |
| -- | -- | Top 5 Total (2025 FY) | 19,822.71 | 51.81% | -- |
| 2024 FY | 1 | CASC | 5,984.02 | 18.50% | Simulation Test Systems, TTC Checkout |
| 2 | AVIC | 2,301.15 | 7.12% | Drone Countermeasures, Simulators | |
| 3 | CETC | 2,235.06 | 6.91% | Simulation Test Systems, Countermeasures | |
| 4 | CASIC | 1,959.56 | 6.06% | Simulators, Satellite TTC Checkout | |
| 5 | A3 Entity (Classified Defense Unit) | 1,389.76 | 4.30% | Navigation Signal Augmentation Products | |
| -- | -- | Top 5 Total (2024 FY) | 13,869.56 | 42.88% | -- |
| 2023 FY | 1 | CASC | 3,850.84 | 13.51% | TTC Services, Simulators, TTC Checkout |
| 2 | CETC | 3,092.81 | 10.85% | Countermeasures, Signal Processing Modules | |
| 3 | CASIC | 2,798.04 | 9.82% | Navigation Signal Simulators, Test Systems | |
| 4 | CEC | 2,246.55 | 7.88% | C1 Signal Processing Modules, Augmentation | |
| 5 | Guangzhou Digital Technology Group | 1,478.88 | 5.19% | Navigation Simulation Test Systems | |
| -- | -- | Top 5 Total (2023 FY) | 13,467.11 | 47.25% | -- |
Geographic revenue reflects defense industry clustering in North China and East China, with export sales expanding to 15.82% of total revenue in 2026 H1. All territorial metrics follow United Nations geographic nomenclature.
Table Regional Revenue Breakdown and Customer Concentration (FY2023–H1 2026)
| Regional Market (RMB 10k / %) | 2023 FY Amt | 2023 Share | 2024 FY Amt | 2024 Share | 2025 FY Amt | 2025 Share | 2026 H1 Amt | 2026 H1 Share | Regional Customer Concentration |
| North China | 10,648.12 | 37.44% | 13,776.87 | 42.68% | 11,065.84 | 28.96% | 4,777.04 | 33.62% | Defense HQs, CASC, CASIC, CETC (Beijing) |
| East China | 4,895.56 | 17.21% | 6,165.14 | 19.10% | 10,898.91 | 28.52% | 3,343.76 | 23.54% | Commercial space firms, CETC institutes |
| Central China | 5,911.05 | 20.78% | 4,469.82 | 13.85% | 5,063.61 | 13.25% | 1,827.36 | 12.86% | Hunan defense cluster, Changsha research |
| Northwest China | 2,636.71 | 9.27% | 3,474.12 | 10.76% | 5,836.58 | 15.28% | 573.62 | 4.04% | Xi'an aerospace base, flight test centers |
| Southwest China | 1,626.55 | 5.72% | 2,354.88 | 7.30% | 2,161.37 | 5.66% | 621.94 | 4.38% | Chengdu/Chongqing defense electronics |
| Northeast China | 1,030.16 | 3.62% | 1,178.24 | 3.65% | 1,767.93 | 4.63% | 224.51 | 1.58% | Harbin/Shenyang aerospace research bases |
| South China | 1,694.34 | 5.96% | 861.22 | 2.67% | 605.03 | 1.58% | 592.05 | 4.17% | Guangdong security infrastructure |
| Domestic Subtotal | 28,442.49 | 100.00% | 32,280.31 | 100.00% | 37,399.25 | 97.88% | 11,960.28 | 84.18% | Nationwide defense supply framework |
| Overseas | 0.00 | 0.00% | 0.00 | 0.00% | 810.17 | 2.12% | 2,247.30 | 15.82% | C-UAV and simulator exports (SE Asia, Mideast) |
| Total Main Revenue | 28,442.49 | 100.00% | 32,280.31 | 100.00% | 38,209.42 | 100.00% | 14,207.57 | 100.00% | -- |
HDIN Institutional Verdict
Forensic analysis indicates that the company's balance sheet contains minimal debt risk, with an asset-liability ratio between 19.57% and 23.47%, zero long-term bank debt, and an interest coverage ratio above 190x across all reported periods. Liquidity is supported by RMB 504.72M in cash and structured wealth instruments as of June 30, 2026.
Operating cash flow conversion highlights an operational scissor gap driven by defense delivery seasonality. In 2023–2025, operating cash flow expanded to RMB 130.15M (119.21% of net profit), supported by prompt-payment regulations for SMEs and an RMB 34.44M increase in customer advances. Conversely, 2026 H1 generated -RMB 55.23M in net operating cash flow due to the timing mismatch of steady operational expenditures (RMB 54.42M in H1 payroll; RMB 24.79M in taxes) against seasonal collections, combined with an RMB 28.07M inventory build and RMB 53.36M in supplier payables settlements.
Receivables balances represent the core asset exposure. Accounts receivable book value plus contract assets totaled RMB 253.62M in 2026 H1 (26.73% of current assets). The aging schedule displays structural aging, with accounts aged over two years reaching RMB 66.24M by year-end 2025 (24.53% of portfolio balance), with over 70% concentrated across units of CETC, CASIC, and China Aerospace Science and Technology Corporation [CASC].
Earnings purity shows dependence on policy-driven state incentives. Government subsidies and tax benefits (15% High-Tech Enterprise income tax status and VAT software refunds exceeding a 3% effective rate per CaiShui [2011] No. 100) constituted between 24.12% and 37.70% of total pre-tax profit. Core deducted net profit attributable to parent expanded at a 23.33% CAGR from RMB 75.50M in 2023 to RMB 93.12M in 2025. DuPont decomposition confirms that Return on Equity (13.10% in 2025) is driven by net profit margins (28.13% in 2025), while asset turnover decreased from 0.4300x to 0.3534x due to asset expansion outpacing top-line recognition. Financial leverage remained conservative at an equity multiplier of 1.3146x in 2025. R&D accounting reflects zero capitalization (100% expensed directly into profit and loss). Cumulative R&D spending from 2023 to 2025 totaled RMB 147.80M (14.91% of revenue), exceeding the STAR Market Criterion #1 threshold (5.00% or RMB 80.00M).
The company's governance structure centers on seven joint actual controllers—Zhong Xiaopeng (19.41%), Ming Dexiang (19.41%), Liu Zhijian (16.73%), Tian Mei (15.37%), Yang Jianwei (11.78%), Qiao Chunjie (8.65%), and Liu Chunyang (8.65%)—who hold 58.56% of pre-IPO voting control via holding entities Guoke Defense (39.57%), Changsha Tianquan (12.96%), and four ESOP platforms (6.03%: Changsha Langlu 2.01%, Hunan Daocai 1.85%, Changsha Hangce 1.52%, and Changsha Jianshan Landian 0.64%). Institutional investors include Dachen PE Group (10.22%), CETC Investment (4.10%), defense/regional funds (11.55%), and cyber/industrial venture capital funds (2.16%).
Five of the six core technical scientists (Ming Dexiang, Zhong Xiaopeng, Liu Zhijian, Yang Jianwei, Qiao Chunjie) are former research personnel and faculty members at the National University of Defense Technology (NUDT) who completed formal military transition protocols between 2015 and 2018. The issuer holds 106 authorized patents (65 invention patents; 45 original and 20 transferred) and 109 software copyrights, with zero co-owned patents and no recorded intellectual property disputes with military or academic institutions.
Historical nominee holding arrangements were remediated: equity held by founders' relatives in Guoke Defense was transferred back by April 2018, and partnership shares held by six nominee individuals across three ESOP platforms were refunded and notarized by the Changsha Notary Public Office in May 2023. All Valuation Adjustment Mechanisms (VAM) and investor buyback rights were retroactively annulled, and the Supervisory Board was replaced on August 5, 2025, with governance authority transferred to the Board Audit Committee in compliance with revised PRC Company Law provisions.
Presentation Download & Video Access
- Presentation Download: Click the PDF download link under 'Related Topics' to access the full institutional presentation of this report.
- Video Link: Click this link to watch the HDIN analyst briefing on YouTube.
About HDIN Research
HDIN Research is a premier global market intelligence and strategic advisory firm specializing in institutional-grade financial analysis, supply chain audits, and macroeconomic forecasting. Our dedicated sector analysts deliver actionable, data-driven insights tailored for private equity, hedge funds, and corporate strategy teams. Visit us at http://www.hdinresearch.com.
2026 AI Transparency Footer
"This intelligence report was authored by HDIN Research analysts following a rigorous audit of official corporate filings. AI was utilized for massive-scale data synthesis and structural drafting, ensuring 100% inclusion of reported data points. All strategic insights, financial modeling, and final verdicts were verified by our editorial board to ensure professional accuracy and compliance with 2026 Google Search E-E-A-T standards."