Penguin Solutions, Inc.: AI Memory Pivot Drives Net Sales to $1.73B as Working Capital Drain Triggers $338M Cash Conversion Gap
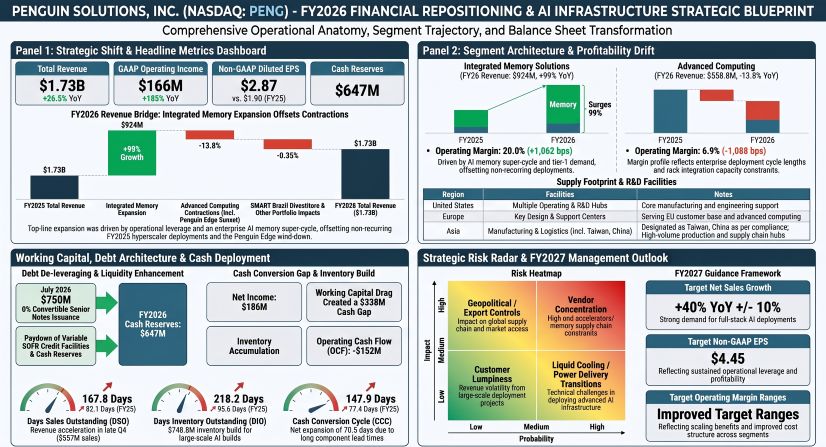
1. Penguin Solutions, Inc. [NASDAQ: PENG] expanded FY2026 net sales by 26.50% to $1,731.47 million, propelled by a 99.03% surge in Integrated Memory to $924.00 million, while Advanced Computing contracted 13.82% to $558.79 million following hyperscaler roll-offs.
2. A severe working capital absorption of $374.00 million—driven by $748.80 million in inventories and $796.30 million in receivables—pushed operating cash flow to negative $151.91 million, opening a $337.70 million cash conversion gap against GAAP net income.
3. Liquidity of $1,045.92 million insulates operations, yet the balance sheet faces immediate fourth-quarter calendar 2026 debt obligations, including a $93.00 million customer cash advance repayment and $54.55 million in current convertible debt.
Figure Penguin Solutions FY2026 Financial Repositioning Strategic Blueprint
 Segmental Realities, Capital Architecture, and Working Capital Compression
Penguin Solutions, Inc. completed its corporate redomiciliation from the Cayman Islands to Delaware on June 30, 2025, following its corporate name change from SMART Global Holdings, Inc. on October 15, 2024. For the 52-week fiscal year ended August 28, 2026 (FY2026), consolidated net sales reached $1,731.47 million, up 26.50% year-over-year from $1,368.79 million in FY2025 (52 weeks) and $1,170.80 million in FY2024 (53 weeks), reflecting a two-year compound annual growth rate (CAGR) of 21.61%. Consolidated gross profit rose 21.47% year-over-year to $478.93 million, although gross margin diluted by 114 basis points (bps) to 27.66% (down 144 bps from 29.10% in FY2024) due to high pass-through commodity costs in memory modules and the discontinuation of the Penguin Edge embedded unit.
GAAP operating income reached $165.60 million (+184.85% year-over-year; +200.86% two-year CAGR), expanding GAAP operating margin by 531 bps to 9.56%. Non-GAAP operating income totaled $240.96 million (+43.73% year-over-year; +41.55% two-year CAGR), producing a 13.92% margin (+167 bps). Selling, general, and administrative (SG&A) expenses fell 7.50% year-over-year to $220.40 million (declining from 20.00% of sales in FY2024 and 17.40% in FY2025 to 12.73% in FY2026) due to headcount reductions and normalized post-domestication legal fees. Net interest expense fell 94.00% year-over-year to $0.44 million (from $7.32 million in FY2025 and $28.37 million in FY2024) after fully retiring the $300.00 million Term Loan A in the fourth quarter of FY2025. Total cash interest paid in FY2026 contracted to $11.70 million from $47.70 million in FY2024.
GAAP net income from continuing operations surged 544.32% year-over-year to $185.79 million. Attributable net income reached $180.62 million (after deducting $5.17 million allocated to San'an Optoelectronics Co., Ltd.'s 49% noncontrolling interest in Cree Venture LED Company Limited), compared to $25.39 million in FY2025 and a net loss of $52.47 million in FY2024. Bottom-line results were distorted by a negative effective tax rate of -22.30% (tax benefit of $33.87 million against the 21.00% U.S. statutory rate), driven by a $68.70 million valuation allowance release on deferred tax assets following corporate restructuring, and $17.48 million in tax savings from Pioneer Status in Malaysia. Gross deferred tax assets stood at $208.68 million with $14.32 million in remaining valuation allowances. Net operating loss carryforwards include $19.50 million federal (expiring 2035+), $36.60 million state, $416.40 million in Section 163(j) interest carryforwards ($97.90 million from Stratus Technologies; $318.50 million consolidated U.S.), $25.60 million in Hong Kong, $10.20 million in Ireland, and $26.60 million in Luxembourg (expiring 2043). In non-operating results, Penguin Solutions, Inc. recognized a $30.94 million net gain from selling its remaining 19% equity interest in Zilia Technologies (SMART Brazil) for $46.10 million gross ($39.60 million net of $6.53 million Brazilian withholding tax), offset by a $10.00 million full impairment of its unlisted equity investment in Celestial AI and $33.25 million in debt inducement costs.
Table PENGUIN SOLUTIONS, INC. CONSOLIDATED SEGMENT FINANCIAL MATRIX (FY2024 – FY2026)
(Values in $ thousands, except percentages and basis points)
|
Segment / Metric |
FY2024 |
FY2025 |
FY2026 |
YoY Change (FY2025) |
YoY Change (FY2026) |
Two-Year Change |
|---|---|---|---|---|---|---|
|
Integrated Memory |
||||||
|
Net Sales |
$356,426 |
$464,249 |
$924,001 |
+30.25% |
+99.03% |
+60.98% CAGR |
|
Cost of Goods Sold |
$283,821 |
$362,612 |
$666,936 |
+27.76% |
+83.92% |
+134.98% |
|
Segment Operating Expense |
$50,192 |
$57,998 |
$72,123 |
+15.55% |
+24.35% |
+43.70% |
|
Segment Operating Income |
$22,413 |
$43,639 |
$184,942 |
+94.70% |
+323.80% |
+725.15% |
|
Segment Operating Margin |
6.29% |
9.40% |
20.02% |
+311 bps |
+1,062 bps |
+1,373 bps |
|
Segment Share of Net Sales |
30.44% |
33.92% |
53.36% |
+348 bps |
+1,944 bps |
+2,292 bps |
|
Advanced Computing |
||||||
|
Net Sales |
$554,552 |
$648,417 |
$558,789 |
+16.93% |
−13.82% |
+0.38% CAGR |
|
Cost of Goods Sold |
$324,152 |
$404,032 |
$392,605 |
+24.64% |
−2.83% |
+21.12% |
|
Segment Operating Expense |
$135,109 |
$129,376 |
$127,877 |
−4.24% |
−1.16% |
−5.35% |
|
Segment Operating Income |
$95,291 |
$115,009 |
$38,307 |
+20.69% |
−66.69% |
−59.80% |
|
Segment Operating Margin |
17.18% |
17.74% |
6.86% |
+56 bps |
−1,088 bps |
−1,032 bps |
|
Segment Share of Net Sales |
47.37% |
47.37% |
32.27% |
0 bps |
−1,510 bps |
−1,510 bps |
|
Optimized LED (Cree LED) |
||||||
|
Net Sales |
$259,818 |
$256,128 |
$248,678 |
−1.42% |
−2.91% |
−2.17% CAGR |
|
Cost of Goods Sold |
$188,838 |
$177,550 |
$164,065 |
−5.98% |
−7.60% |
−13.12% |
|
Segment Operating Expense |
$68,427 |
$69,574 |
$66,900 |
+1.68% |
−3.84% |
−2.23% |
|
Segment Operating Income |
$2,553 |
$9,004 |
$17,713 |
+252.68% |
+96.72% |
+593.81% |
|
Segment Operating Margin |
0.98% |
3.52% |
7.12% |
+254 bps |
+360 bps |
+614 bps |
|
Segment Share of Net Sales |
22.19% |
18.71% |
14.36% |
−348 bps |
−435 bps |
−783 bps |
|
Consolidated Non-GAAP Total |
||||||
|
Total Segment Operating Income |
$120,257 |
$167,652 |
$240,962 |
+39.41% |
+43.73% |
+41.55% CAGR |
|
Non-GAAP Operating Margin |
10.27% |
12.25% |
13.92% |
+198 bps |
+167 bps |
+365 bps |
|
Segment Depreciation |
$25,720 |
$20,579 |
$19,800 |
−19.99% |
−3.79% |
−23.02% |
|
Adjusted EBITDA (Derived) |
$145,977 |
$188,231 |
$260,762 |
+28.95% |
+38.53% |
+33.65% CAGR |
Non-GAAP operating income excludes $75.37 million in unallocated corporate items for FY2026:
* Stock-based compensation: $31.82 million ($41.18 million in FY2025; $43.16 million in FY2024), representing 17.12% of total GAAP net income (improving from 142.80% in FY2025).* Amortization of acquired intangible assets: $29.47 million ($34.84 million in FY2025; $39.27 million in FY2024). Net intangibles closed at $59.90 million, including $2.50 million in capitalized patent fees.
* Restructuring charges: $11.24 million in operating expenses ($2.10 million in FY2025; $7.06 million in FY2024) and $(0.48) million in cost of sales adjustments, reflecting severance from finalizing the Penguin Edge wind-down. The accrued restructuring balance ended at $2.85 million following $9.45 million in cash payments.
* Acquisition and corporate diligence expenses: $1.92 million ($1.83 million in FY2025; $8.77 million in FY2024). Redomiciliation costs were zero ($10.04 million in FY2025; $0.47 million in FY2024). Goodwill impairments were zero ($16.06 million on Penguin Edge in FY2025). Other infrequent expenses were $1.41 million ($2.73 million in FY2025). Total goodwill sits at $145.90 million ($131.20 million in Advanced Computing; $14.70 million in Integrated Memory).
Under the DuPont deconstruction framework, Return on Equity (ROE) expanded 2,824 bps to 34.68% (39.48% on average equity of $457.51 million), up from 6.44% in FY2025 and -13.41% in FY2024. Capital efficiency gains were driven by Net Profit Margin expanding 857 bps to 10.43% (attributable) and Financial Leverage (Equity Multiplier) rising from 4.10x to 5.33x (4.80x average), which compensated for Asset Turnover contracting from 0.85x to 0.62x (0.79x average). Total assets expanded 71.78% to $2,778.14 million, driven by working capital assets, while total liabilities doubled to $2,038.24 million.
Operating cash flow from continuing operations contracted to negative $151.91 million (conversion ratio of -81.77% against GAAP net income), creating a cash divergence gap of $337.70 million. Operating assets and liabilities consumed $374.00 million:
* Accounts receivable increased $488.36 million, ending at $796.30 million (+158.62% year-over-year) due to fourth-quarter revenue acceleration ($566.70 million in Q4 FY2026 vs. $337.90 million in Q4 FY2025). A single Integrated Memory client accounted for >10% of total receivables (>$79.63 million). The company maintained an untapped $60.00 million non-recourse accounts receivable factoring facility.
* Inventories increased $493.60 million to $748.80 million (+193.42% year-over-year). Raw materials expanded 296.10% to $366.00 million, while finished goods grew 169.11% to $352.00 million.
* Accounts payable and accrued liabilities expanded by $606.96 million, with accounts payable ending at $816.90 million (total AP and accrued liabilities reached $890.50 million). Deferred revenue liabilities increased to $157.20 million ($123.30 million recognized within 12 months). Customer advance balances stood at $12.50 million.
* The ending Cash Conversion Cycle stretched by 70.5 days to 147.9 days (DSO of 167.8 days, DIO of 218.2 days, DPO of 238.1 days). On an average balance sheet basis, CCC registered at 104.7 days (DSO of 116.4 days, DIO of 146.3 days, DPO of 158.0 days).
Table CAPITAL EXPENDITURES, LEASE OBLIGATIONS & DEBT AMORTIZATION SCHEDULE
(Values in $ thousands, except interest rates and share data)
|
Debt / Capital Obligation |
Principal |
Carrying Value |
Coupon Rate |
Effective Rate |
Maturity Date / Terms |
|---|---|---|---|---|---|
|
0.00% Convertible Senior Notes |
$750,000 |
$735,532 |
0.00% |
0.40% |
August 1, 2031 |
|
2.00% Convertible Senior Notes |
$40,000 |
$39,013 |
2.00% |
2.65% |
August 15, 2030 |
|
2.00% Convertible Senior Notes |
$14,545 |
$14,405 |
2.00% |
2.40% |
February 1, 2029 |
|
2025 Revolving Credit Facility |
$0 |
$0 |
SOFR + 1.25%–3.00% |
N/A |
June 24, 2030 |
|
Total Debt Outstanding |
$804,545 |
$788,950 |
Weighted average: 0.20% |
0.51% |
Unamortized costs: $(15,595) |
|
↳ Current Debt Portion |
$54,545 |
$53,418 |
2.00% |
2.59% |
Convertible notes due November 2026 |
|
↳ Long-Term Debt Portion |
$750,000 |
$735,532 |
0.00% |
0.40% |
August 2031 |
|
Temporary Equity (SKT CPS) |
$200,000 |
$202,710 |
6.00% PIK/Cash |
N/A |
No stated maturity |
|
Common Stockholders’ Equity |
N/A |
$537,186 |
— |
— |
$520,676 attributable to PENG |
Table Contractual Commitments and Future Cash Outflows
(Values in $ thousands, except interest rates and share data)
|
Fiscal Period |
Operating Leases |
Purchase Obligations |
Customer Cash Advances |
Total Cash Outflow |
|---|---|---|---|---|
|
FY2027 (within 12 months) |
$10,054 |
$93,000 |
$93,000 |
$196,054 |
|
FY2028 |
$10,192 |
$0 |
$0 |
$10,192 |
|
FY2029 |
$9,989 |
$0 |
$0 |
$9,989 |
|
FY2030 |
$9,854 |
$0 |
$0 |
$9,854 |
|
FY2031 |
$8,414 |
$0 |
$0 |
$8,414 |
|
FY2032 and Thereafter |
$35,563 |
$0 |
$0 |
$35,563 |
|
Total Undiscounted Commitments |
$84,066 |
$93,000 |
$93,000 |
$270,066 |
|
Imputed Interest Discount |
$(19,827) |
— |
— |
$(19,827) |
|
Present Value Carrying Amount |
$64,239 |
$93,000 |
$93,000 |
$250,239 |
On July 17, 2026, Penguin Solutions, Inc. closed an offering of $750.00 million aggregate principal of 0.00% Convertible Senior Notes due 2031 (net proceeds of $735.20 million). Net proceeds funded the complete repayment of the $100.00 million balance on the JPMorgan Chase & Co.-syndicated 2025 Revolving Credit Facility ($398.70 million remaining undrawn availability; $400.00 million facility), the purchase of capped call options for $49.10 million, and $295.50 million in cash plus 8.70 million common shares to induce early conversion of $135.46 million of the 2029 Notes and $160.00 million of the 2030 Notes. The remaining 2029 Notes ($14.55 million principal; initial conversion price $21.23 per share) and 2030 Notes ($40.00 million principal; initial conversion price $28.01 per share) are classified under current liabilities because common shares traded above 130% of conversion thresholds, opening conversion rights through November 27, 2026. The 2031 Notes feature an initial conversion price of $116.70 per share (8.5690 shares per $1,000 note) with mandatory cash settlement of principal.
Gross share overhang totals 18,562,743 common shares (+30.85% potential dilution against 60,171,000 basic shares outstanding; 60,241,423 shares as of October 14, 2026; 13,656,000 treasury shares carried at $(280.50) million; 73,827,000 shares issued at $0.03 par value; 18 record holders). Overhang components include 6,426,750 shares from the 2031 Notes, 1,428,136 shares from the 2030 Notes, 685,155 shares from the 2029 Notes, 6,095,702 shares from Astra AI Infra LLC's (SK Telecom Co., Ltd.) $200.00 million Convertible Preferred Stock ($32.81 conversion price; 6.00% cumulative dividend generating $12.13 million in FY2026 dividends), 3,671,000 unvested RSUs (grant-date average fair value of $23.73; intrinsic value $181.80 million), and 256,000 exercisable stock options (weighted average exercise price $15.55; 1.96-year remaining term). The company maintains anti-dilution capped calls covering 20,637,000 shares with a maximum value of $500.29 million, including 6,430,000 shares for the 2031 Notes capped at $175.05 per share, and an excess holding of 14,207,000 options on the 2029 and 2030 notes (capped at $29.14 and $37.70) against only 2,113,291 remaining underlying note shares. Total liquidity stood at $1,045.92 million ($647.22 million cash and cash equivalents plus $398.70 million undrawn revolver).
Global Supply Chain Footprint, Fab-Light Operations, and Intellectual Property Assets
Penguin Solutions, Inc. operates under a "Fab-Light" manufacturing structure, outsourcing primary semiconductor and wafer fabrication while running proprietary down-stream system integration, surface-mount assembly, memory testing, and rack-level validation across 1.40 million aggregate square feet of real estate. Total long-lived assets stood at $138.50 million as of August 28, 2026, comprising $84.24 million in net property, plant, and equipment (3.03% of total assets) and $54.24 million in operating lease right-of-use assets. Capital expenditures remained low at $11.57 million (0.67% of net sales), compared to $9.01 million (0.66%) in FY2025 and $19.42 million (1.66%) in FY2024, fully covered by segment depreciation of $19.80 million ($20.71 million total).
Table PENGUIN SOLUTIONS, INC. GLOBAL OPERATING, R&D AND MANUFACTURING FOOTPRINT
(UN Standard Regional Designations; Square footage in thousands)
|
Facility Location |
UN Region / Country |
Square Feet |
Operational Focus |
Segment Alignment |
|---|---|---|---|---|
|
Fremont, California, USA |
United States |
86 |
Corporate headquarters and AI rack integration |
Advanced Computing |
|
Newark, California, USA |
United States |
79 |
Memory manufacturing, testing, and logistics |
Integrated Memory & Computing |
|
Durham, North Carolina, USA |
United States |
102 |
Segment headquarters, LED R&D, and sales |
Optimized LED (Cree LED) |
|
Maynard, Massachusetts, USA |
United States |
69 |
R&D laboratory and Stratus system engineering |
Advanced Computing |
|
Penang, Malaysia |
Malaysia |
139 |
Memory assembly and Zefr™ testing |
Integrated Memory & Computing |
|
Huizhou, China |
China |
824 |
LED packaging, die testing, and SMT |
Optimized LED (Cree LED) |
|
Ballycoolin, Ireland |
Ireland |
Leased |
Fault-tolerant system testing |
Advanced Computing (Stratus) |
|
New Taipei City, Taiwan, China |
Taiwan, China |
Leased |
Firmware and board engineering |
Integrated Memory & Computing |
|
Bengaluru, India |
India |
Leased |
ClusterWareAI software R&D |
Advanced Computing |
|
Irvine, California, and Tempe, Arizona, USA |
United States |
Leased |
Memory validation laboratories |
Integrated Memory |
|
Tewksbury, Massachusetts, USA |
United States |
Leased |
Fault-tolerant operating system engineering |
Advanced Computing (Stratus) |
Table Geographic Distribution of Long-Lived Assets
|
Geographic Region |
Long-Lived Assets (US$ millions) |
Share of Total (%) |
|---|---|---|
|
United States |
$95.90 |
69.24% |
|
China |
$29.80 |
21.52% |
|
Malaysia |
$9.80 |
7.08% |
|
Other International |
$2.90 |
2.09% |
|
Total |
$138.50 |
100.00%* |
Geographic net sales by customer ship-to location shifted internationally in FY2026, with international markets accounting for 56.14% ($972.02 million) of revenue:
* United States: $759.45 million (43.86% share), contracting 2.20% year-over-year from $776.51 million (56.73%) in FY2025 and $672.75 million (57.46%) in FY2024.
* China: $301.66 million (17.42% share), up 61.45% year-over-year from $186.85 million (13.65%) in FY2025 and $190.65 million (16.28%) in FY2024.
* Mexico: $264.95 million (15.30% share), up 79.87% year-over-year from $147.30 million (10.76%) in FY2025 and $27.30 million (2.33%) in FY2024, reflecting nearshoring of data center rack integration.
* Europe: $102.49 million (5.92% share), up 5.66% year-over-year from $97.00 million (7.09%) in FY2025 and $114.30 million (9.76%) in FY2024.
* Other Foreign Regions: $302.92 million (17.49% share), up 87.98% year-over-year from $161.14 million (11.77%) in FY2025 and $165.79 million (14.16%) in FY2024.
Transactional product hardware accounted for $1,480.93 million (85.53% of net sales), while professional and managed support services generated $250.54 million (14.47%). In parallel, the SMART Supply Chain Services platform handled $2,340.50 million in gross material procurement throughput (+161.89% year-over-year from $893.70 million in FY2025 and $518.70 million in FY2024), recognized on a net fee basis within services.
The company maintains high customer and vendor concentration. Its ten largest customers accounted for 56.00% of net sales in FY2026 (66.00% in FY2025; 58.00% in FY2024). Customer A (Integrated Memory) emerged as the largest client, generating 20.00% ($346.10 million) of consolidated sales. Customer B (Advanced Computing hyperscaler), which contributed $215.00 million (18.40%) in FY2024 and $249.60 million (18.20%) in FY2025, dropped below 10.00% in FY2026. Customer C (Integrated Memory) dropped below 10.00% after contributing $192.50 million (14.10%) in FY2025. Related-party commercial revenue from SK Telecom Co., Ltd. reached $34.82 million ($32.17 million product; $2.65 million services; $0.68 million ending accounts receivable balance), up from $32.35 million in FY2025.
Purchases from the two largest raw material suppliers totaled $1.30 billion in FY2026 (+116.67% year-over-year from $0.60 billion in FY2025 and $0.40 billion in FY2024), with $236.50 million owed to these two vendors in accounts payable at year-end (26.56% of total trade AP). Supplier relationships include memory chipmakers Samsung Electronics Co., Ltd., Micron Technology, Inc., SK hynix Inc., and Kioxia Corporation; compute silicon and networking providers Intel Corporation, Advanced Micro Devices, Inc., Super Micro Computer, Inc., TD SYNNEX Corporation, and Juniper Networks, Inc.; and contract manufacturing partners Celestica Inc., Advantech Co., Ltd., and NEC Corporation. Raw LED wafers are sourced through San'an Optoelectronics Co., Ltd. under supply agreements for Cree Venture LED Company Limited.
Internal research and development (R&D) expenses totaled $81.68 million in FY2026 (4.72% of sales, demonstrating operating leverage from 5.83% in FY2025 and 6.96% in FY2024; $6.33 million stock-based compensation; $75.34 million Non-GAAP R&D). Under ASC 730, 100% of internal software development costs for ClusterWareAI, Agentic Fabric, and Scyld ClusterWare are expensed as incurred, leaving zero internal capitalized software on the balance sheet. Tax-capitalized R&D under IRC Section 174 stood at $21.80 million in deferred tax assets ($29.60 million in FY2025). The global technical workforce includes ~380 dedicated R&D personnel (13.57% of 2,800 total full-time employees), supported by field application engineers. The intellectual property estate encompasses 1,619 owned or exclusively licensed patents (expiring between 2026 and 2051) and 531 pending patent applications globally, concentrated primarily in Cree LED packaging and specialty memory architectures (CXL MemoryAI add-in cards, high-density DDR5 DIMMs up to 256GB, and Zefr™ reliability screening routines).
Corporate governance changes in FY2026 included the appointment of Kash Shaikh as President and Chief Executive Officer on January 30, 2026 (succeeding Mark Adams), and Stephen Cumming as Senior Vice President and Chief Financial Officer on September 16, 2026 (effective October 6, 2026). Tony Frey continues as Chief Revenue Officer (amended agreement July 29, 2025), and Penelope Herscher serves as independent Board Chair within an 8-member board that includes SK Telecom Co., Ltd. designee Min Yong Ha. Executive incentives mandate 50% time-based RSUs (4-year vesting: 25% cliff, 75% quarterly over 36 months) and 50% performance-based PRSUs benchmarked against 3-year relative Total Shareholder Return against the Russell 2000 Index (0% to 200% payout multipliers). The corporate charter enforces Delaware General Corporation Law Section 203, a classified staggered board, a 66 2/3% supermajority vote requirement to amend bylaws or remove directors for cause, a prohibition on stockholder action by written consent, and 30,000,000 blank-check preferred share authorizations. Deloitte & Touche LLP (12-year tenure) issued unqualified audit opinions on financial statements and internal controls over financial reporting (COSO 2013 framework) with zero material weaknesses, identifying ASC 606 revenue recognition in Advanced Computing as the single Critical Audit Matter.
HDIN Institutional Verdict
Management’s presentation of FY2026 as an unencumbered AI infrastructure transition is contradicted by acute earnings-quality distortions and operational working capital absorption. While reported GAAP operating income reached $165.60 million, genuine operating cash flow dropped to negative $151.91 million. Over 36.98% of reported GAAP net income ($68.70 million of $185.79 million) represented a non-cash tax valuation allowance release, and an additional $30.94 million stemmed from a non-operating equity sale of the Zilia Technologies stake.
Operationally, the business traded fixed-asset exposure for extreme working capital liabilities. Raw material inventories escalated by 296.10% to $366.00 million, while accounts receivable increased 158.62% to $796.30 million, locked in concentrated customer exposures where Customer A represents 20.00% of revenue and over 10.00% of outstanding credit. Concurrently, supplier concentration reached $1.30 billion across just two vendors on short-term purchase orders without guaranteed allocations. With $196.05 million in immediate cash commitments due in FY2027—including a non-negotiable $93.00 million customer cash advance repayment due in December 2026 and $93.00 million in firm component purchase obligations—Penguin Solutions, Inc. must execute flawless inventory de-stocking and accounts receivable collection to validate its current valuation metrics.
Presentation Download & Video Access:
* Presentation Download: Click the PDF download link under 'Related Topics' to access the full institutional presentation of this report.
* Video Link: Click this link to watch the HDIN analyst briefing on YouTube.
About HDIN Research:
HDIN Research is a premier global market intelligence and strategic advisory firm specializing in institutional-grade financial analysis, supply chain audits, and macroeconomic forecasting. Our dedicated sector analysts deliver actionable, data-driven insights tailored for private equity, hedge funds, and corporate strategy teams. Visit us at http://www.hdinresearch.com.
2026 AI Transparency Footer:
"This intelligence report was authored by HDIN Research analysts following a rigorous audit of official corporate filings. AI was utilized for massive-scale data synthesis and structural drafting, ensuring 100% inclusion of reported data points. All strategic insights, financial modeling, and final verdicts were verified by our editorial board to ensure professional accuracy and compliance with 2026 Google Search E-E-A-T standards."