FactSet Research Systems Inc.: Enterprise Platform Transition Across Asia-Pacific Centers of Excellence Signals Free Cash Flow Decoupling from GAAP Margin Compression
1. FactSet Research Systems Inc. generated $707.5 million in fiscal 2026 free cash flow (+14.6% YoY), even as GAAP operating margin compressed 390 basis points to 28.3% under $73.98 million in restructuring and executive transition charges.
2. Operating risk centers on labor geography, with 68% of staff deployed across Indian and Philippine Centers of Excellence, exposing operational expenses to local regulatory and currency shifts.
3. Institutional refinancing risk looms with $500.0 million in Senior Notes maturing March 1, 2027, compounded by unresolved antitrust litigation over CUSIP Global Services licensing fees.
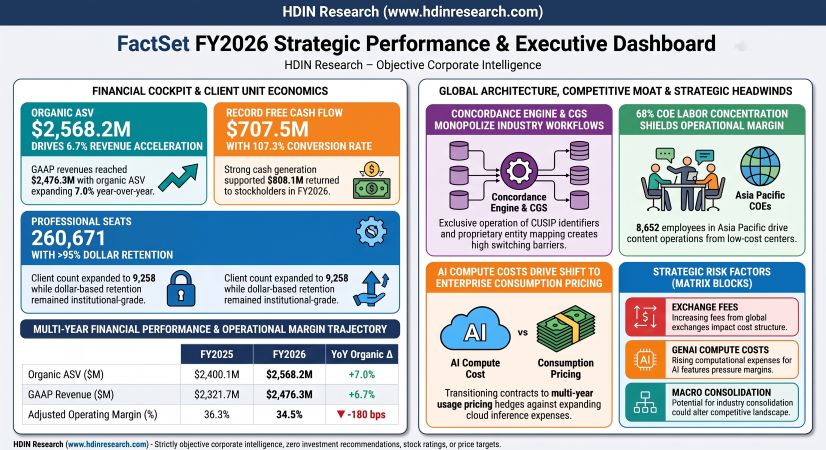
Figure FactSet FY2026 Strategic Performance & Executive Dashboard
 Segmental Realities, Cost Inflation, and Balance Sheet Dynamics
FactSet Research Systems Inc. [NYSE: FDS] closed fiscal year 2026 (ended August 31, 2026) with consolidated GAAP revenues of $2,476.3 million, reflecting an expansion of 6.7% (+$154.5 million from $2,321.7 million in FY2025 and $2,203.1 million in FY2024). Organic revenue growth matched this at 6.7% (with foreign exchange providing a 0.1% or +$1.58 million tailwind). Total Organic Annual Subscription Value (ASV) advanced 7.0% year-over-year to $2,568.2 million (+$168.1 million net expansion from $2,400.1 million in FY2025).
Operating profitability exhibited a marked divergence between GAAP accounting and adjusted cash metrics. GAAP operating income dropped 6.5% to $699.96 million (down from $748.3 million in FY2025 and $701.3 million in FY2024), reducing GAAP operating margin by 390 basis points from 32.2% to 28.3% (compared to 31.8% in FY2024). Gross margin contracted 210 basis points to 50.6%, as Cost of Services expanded 11.4% to $1,223.1 million (49.4% of revenue versus 47.3% or $1,097.8 million in FY2025 and $1,011.9 million in FY2024). SG&A rose 16.3% to $553.2 million (22.3% of revenue versus 20.4% in FY2025). GAAP net income declined 10.6% to $533.481 million (down from $597.0 million in FY2025 and $537.1 million in FY2024), resulting in a 6.3% drop in GAAP diluted EPS to $14.57 (from $15.55 in FY2025 and $13.91 in FY2024).
The GAAP operating contraction was governed by $73.98 million in non-recurring charges ($1.56 Diluted EPS impact). Non-GAAP adjusted operating income rose 1.4% to $855.31 million (from $843.4 million in FY2025), yielding an adjusted operating margin of 34.5% (-180 bps YoY from 36.3%). Adjusted diluted EPS grew 6.1% to $18.01 (up from $16.98 in FY2025), while adjusted net income stood at $659.498 million and adjusted EBITDA reached $911.407 million.
Table Reconciliation of GAAP Operating Income to Adjusted Operating Income, FY2026
|
Non-GAAP Operating Income Reconciliation Element |
FY2026 Pre-Tax Impact (US$ millions) |
P&L Classification / Strategic Driver |
|---|---|---|
|
GAAP Operating Income |
$699.96 |
Reported operating benchmark (28.3% margin) |
|
Acquired Intangible Asset Amortization |
+$76.21 |
Amortization of developed technology and customer relationships |
|
Organizational Restructuring / Severance Charges |
+$46.20 |
Headcount realignment ($0.97 diluted EPS impact) |
|
CEO Onboarding Compensation Awards |
+$19.52 |
Sanoke Viswanathan make-whole awards ($0.41 EPS impact) |
|
Business Acquisition, Disposition & Integration Costs |
+$8.26 |
LiquidityBook and Irwin integration ($0.18 EPS impact) |
|
India Labor Codes Reform Adjustment |
+$2.88 |
Statutory employee-benefit remeasurement |
|
Asset Impairments & Client Bankruptcy Charges |
+$1.64 |
Isolated counterparty insolvencies |
|
Litigation Reserve |
+$0.65 |
Legal exposure adjustments |
|
Adjusted Operating Income |
$855.31 |
Normalized operating core (34.5% margin) |
Top-line revenue generation remained structured around three reportable geographic operating segments:
|
Reportable Segment |
FY2024 Revenue ($M) |
FY2025 Revenue ($M) |
FY2026 Revenue ($M) |
GAAP Revenue Growth YoY (%) |
Organic Revenue Growth YoY (%) |
FY2026 Organic ASV ($M) |
Organic ASV Growth YoY (%) |
Share of FY2026 Revenue (%) |
|---|---|---|---|---|---|---|---|---|
|
Americas |
$1,419.9 |
$1,506.1 |
$1,617.4 |
+7.4% |
+6.9% |
$1,678.2 |
+7.1% |
65.3% |
|
EMEA |
$563.1 |
$580.3 |
$605.3 |
+4.3% |
+5.0% |
$623.6 |
+5.2% |
24.4% |
|
Asia Pacific |
$220.0 |
$235.4 |
$253.5 |
+7.7% |
+9.9% |
$266.4 |
+10.6% |
10.3% |
|
Consolidated Total |
$2,203.1 |
$2,321.7 |
$2,476.3 |
+6.7% |
+6.7% |
$2,568.2 |
+7.0% |
100.0% |
Under ASC 606 (Note 3), FactSet Research Systems Inc. explicitly discloses that disaggregating revenue across external product and service lines is impracticable due to bundled workstation, data feed, screening, and API contracts. MD&A reporting identifies Data Solutions (enterprise feeds and content) and Workstations as primary drivers across all regions, followed by Middle Office Solutions (Portfolio Analytics and Trading). Institutional client count (accounts with ASV $\ge$ $10,000) climbed 2.9% to 9,258 (+262 clients from 8,996 in FY2025). User seats expanded 9.8% (+23,347 users) to 260,671 (up from 237,324 in FY2025), fueled by wealth management desktop deployments. Average ASV per client rose 3.7% to ~$277,400 (from ~$267,400). Annual ASV retention stayed above 95.0%, while client-count retention dipped 100 bps to 90.0% (from 91.0%), reflecting isolated attrition within lower-tier boutique accounts.
FactSet Research Systems Inc. omits aggregate Remaining Performance Obligations (RPO) in dollar terms via the practical expedient of ASC 606-10-50-14, as client contracts default to durations of one year or less, or follow the "as invoiced" output time-based measure of progress. Current deferred revenue rose 8.09% YoY to $181.444 million (+$13.592 million from $167.852 million in FY2025), generating a positive cash flow contribution of $12.993 million (accelerating from +$2.249 million in FY2025 and +$4.94 million in FY2024). Non-current deferred revenue was reclassified into Other Liabilities due to immateriality.
Gross accounts receivable reached $312.203 million, offset by an allowance for credit losses of $13.584 million, leaving net accounts receivable at $298.619 million (+10.3% from $270.7 million in FY2025) and driving an operating cash outflow of $34.6 million. Days Sales Outstanding (DSO) extended by 1.4 days to 44.0 days (from 42.6 days in FY2025). Bad debt expense was $6.623 million (0.27% of revenue, up from 0.21% or $4.973 million in FY2025 and 0.34% or $7.420 million in FY2024), incorporating $0.75 million in pre-tax client bankruptcy charges. Write-offs net of recoveries were $6.828 million in FY2026 ($5.765 million in FY2025 and $0.608 million in FY2024), reducing the reserve ratio to 4.35% of gross receivables (from 4.85% in FY2025 and 5.34% in FY2024).
Operating cash flow grew 13.2% to $822.2 million ($726.3 million in FY2025 and $700.3 million in FY2024), supported by $180.8 million in depreciation and amortization and $84.1 million in stock-based compensation. Free cash flow climbed 14.6% to $707.5 million ($617.5 million in FY2025 and $614.7 million in FY2024), achieving conversion ratios of 107.3% against Adjusted Net Income, 77.6% against Adjusted EBITDA, and 132.6% against GAAP Net Income. CapEx rose 5.4% to $114.7 million (4.6% of revenue, compared to $108.8 million in FY2025 and $85.7 million in FY2024), consisting almost entirely of capitalized internal-use software development. Total tech investment totaled $460.8 million (+12.5% YoY), including $346.1 million in expensed research and product development (+15.1% YoY from $300.7 million in FY2025 and $265.2 million in FY2024; 14.0% of revenue) and $114.7 million in capitalized software (a 24.9% capitalization rate, compared to 26.6% in FY2025 and 24.4% in FY2024). Zero stock-based compensation was capitalized. Developed Technology assets reached $347.4 million gross (+$87.2 million from $260.2 million), with accumulated amortization of $204.5 million (+$76.8 million expense), leaving net Developed Technology at $142.9 million (+7.9% YoY from $132.5 million).
Adoption of ASU 2023-09 disaggregated tax disclosures reveals an effective tax rate (ETR) of 17.9% in FY2026 ($116.235 million provision on $649.7 million consolidated pre-tax income: $400.5 million domestic, $249.3 million international), compared to 17.2% in FY2025 and 17.6% in FY2024. The rate reflects a 310 basis point discount to the 21.0% U.S. statutory baseline ($136.440 million):
Table Income Tax Rate Reconciliation under ASU 2023-09, FY2026
|
ASU 2023-09 Tax Rate Reconciliation Component |
Pre-Tax Impact (US$ millions) |
Effective Tax Rate Impact (%) |
Statutory / Qualitative Mechanism |
|---|---|---|---|
|
Tax at U.S. Federal Statutory Rate |
$136.440 |
+21.0% |
Statutory U.S. corporate baseline |
|
State and Local Taxes (net of federal benefit) |
+$24.351 |
+3.7% |
New York State and New York City account for more than 50% of the impact |
|
U.K. Statutory Rate Differential (25% vs. 21%) |
+$8.447 |
+1.3% |
United Kingdom statutory tax rate differential |
|
Other United Kingdom Tax Adjustments |
+$0.453 |
+0.1% |
Local U.K. corporate tax provisions |
|
Other Foreign Jurisdictions Rate Differentials |
+$3.169 |
+0.5% |
Blended EMEA and APAC tax rate structures |
|
Foreign-Derived Intangible Income (FDII) Deduction |
−$17.167 |
−2.6% |
Section 250 export incentive deduction |
|
Other Cross-Border Tax Provisions (GILTI/BEAT) |
+$2.711 |
+0.4% |
Cross-border income inclusions and minimum taxes |
|
Foreign Tax Credits (FTCs) |
−$26.553 |
−4.1% |
Credits for foreign income taxes paid |
|
Research & Development (R&D) Tax Credits |
−$18.500 |
−2.8% |
Technology research and development incentives |
|
Other Tax Credits |
−$1.120 |
−0.2% |
Local statutory tax credits |
|
Valuation Allowance Adjustments |
+$0.051 |
0.0% |
Foreign tax credit carryforward allowances |
|
Nondeductible Items & Executive Compensation Limitations |
+$9.233 |
+1.4% |
Internal Revenue Code Section 162(m) and option shortfall |
|
Changes in Unrecognized Tax Benefits (UTBs) |
−$8.933 |
−1.4% |
Audit settlements and statute expirations |
|
Other Miscellaneous Tax Accounting Adjustments |
+$3.653 |
+0.6% |
Routine tax accounting true-ups |
|
Total Provision for Income Taxes / GAAP Effective Tax Rate (ETR) |
$116.235 |
17.9% |
Consolidated GAAP income tax provision |
Net cash paid for income taxes totaled $122.7 million in FY2026 ($103.2 million in FY2025), comprising $70.2 million to non-U.S. jurisdictions ($56.4 million in the U.K.), $31.7 million to U.S. states and localities ($10.4 million to New York City), and $20.8 million to U.S. federal authorities. Gross Unrecognized Tax Benefits (UTBs) dropped 46.1% to $21.25 million (from $39.43 million in FY2025 and $35.3 million in FY2024), driven by a $21.7 million release of prior-year reserves. Net rate-impacting reserves stand at $23.20 million (including $4.20 million in accrued interest and penalties). Open audit cycles include U.S. Federal (FY2023–FY2025), U.S. States (FY2019–FY2025), the U.K. (FY2021–FY2025), and India (FY2023–FY2025). The Massachusetts sales tax dispute was settled on November 26, 2024 (Q1 FY2025) for $66.2 million cumulative ($2.4 million in Q1 FY2025, $54.0 million in FY2024; final cash settlement of $56.4 million paid in Q1 FY2025), leaving zero remaining liability.
FactSet Research Systems Inc. returned $808.1 million to stockholders in FY2026. Share repurchases climbed 114.3% to $644.0 million (2,608,284 shares repurchased at a volume-weighted average price of ~$246.89/share), compared to $300.5 million (684,960 shares at ~$438.65) in FY2025 and $235.2 million (537,800 shares at ~$437.40) in FY2024, lowering diluted weighted average shares by 4.6% YoY to 36.6 million. Open market buyback authority was expanded by $600.0 million on December 16, 2025; remaining authorization stood at $356.0 million on August 31, 2026. Employee tax-withholding repurchases absorbed $6.9 million ($16.2 million in FY2025, $16.7 million in FY2024), while the Inflation Reduction Act 1% excise tax consumed $6.1 million ($3.0 million in FY2025, $1.7 million in FY2024). Dividends reached $164.2 million ($160.0 million in FY2025, $150.7 million in FY2024), raising quarterly DPS by 5.5% to $1.16 ($4.64 annualized) for 27 consecutive fiscal years of increases. GAAP payout ratio was 30.7% (declared dividends of $163.7 million / net income of $533.5 million); adjusted payout ratio was 24.8%. Total capital deployed across buybacks, dividends, CapEx ($114.7 million), and deferred M&A consideration ($15.3 million) reached $938.2 million (FY2025 included $348.3 million net M&A outflows for LiquidityBook at $243.2 million and Irwin at $120.2 million).
Infrastructure Layout, Global Footprint, and Procurement Concentration
FactSet Research Systems Inc. exhibits a geographic divergence between customer billing locations and employee labor deployment. On a customer domicile basis, the United States accounted for $1,516.1 million (61.2% of global revenue, +7.1% YoY), the United Kingdom contributed $242.6 million (9.8%, +5.0% YoY), and All Other Countries generated $717.6 million (29.0%, +6.3% YoY), placing international customer revenues at $960.1 million (38.8% of total). Under United Nations geographic nomenclature standards, FactSet formally reports operations in Taiwan as Taiwan, China (or Taiwan, Province of China), and delineates mainland operations in Shanghai (China) alongside Hong Kong Special Administrative Region ("SAR") of China.
Total global workforce contracted 2.8% (-356 employees) to 12,444 at fiscal year-end 2026 (down from 12,800 in FY2025 and ~13,300 in FY2024), spread across 33 offices in 19 countries. Non-U.S. locations represent 81% of total headcount.
Table Global Workforce Distribution by Geographic Region, FY2026
|
Geographic Region |
Total Headcount |
YoY Change (%) |
Share of Global Headcount (%) |
Primary Office Locations & Operating Centers |
Core Functional Scope |
|---|---|---|---|---|---|
|
Asia Pacific |
8,652 |
−2.3% |
70.0% |
India (Hyderabad, Chennai, Mumbai); Philippines (Manila); China (Shanghai); Hong Kong SAR of China; Singapore; Japan (Tokyo); Australia (Sydney, Melbourne) |
Global Centers of Excellence (COEs), content operations, software engineering, regional sales |
|
Americas |
2,373 |
−5.5% |
19.1% |
Norwalk, Connecticut (headquarters); New York; San Francisco; Boston; Chicago; Austin; Reston; Lakewood; Piscataway; Charlotte; Toronto (Canada); São Paulo (Brazil) |
Executive management, R&D, enterprise sales, legal, corporate finance |
|
EMEA |
1,419 |
−1.2% |
11.4% |
London (U.K.); Paris; Frankfurt; Sofia; Riga; Milan; Luxembourg; Amsterdam; Stockholm; Gothenburg; Dubai (UAE) |
Institutional sales, analytics engineering, European regulatory compliance |
|
Consolidated |
12,444 |
−2.8% |
100.0% |
33 global offices across 19 countries |
45% content, 28% technology, 22% sales, 5% corporate |
Functional headcount comprises:
* Content Operations: 45% (~5,600 employees), centered in Manila, Philippines, and Hyderabad, Chennai, and Mumbai, India.* Technology & Product Development: 28% (~3,480 employees), split between U.S. technical centers and Indian engineering facilities.
* Sales & Client Solutions: 22% (~2,740 employees), positioned adjacent to global financial client bases.
* Corporate Support: 5% (~620 employees), covering administration, legal, finance, and human resources.
Approximately 68% of all global employees (~8,460 staff) are situated in Indian and Philippine Global Centers of Excellence (COEs). COE costs are allocated across the Americas, EMEA, and Asia Pacific segments based on relative revenue generation. Property, plant, and equipment (PPE) and lease right-of-use (ROU) assets totaled $192.5 million: U.S. assets stood at $87.8 million (45.6%, including the 91,718 sq. ft. Norwalk, CT headquarters lease and two physical U.S. data centers), the U.K. held $33.9 million (17.6%), the Philippines held $28.6 million (14.9%), and All Other Countries accounted for $42.2 million (21.9%).
Offshore treasury distribution holds $233.3 million in cash and cash equivalents (plus $6.3 million restricted cash), with 64.9% ($151.4 million) domiciled outside the U.S.: EMEA holds $105.9 million (45.4%, led by the U.K.), Asia Pacific holds $45.5 million (19.5%, in the Philippines and India), and domestic U.S. entities hold $81.9 million (35.1%). Unremitted foreign earnings remain permanently reinvested; calculating associated unrecognized deferred tax liabilities is disclosed as impracticable.
Operating expenses face currency exposures across the Indian Rupee (INR), Philippine Peso (PHP), British Pound (GBP), and Euro (EUR). Net foreign exchange shifts decreased FY2026 operating income by $2.1 million. A balance-sheet translation loss of $5.96 million entered Accumulated Other Comprehensive Loss (AOCL), versus a $15.57 million gain in FY2025. FactSet maintains 12-month cash flow forward hedges covering INR, PHP, GBP, and EUR expenses through Q4 FY2027. Under Note 7A sensitivity modeling, a 10% USD devaluation increases forward hedge fair value by ~$19.0 million, but reduces unhedged operating income by $51.0 million.
Procurement profiles reveal high supplier concentration. Total contractual purchase obligations reached $360 million as of August 31, 2026 ($352 million in FY2025), encompassing multi-year market data feeds, software licenses, and cloud hosting. Two content vendors each account for >10% of total third-party data costs. Although FactSet maintains two physical U.S. data centers, a single cloud supplier provides the majority of cloud computing support, with technology hosting expenses driving a 40 basis point increase in Cost of Services as a percentage of revenue in FY2026.
Debt obligations total $1,370.0 million in principal: $500.0 million in 2.900% Senior Notes maturing March 1, 2027 (classified as current debt on August 31, 2026), $500.0 million in 3.450% Senior Notes maturing 2032, and $375.0 million under a variable-rate Term Facility. On August 28, 2026, FactSet amended its credit facility, pushing term loan maturity to 2029, extending revolving facility maturity to August 2031, removing mandatory quarterly amortizations, and expanding revolving commitments by $500.0 million to $1.5 billion (Total Leverage Ratio covenant capped at 3.75x).
Corporate governance saw executive turnover in FY2025 and FY2026. Sanoke Viswanathan was appointed CEO (September 8, 2025), receiving $19.52 million in pre-tax onboarding compensation ($15.05 million net of tax, or $0.41 EPS) and 297,902 Performance Stock Options (PSOs) struck at $295.63. The PSOs require FactSet's trailing 30-day VWAP to reach 150% of grant VWAP within five years (ending September 22, 2030), cliff-vest after three years (September 22, 2028), carry a 10-year term, and hold a grant-date valuation of $73.85 per option (~$22.0 million total via Monte Carlo modeling with 24.72% volatility and 4.08% risk-free rate). Joshua Warren was named CFO (April 13, 2026), Christopher McLoughlin took office as Chief Legal Officer (December 2, 2024), and Di Hirji joined as Chief People and Workforce Transformation Officer (August 3, 2026), replacing departing executives F. Philip Snow, Linda Huber, and Helen Shan. Stockholders approved the 2025 Omnibus Incentive Plan on December 18, 2025 (authorizing 1.8 million shares; 4.2 million total available at year-end). Management and independent auditor Ernst & Young LLP confirmed the full remediation of a prior IT General Controls material weakness over revenue and receivables as of August 31, 2026.
Legal liabilities center on *Dinosaur Financial Group LLC et al. v. S&P Global Inc., FactSet Research Systems Inc., and the American Bankers Association* in the U.S. District Court for the Southern District of New York. The suit alleges antitrust and licensing violations regarding CUSIP Global Services (CGS). On August 28, 2026, class certification was granted, but subsequently vacated on September 10, 2026, with additional briefing ordered. In India, statutory labor law reforms enacted November 21, 2025 drove a $2.88 million pre-tax charge ($2.22 million net of tax) for post-employment benefits. Concurrently, European clients are passing compliance requirements under the EU Digital Operational Resilience Act (DORA) onto FactSet, while U.S. regulators phase in the Financial Data Transparency Act (FDTA).
HDIN Institutional Verdict
FactSet Research Systems Inc.’s strategic posture demonstrates an operational divergence: front-office marketing promotes Generative AI and Model Context Protocol (MCP) deployment, while SEC filings document $0.0 million in standalone disaggregated AI revenues. Note 3’s explicit assertion that disaggregating revenues by product is "impracticable" underscores that GenAI tools (including FactSet Mercury) operate as defensive table-stakes enhancements designed to protect the core platform's >95% dollar-based ASV retention rate against Bloomberg and S&P Global, rather than serving as immediate, high-margin revenue drivers.
The economics of FactSet's technology stack face structural friction. Cost of Services grew 11.4% in FY2026, outpacing top-line organic growth (6.7%) by 470 basis points and eroding gross margin by 210 basis points to 50.6%. This cost expansion was driven by a 100 basis point rise in employee comp, a 50 basis point increase in software amortization from capitalized internal development ($114.7 million CapEx, 24.9% tech capitalization rate), and a 40 basis point rise in cloud hosting and software licenses. Concurrently, Item 1A Risk Factors warn of rising, variable costs tied to third-party LLM licensing, token consumption, and GPU inference. FactSet's planned shift toward multi-year enterprise platform agreements with usage-based AI token pricing introduces monetization uncertainty, as clients resist moving away from fixed-fee workstation predictability.
The operational foundation carries geographic and supplier exposure. Locating 70% of headcount in Asia Pacific and 68% (~8,460 staff) in Indian and Philippine COEs has anchored FactSet's adjusted operating margin at 34.5%. However, this labor model leaves operating income sensitive to local currency shifts ($51.0 million annual exposure on an unhedged 10% USD drop) and regional regulatory mandates, illustrated by the $2.88 million India Labor Code charge. Simultaneously, procurement relies on two data suppliers accounting for >10% of content costs each, while cloud operations depend on a single primary provider.
Liquidity and cash conversion provide near-term stability. Generating $707.5 million in free cash flow (107.3% conversion of Adjusted Net Income) and securing an amended $1.5 billion credit facility provide sufficient capital to absorb $46.2 million in severance, fund $644.0 million in buybacks, and address the $500.0 million Senior Notes maturing on March 1, 2027. However, with class-action antitrust litigation over CGS data licensing unresolved and CEO equity tied to a 50% stock price appreciation hurdle through 2030, management must prove that AI workflow integration can convert defensive seat retention into measurable enterprise revenue growth.
Presentation Download & Video Access:
* Presentation Download: Click the PDF download link under 'Related Topics' to access the full institutional presentation of this report.
* Video Link: Click this link to watch the HDIN analyst briefing on YouTube.
About HDIN Research:
HDIN Research is a premier global market intelligence and strategic advisory firm specializing in institutional-grade financial analysis, supply chain audits, and macroeconomic forecasting. Our dedicated sector analysts deliver actionable, data-driven insights tailored for private equity, hedge funds, and corporate strategy teams. Visit us at http://www.hdinresearch.com.
2026 AI Transparency Footer:
"This intelligence report was authored by HDIN Research analysts following a rigorous audit of official corporate filings. AI was utilized for massive-scale data synthesis and structural drafting, ensuring 100% inclusion of reported data points. All strategic insights, financial modeling, and final verdicts were verified by our editorial board to ensure professional accuracy and compliance with 2026 Google Search E-E-A-T standards."