Winnebago Industries, Inc.: Assembly Footprint Consolidation in Northern Indiana and Iowa Accelerates as Net Debt-to-EBITDA Falls to 2.08x
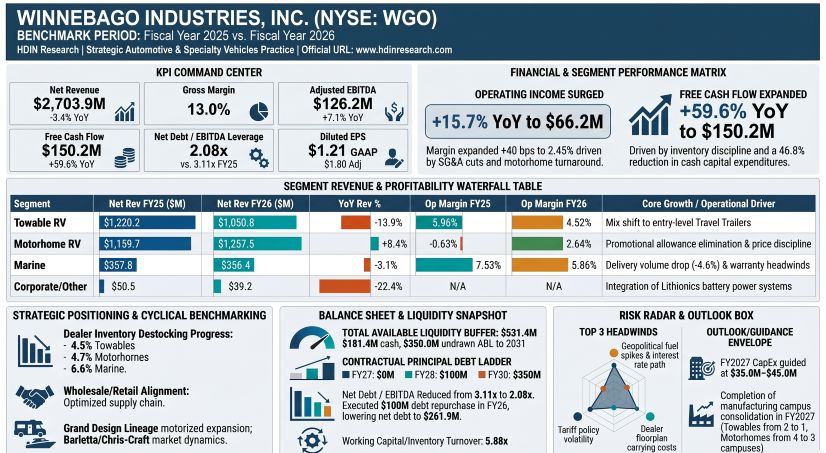
1. Winnebago Industries, Inc. [NYSE: WGO] contracted gross debt to $450.0 million while generating $150.2 million in free cash flow, driving net debt leverage down from 3.11x to 2.08x.
2. Production capacity rationalization targets the consolidation of Indiana Towable campuses from two to one, and motorized campuses across Iowa and Indiana from four to three by Fiscal 2027.
3. Intangible amortization imposed a $0.59 per share drag on Fiscal 2026 GAAP diluted EPS of $1.21, while the Chris-Craft trade name valuation cushion compressed to under 10%.
Figure WINNEBAGO INDUSTRIES Financial Performance Analysis
 Segmental Realities, Margin Turnaround, and Balance Sheet Rollforward
Winnebago Industries, Inc. recorded Fiscal 2026 consolidated net revenues of $2,703.9 million, down 3.4% (-$94.3 million) from $2,798.2 million in Fiscal 2025. Operating income (EBIT) expanded 15.7% (+$9.0 million) to $66.2 million (2.45% margin, up 41 bps), driven by an 8.2% reduction in selling, general, and administrative (SG&A) expenses from $285.8 million (10.2% of sales) to $262.3 million (9.7% of sales), capturing $23.3 million in overhead cost containment. Net income increased 34.2% from $25.7 million to $34.5 million. Consolidated unit deliveries fell 10.1% YoY from 41,546 units to 37,352 units.
Table Segment-Level Revenue and Operating Profitability, FY2025–FY2026
Revenue and EBIT in US$ millions.
|
Operating Segment |
FY2025 Revenue |
FY2026 Revenue |
Revenue YoY |
FY2025 EBIT |
FY2026 EBIT |
FY2025 Margin |
FY2026 Margin |
Margin Change |
|---|---|---|---|---|---|---|---|---|
|
Towable RV |
$1,220.2 |
$1,050.8 |
−13.9% |
$72.7 |
$47.5 |
5.96% |
4.52% |
−144 bps |
|
Motorhome RV |
$1,159.7 |
$1,257.5 |
+8.4% |
$(7.3) |
$33.2 |
−0.63% |
2.64% |
+327 bps |
|
Marine |
$367.8 |
$356.4 |
−3.1% |
$27.7 |
$20.9 |
7.53% |
5.86% |
−167 bps |
|
Corporate / All Other |
$50.5 |
$39.2 |
−22.4% |
$(35.9) |
$(35.4) |
N/A |
N/A |
N/A |
|
Consolidated Total |
$2,798.2 |
$2,703.9 |
−3.4% |
$57.2 |
$66.2 |
2.04% |
2.45% |
+41 bps |
Table Segment-Level Unit Volume and Average Selling Price, FY2025–FY2026
Volume in units; average selling price (ASP) in US$ per unit.
|
Operating Segment |
FY2025 Volume |
FY2026 Volume |
Volume YoY |
FY2025 ASP |
FY2026 ASP |
ASP YoY |
|---|---|---|---|---|---|---|
|
Towable RV |
31,169 |
27,004 |
−13.4% |
$38,797 |
$38,700 |
−0.3% |
|
Motorhome RV |
5,742 |
5,925 |
+3.2% |
$206,441 |
$214,350 |
+3.8% |
|
Marine |
4,635 |
4,423 |
−4.6% |
$80,888 |
$82,496 |
+2.0% |
|
Corporate / All Other |
N/A |
N/A |
N/A |
N/A |
N/A |
N/A |
|
Consolidated Total |
41,546 |
37,352 |
−10.1% |
N/A |
N/A |
N/A |
Within Towable RVs, Fifth Wheel deliveries declined 26.1% YoY from 9,455 units to 6,983 units, dropping from 30.3% to 25.9% of segment volume, while lower-priced Travel Trailers rose to 74.1% of mix (20,021 units). In Motorhome RVs, Class B deliveries rose 15.0% YoY to 1,934 units and Class C rose 8.8% to 3,099 units, while Class A luxury chassis units dropped 26.3% to 892 units.
Table INVENTORY CARRYING VALUE & WORKING CAPITAL
|
Inventory Component |
FY2025 |
FY2026 |
Change |
Change (%) |
|---|---|---|---|---|
|
Finished Goods |
$46.8 |
$47.2 |
+$0.4 |
+0.9% |
|
Work-in-Process (WIP) |
$121.2 |
$137.9 |
+$16.7 |
+13.8% |
|
Raw Materials |
$282.3 |
$273.6 |
−$8.7 |
−3.1% |
|
Total Gross Inventory (FIFO) |
$450.3 |
$458.7 |
+$8.4 |
+1.9% |
|
Less: LIFO Reserve |
($53.9) |
($54.0) |
−$0.1 |
+0.2%* |
|
Net Carrying Value of Inventories |
$396.4 |
$404.7 |
+$8.3 |
+2.1% |
Operating cash flow expanded 30.9% to $168.7 million in Fiscal 2026 (from $128.9 million). Cash capital expenditures fell 46.8% to $18.5 million (segment-reported CapEx contracted 38.8% to $24.1 million, down from $39.4 million), driving free cash flow up 59.6% from $94.1 million to $150.2 million. Depreciation expense totaled $38.3 million ($38.5 million in FY25), finite intangible amortization was $21.7 million ($22.1 million in FY25), and total depreciation and amortization reached $60.0 million ($60.6 million in FY25). Segment CapEx comprised Towables at $6.2 million ($5.4M in FY25), Motorhomes at $11.4 million ($28.9M in FY25, -60.6%), Marine at $3.0 million ($4.0M in FY25), and Corporate at $3.5 million ($1.1M in FY25). Cash CapEx-to-depreciation dropped to 0.48x, below capital maintenance levels. Disclosed restructuring outlays totaled $1.6 million in FY2026 and $2.9 million in FY2025 ($4.5 million cumulative).
The contractual principal maturity ladder consists of:
* Fiscal 2027: $0.0 million
* Fiscal 2028: $100.0 million (6.25% Senior Secured Notes)
* Fiscal 2029: $0.0 million
* Fiscal 2030: $350.0 million (3.25% Convertible Senior Notes; conversion rate 11.3724 shares per $1,000 principal / ~$87.93 conversion price; 2030 call spread sold warrants at $135.28 strike price, costing $20.6 million net after tax; effective interest rate 3.80%; FY2026 interest expense $13.0 million)
* Fiscal 2031: $0.0 million
* Fiscal 2032 and thereafter: $0.0 million
Liquidity totaled $531.4 million at August 29, 2026, comprising $181.4 million in cash and cash equivalents ($174.0 million in FY2025) and $350.0 million in undrawn capacity on the Asset-Based Revolving Credit Facility (extended August 20, 2026 to August 20, 2031, with a $35.0 million letter of credit sub-limit, unused commitment fee of 0.25%, and drawn pricing of SOFR + 0.10% credit adjustment + 1.25% to 1.75% margin). Consolidated EBITDA expanded 7.1% from $117.8 million to $126.2 million, lowering net debt from $366.5 million to $261.9 million. Full covenant compliance was maintained as of August 30, 2025, and August 29, 2026.
Geographic Sourcing, Dealer Floorplans, and Footprint Realignment
Winnebago Industries manufactures across three regional production clusters, distributing units through an independent network exceeding 750 physical dealer locations across the United States and Canada:
* Northern Iowa Hub (Motorhomes & Special Vehicles): Forest City, Iowa (owned campus, corporate offices, motorhome assembly, mobile medical/command specialty units, parts distribution); Lake Mills, Iowa (owned assembly plant); Charles City and Waverly, Iowa (component manufacturing facilities).
* Northern Indiana Hub (Towables, Motorhomes & Marine): Middlebury, Indiana (owned and leased Grand Design towable and Newmar motorized campuses); Elkhart, Indiana (leased towable assembly plants and aftermarket customer care centers); Nappanee, Indiana (owned and leased Newmar Class A campuses); Bristol, Indiana (owned and leased Barletta pontoon facilities).
* Florida Hub (Marine & Battery Electrification): Sarasota, Florida (owned Chris-Craft dayboat manufacturing campus); Clearwater and Largo, Florida (leased Lithionics manufacturing sites producing lithium iron phosphate battery packs with proprietary NeverDie Technology).
Supply chain dependencies involve concentrated input partners:
* Single Raw Material Supplier Exposure: One supplier accounted for 14% of raw material purchases in FY2025 and 12% in FY2026. Key commodity exposures include steel, aluminum, fiberglass, lumber, copper, lead, and rubber.
* Motorized Chassis OEM Base: Production utilizes Ford Motor Company, Mercedes-Benz, Stellantis N.V. (Ram ProMaster), Freightliner Trucks, and Spartan RV Chassis under non-guaranteed allocation agreements.
* Marine Propulsion: Outboard engines depend exclusively on Mercury Marine.
* Regulatory Tariff Shifts: Following the February 2026 U.S. Supreme Court ruling that struck down International Emergency Economic Powers Act (IEEPA) tariffs, Winnebago secured cost recoveries from suppliers against historic tariff outlays, mitigating reinstated tariffs under Sections 232, 301, and 122 across imports from China, Mexico, and Canada.
Executive governance transitions and human capital restructuring include:
* Headcount Rationalization: Consolidated workforce was reduced 5.7% from ~5,300 employees (20% salaried, 80% hourly) in August 2025 to ~5,000 employees (21% salaried, 79% hourly) in August 2026. Zero employees are covered under collective bargaining agreements.
* Safety Performance: Total Recordable Incident Rate (TRIR) decreased 22% from 3.51 (FY2024) to 2.75 (FY2025); Days Away Restricted Transfer (DART) rate declined 43% from 1.75 (FY2024) to 1.00 (FY2025). Employee Resource Groups include the Women's Inclusion Network (WIN, est. 2022), Veterans Network (est. 2023), and Mosaic Multicultural Network (est. 2024).
* C-Suite Realignments: Michael J. Happe remains President and CEO (since Jan 2016). Donald J. Clark was appointed Group President – Towable RV Segment & President – Grand Design RV (Nov 1, 2024). Casey J. Tubman was named Group President – Newmar & Winnebago Motorized (Sept 1, 2025). Christopher D. West was named President – Winnebago Motorhome & Specialty Vehicles (Nov 1, 2024). Bryan L. Hughes expanded duties to Senior VP – CFO, IR, IT & Business Development (Sept 1, 2025). Stacy L. Bogart assumed Senior VP – Chief Legal Officer, Secretary & Corporate Responsibility (Oct 16, 2024). Bret A. Woodson was named Senior VP – CHRO, Chief of Staff & Corporate Administration (Oct 16, 2024).
* Incentive Realignment: In Q4 FY2025, the Officer Incentive Compensation Plan transitioned segment evaluation from Adjusted EBITDA to Operating Income (payout range: 0% to 200%). Annual stock-based compensation totaled $14.6 million (FY24), $15.8 million (FY25), and $16.9 million (FY26) under the Amended and Restated 2019 Omnibus Incentive Plan (2.7 million shares available for grant as of August 29, 2026). On October 20, 2025, the Winnebago Motorhome Profitability Improvement Bonus Plan established a $0.9 million award for Casey J. Tubman ($0.3 million per tranche across three trailing-12-month margin hurdles through FY2028; paid 50% cash / 50% RSUs with 1-year vesting). A mandatory compensation clawback policy is enforced under SEC Rule 10D-1.
HDIN Institutional Verdict
Winnebago Industries' strategy of reducing capital expenditures to protect cash conversion at the trough of the recreational vehicle cycle is verified by balance sheet execution. Delivered cash CapEx of $18.5 million contracted 46.8% YoY, undershooting management's baseline guidance range of $35.0 million to $45.0 million by $16.5 million. By limiting physical reinvestment to 0.48x depreciation, corporate leadership freed cash to execute $200.0 million in cumulative Senior Secured Note repurchases across FY2025 and FY2026, driving annual interest expense down 19.5% to $20.9 million.
However, structural cost headwinds remain evident in warranty metrics. The warranty expense intensity ratio climbed 69 basis points from 2.79% in Fiscal 2024 to 3.48% in Fiscal 2026. This upward trend reflects dealer hourly labor rate inflation and replacement part costs, concentrated primarily within the Grand Design towable division. This issue is underscored by Deloitte's continued CAM designation.
Furthermore, while the motorized turnaround expanded segment EBIT by $40.4 million through the elimination of dealer clearing discounts and the rollout of the Grand Design Lineage Series, the Marine division remains pressured. With Chris-Craft's trade name cushion compressed to under 10% following the complete impairment of its $30.3 million goodwill balance, the segment remains sensitive to macroeconomic shifts. A 100 bps upward movement in WACC or a 10.0% reduction in luxury boat volume would trigger an impairment of the remaining $29.3 million brand asset.
Capital allocators must evaluate whether the guided FY2027 CapEx rebound ($35.0M–$45.0M) can execute the consolidation of Indiana Towable campuses (from two to one) and Iowa/Indiana Motorhome campuses (from four to three) without interrupting production flow or depleting cash reserves.
Presentation Download & Video Access
- Presentation Download: Click the PDF download link under 'Related Topics' to access the full institutional presentation of this report.
- Video Link: Click this link to watch the HDIN analyst briefing on YouTube.
About HDIN Research
HDIN Research is a premier global market intelligence and strategic advisory firm specializing in institutional-grade financial analysis, supply chain audits, and macroeconomic forecasting. Our dedicated sector analysts deliver actionable, data-driven insights tailored for private equity, hedge funds, and corporate strategy teams. Visit us at http://www.hdinresearch.com.
2026 AI Transparency Footer
"This intelligence report was authored by HDIN Research analysts following a rigorous audit of official corporate filings. AI was utilized for massive-scale data synthesis and structural drafting, ensuring 100% inclusion of reported data points. All strategic insights, financial modeling, and final verdicts were verified by our editorial board to ensure professional accuracy and compliance with 2026 Google Search E-E-A-T standards."