AMC Robotics Corporation: Software Agency Pivot Drives 83.5% Gross Margin Amid Related-Party Working Capital Trap and SEPA Dilution Exposure
1. AMC Robotics Corporation [NASDAQ: AMCI] transitioned from negative-margin e-commerce hardware distribution to an agent-based software revenue-sharing model under ASC 606, expanding consolidated gross margins by 5,981 basis points year-over-year to 83.48% in the first six months of fiscal 2026.
2. The operating perimeter displays extreme related-party dependency: Chief Executive Officer Shengwei (Sean) Da controls 83.2% of voting power, while affiliated entities account for 87.7% of interim revenue, 100% of accounts receivable ($3.25 million), and historically 100% of physical hardware procurement through Shanghai-based Senslab Technology Co., Ltd.
3. Liquid solvency is stabilized through a $50.0 million Standby Equity Purchase Agreement (SEPA) and zero bank debt, but capital overhang totals 64.11% on a fully diluted basis, while aspirational robotics lines remain pre-commercial with interim R&D spending of just $25,999.
Figure AMC Robotics S-1 Financial Anatomy & Strategic Assessment
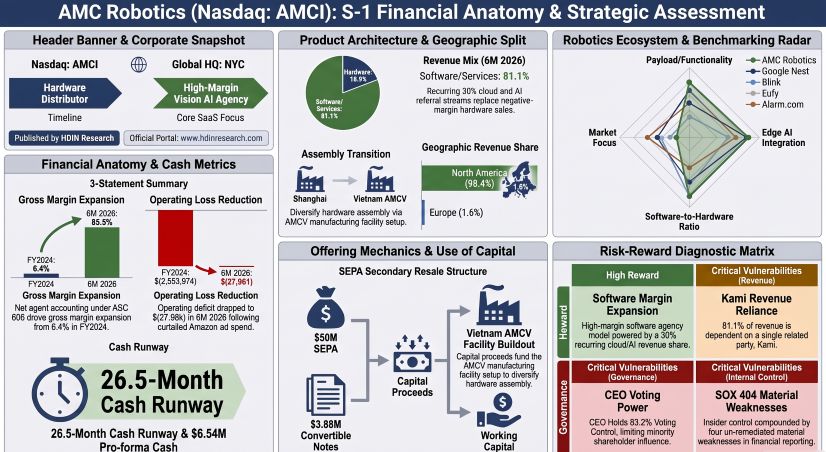 Segmental Realities, Working Capital Mechanics, and Unit Margins
AMC Robotics Corporation's operational pivot manifests as a deliberate contraction of low-margin physical camera volumes sold via Amazon Fulfillment by Amazon (FBA) infrastructure, replaced by high-margin software agency monetization. In the six-month period ended June 30, 2026 (6M 2026), consolidated revenue contracted 33.48% year-over-year to $2,121,793, down from $3,189,800 in 6M 2025 and $10,200,957 in FY2024.
This top-line shrinkage masks an accounting margin transformation under ASC 606. Hardware revenue, recognized on a gross principal basis, dropped 86.81% year-over-year in 6M 2026 to $259,965. Concurrently, recurring revenue-sharing streams from Kami Vision Inc. (Kami)—recognized on a net agent basis with zero direct cost of goods sold—expanded 60.48% year-over-year to $1,720,137, representing 81.07% of consolidated net revenue. Consolidated gross margin expanded from 6.43% in FY2024 to 47.70% in FY2025 (+4,127 bps) and reached 83.48% in 6M 2026 (+5,981 bps YoY).
Table Consolidated Statement of Operations and Profitability Analysis, FY2024–FY2025 and H1 2025–H1 2026
|
Line Item |
FY2024 |
FY2025 Restated |
YoY Change |
H1 2025 |
H1 2026 |
YoY Change |
|---|---|---|---|---|---|---|
|
Product Revenue — Third-Party |
$7,439,899 |
$2,346,474 |
−68.46% |
$1,971,116 |
$259,965 |
−86.81% |
|
Product Revenue — Related Party |
$6,270 |
$515,756 |
+8,125.77% |
$146,789 |
$141,691 |
−3.47% |
|
Revenue Share — Related Party (Kami) |
$2,754,788 |
$3,118,617 |
+13.21% |
$1,071,895 |
$1,720,137 |
+60.48% |
|
Total Consolidated Revenue |
$10,200,957 |
$5,980,847 |
−41.37% |
$3,189,800 |
$2,121,793 |
−33.48% |
|
Cost of Revenue — Hardware & Freight |
$6,178,914 |
$2,294,257 |
−62.87% |
$1,779,798 |
$245,562 |
−86.20% |
|
Cost of Revenue — E-Commerce Platform Fees |
$2,039,708 |
$670,405 |
−67.13% |
$569,017 |
$55,039 |
−90.33% |
|
Cost of Revenue — Inventory Impairment Charges |
$1,326,355 |
$163,037 |
−87.71% |
$86,073 |
$49,929 |
−42.00% |
|
Total Cost of Revenue |
$9,544,977 |
$3,127,699 |
−67.23% |
$2,434,888 |
$350,530 |
−85.60% |
|
Consolidated Gross Profit |
$655,980 |
$2,853,148 |
+334.95% |
$754,912 |
$1,771,263 |
+134.63% |
|
Consolidated Gross Margin |
6.43% |
47.70% |
+4,127 bps |
23.67% |
83.48% |
+5,981 bps |
Table Operating Expenses and Operating Profitability
|
Line Item |
FY2024 |
FY2025 Restated |
YoY Change |
H1 2025 |
H1 2026 |
YoY Change |
|---|---|---|---|---|---|---|
|
General & Administrative Expense |
$2,190,635 |
$2,796,272 |
+27.65% |
$1,601,648 |
$1,739,135 |
+8.58% |
|
Sales & Marketing Expense |
$2,026,051 |
$612,992 |
−69.74% |
$612,219 |
$34,090 |
−94.43% |
|
Research & Development Expense |
$255,414 |
$58,072 |
−77.26% |
$23,833 |
$25,999 |
+9.09% |
|
Reversal of Credit Loss — Related Party |
($1,262,146) |
$0 |
N/A |
$0 |
$0 |
N/A |
|
Total Operating Expenses |
$3,209,954 |
$3,467,336 |
+8.02% |
$2,237,700 |
$1,799,224 |
−19.59% |
|
Operating Income / (Loss) |
($2,553,974) |
($614,188) |
+75.95% |
($1,482,788) |
($27,961) |
+98.11% |
|
Operating Margin |
−25.04% |
−10.27% |
+1,477 bps |
−46.49% |
−1.32% |
+4,517 bps |
Table Other Income, Fair-Value Changes, and Net Results
|
Line Item |
FY2024 |
FY2025 Restated |
YoY Change |
H1 2025 |
H1 2026 |
YoY Change |
|---|---|---|---|---|---|---|
|
Other Income — Related Party Subsidy |
$1,779,528 |
$1,217,586 |
−31.58% |
$1,217,586 |
$0 |
−100.00% |
|
Loss on Change in Fair Value of Warrants |
$0 |
($25,549,272) |
N/A |
$0 |
$0 |
N/A |
|
Net Interest & Other Income / (Expense) |
($3,414) |
$24,162 |
N/A |
($34,814) |
($1,724) |
N/A |
|
Reported Net Income / (Loss) |
($776,960) |
($24,926,364) |
−3,108.10% |
($306,090) |
($30,129) |
+90.16% |
Operating losses narrowed by 98.11% in 6M 2026 to $(27,961), driven by an aggressive 94.43% curtailment in sales and marketing expenses (from $612,219 in 6M 2025 to $34,090 in 6M 2026) as paid Amazon advertising was eliminated. General and administrative expenses absorbed 96.66% of operating overhead ($1,739,135) due to public listing compliance following the de-SPAC transaction with AlphaVest Acquisition Corp. on December 9, 2025.
The 6M 2026 Adjusted EBITDA bridges to positive territory at $26,930:
* Reported Net Loss: $(30,129)
* (+) Provision for Income Taxes: $444
* (-) Net Interest Income: $(61,693)
* (+) Non-Cash Operating Lease Expense: $49,734
* (+) Inventory Lower of Cost or Net Realizable Value Write-downs: $49,929
* (+) Net Warranty Accrual Provision: $18,645
* Adjusted EBITDA: $26,930
The balance sheet reveals structural working capital distortion. Total cash stood at $4,544,353 as of June 30, 2026. However, operating cash flow for 6M 2026 was $(1,479,668), driven by working capital expansion in related-party trade receivables. Days Sales Outstanding (DSO) lengthened to 228.0 days, Days Inventory Outstanding (DIO) reached 477.6 days (due to reduced hardware COGS baselines), and Days Payable Outstanding (DPO) dropped to 0.5 days following the full repayment of supplier liabilities. The Cash Conversion Cycle (CCC) settled at +705.1 days.
Table Working Capital, Liquidity, and Operating Efficiency Metrics (2024–June 2026)
|
Working Capital & Balance Sheet Metrics |
December 31, 2024 (USD) |
December 31, 2025 (Restated, USD) |
June 30, 2026 (USD) |
|---|---|---|---|
|
Cash and Cash Equivalents |
358,887 |
7,004,601 |
4,544,353 |
|
Accounts Receivable – Third Parties |
54,302 |
427 |
268 |
|
Accounts Receivable – Related Parties (Kami & ZKCam) |
190,168 |
2,065,890 |
3,251,050 |
|
Inventories, Net |
3,555,876 |
1,069,465 |
771,483 |
|
Prepayments and Advances to Suppliers (Senslab SH) |
0 |
21,387 |
1,077,914 |
|
Total Current Assets |
7,222,686 |
11,056,823 |
10,144,040 |
|
Accounts Payable – Related Party (Senslab) |
8,543,243 |
0 |
1,795 |
|
Short-Term Bank Borrowings (HSBC) |
821,982 |
0 |
0 |
|
Total Current Liabilities |
9,666,992 |
795,843 |
890,819 |
|
Net Working Capital (NWC) |
(2,444,306) |
10,260,980 |
9,253,221 |
|
Current Ratio |
0.75x |
13.89x |
11.39x |
|
Quick Ratio |
0.27x |
12.00x |
9.00x |
|
Days Sales Outstanding (DSO) |
8.7 days |
70.5 days |
228.0 days |
|
Days Inventory Outstanding (DIO) |
135.8 days |
269.8 days |
477.6 days |
|
Days Payable Outstanding (DPO) |
326.5 days |
498.6 days |
0.5 days |
|
Cash Conversion Cycle (CCC) |
-102.0 days |
-158.3 days |
+705.1 days |
Capital Architecture, Derivative Exposure, and SEPA Dilution
AMC Robotics Corporation's capital structure carries dilution risk via structured equity lines and reset warrants. On September 17, 2026, the company entered into a Standby Equity Purchase Agreement (SEPA) with Ayame Asset Holdings LLC, granting an aggregate purchase commitment of up to $50.0 million over 24 months, alongside $3.88 million in pre-paid convertible promissory notes funded at a 10.0% Original Issue Discount (OID).
* Pre-Paid Note Tranche 1: $2,220,000 principal funded on September 17, 2026, delivering $1,998,000 gross cash ($1,958,000 net of a $40,000 structuring fee).
* Pre-Paid Note Tranche 2: $1,660,000 principal ($1,494,000 net cash), conditional upon registration statement effectiveness and shareholder approval under Nasdaq Exchange Cap rules.
* Conversion Terms: The notes mature on September 17, 2027, bear 0.0% stated coupon (escalating to 18.0% upon default), and convert at the lower of a Fixed Price of $4.017 per share or a Variable Price set at 92.0% of the lowest daily Volume Weighted Average Price (VWAP) across the five trading days prior to conversion. The contractual floor price is set at $0.25 per share.
The Form S-1 registers 4,685,588 shares for secondary resale by Ayame Asset Holdings LLC:
* SEPA Commitment Shares: 450,000 shares issued on September 17, 2026 ($0 consideration).
* Convertible Note Settlement Shares: Up to 1,570,850 shares (modeled at an assumed conversion price of $2.47 per share).
* SEPA Advance Shares: Up to 2,664,738 shares.
Table Capital Overhang and Potential Share Dilution Analysis as of October 21, 2026
|
Capital Overhang Category |
Underlying Shares |
Dilution Relative to Basic Shares Outstanding (23,889,661) |
|---|---|---|
|
Basic Common Shares Outstanding (October 21, 2026) |
23,889,661 |
100.00% (Baseline) |
|
Standby Equity Commitment Shares (Issued September 17, 2026) |
450,000 |
+1.88% |
|
Prepaid Convertible Notes 1 and 2 – Issuable Shares (Estimated) |
1,570,850 |
+6.58% |
|
SEPA Advance Shares Registered under Form S-1 |
2,664,738 |
+11.15% |
|
Private Investment in Public Equity (PIPE) Warrants (Exercise Price: $4.017; Expiration: December 2030) |
5,576,301 |
+23.34% |
|
Kami Vision Inc. – Exercisable Corporate Warrants |
3,833,707 |
+16.05% |
|
Executive Inducement Warrants (Haibo Wang and Chaohong Sun) |
1,219,816 |
+5.11% |
|
Total Potential Fully Diluted Share Base |
39,205,073 |
+64.11% Potential Dilution |
Pro forma Net Tangible Book Value (NTBV) as of October 21, 2026, stood at $12,304,468, or $0.515 per share (incorporating $1,998,000 net proceeds from Note 1 and the 450,000 commitment shares). Relative to the benchmark market price of $2.47 per share on October 16, 2026, new public equity participants face immediate structural dilution of $1.955 per share, or 79.15%. Under the contractual $0.25 floor price, theoretical drawdowns under the complete $50.0 million facility could require up to 200,000,000 shares, capped absent shareholder approval by the 19.99% Nasdaq Exchange Cap (4,685,588 shares) and 4.99% beneficial ownership caps.
Infrastructure Layout, Component Sourcing, and Supply Chain Moats
AMC Robotics Corporation operates without internal manufacturing assets, utilizing a multi-region corporate perimeter:
* Global Executive Headquarters: 12 East 49th Street, Suite 1805, New York, NY 10017, USA. Leased through November 2027, carrying an ASC 842 Right-of-Use asset of $75,298 and a lease liability of $81,810 at a 5.49% incremental borrowing discount rate.
* Emerging Assembly Infrastructure (Vietnam): Incorporated AMCV Company Limited on January 5, 2026, as a wholly owned subsidiary in Vietnam to establish assembly, robotic testing, and hardware commissioning capacity. AMCV operated under a short-term lease exemption ($960 rent expense in 6M 2026) and is the primary recipient of future SEPA capital expenditure proceeds.
* Contract Manufacturing & Asian Procurement: Procured 100% of historical finished hardware from Senslab Technology Co., Ltd. (Senslab SH) in Shanghai, China, and Senslab HK Limited. CEO Sean Da maintains a 38.0% equity interest in Senslab SH. Sourced inventory procurement fell from $6.89 million in FY2024 to $0.19 million in FY2025, with AMC advancing $1,056,527 in cash prepayments to Senslab SH during 6M 2026.
* Logistics Footprint: In FY2025, AMC transferred approximately 85% of active inventory out of Amazon FBA infrastructure into contracted domestic third-party logistics (3PL) warehouse networks across the United States.
Table Hardware Supply Chain Structure, Geographic Risks, and Strategic Mitigation Measures
|
Hardware Subsystem / BOM Layer |
Primary Sourcing Entity |
Geographic Risks and Lead Times |
Strategic Redundancy / Alternative |
|---|---|---|---|
|
Contract Assembly and Final Unit Build |
Senslab Technology Co., Ltd. (38% CEO-owned) / Senslab HK |
Shanghai, China. Lead times are exposed to trans-Pacific maritime shipping disruptions and tariff fluctuations (10%–125% in 2025). |
Establishing AMCV Company Limited in Vietnam to facilitate the migration of assembly operations. |
|
Edge Silicon and Processing SoC |
Contract-procured by Senslab (22 nm layout specifications) |
Dependent on access to Asian foundries and exposed to capacity allocation constraints across the global semiconductor cycle. |
Proprietary in-house dual-chip power-state switching architecture. |
|
Optical Modules and CMOS Sensors |
Asian Tier-2 suppliers procured through Senslab |
Standard commercial camera component lead times; certification delays affected the 2K upgrade in FY2025. |
Qualifying alternative components from Southeast Asian suppliers. |
|
Power Storage and Lithium-Ion Battery Packs |
Contract electronics manufacturing services (EMS) providers through Senslab |
Stringent battery safety-testing requirements and additional maritime surcharges for transporting hazardous materials. |
Direct cash advances of $1.06 million in the six months ended June 30, 2026, to secure raw-material battery supplies. |
|
“YI” Core Trademark Authorization |
Shanghai Xiaoyi Technology Co., Ltd. |
The licensing agreement is scheduled to expire on October 22, 2026. |
Migrating customer accounts to the Kami Vision software application interface. |
Commercialized hardware lines comprise indoor/outdoor smart cameras, driving recorders, and action cameras under the "YI" trademark. Product specifications focus on transitioning legacy 1080P hardware to 2K resolution, utilizing 22nm System-on-Chip (SoC) architectures and dual-chip power switches that cycle between operational and sleep states to reduce current leakage and thermal dissipation. Sourced hardware components accounted for 78% of retail selling prices in FY2025 (compared to 81% in FY2024).
The company's non-commercial robotics pipeline outlines preliminary R&D into wearable Augmented Reality (AR) glasses, commercial drones, AI agent systems, and automated industrial warehouse monitoring devices. However, the Form S-1 omits hardware specifications for specialized robotics components, such as harmonic/RV reducers, servo drive motors, or LIDAR modules. Internal R&D allocation totaled $255,414 in FY2024 (2.50% of revenue), $58,072 in FY2025 (0.97% of revenue), and $25,999 in 6M 2026 (1.23% of revenue). Internal technical leadership was established on October 1, 2026, through the appointment of Dr. Ang Li (Assistant Professor at the University of Maryland, formerly with Qualcomm AI Research) as Chief Technology Officer. To supplement external capabilities, AMC completed a $1,000,000 investment in Etronium AI Inc. during 6M 2026 across two Simple Agreements for Future Equity (SAFEs) at a $10.0 million valuation cap.
Customer concentration is heavily geared toward North America, which contributed 98.36% ($2,086,952) of consolidated revenues in 6M 2026, up from 67.98% ($4,065,747) in FY2025. European revenue contracted to 1.64% ($34,841) in 6M 2026, down from 32.02% ($1,915,100) in FY2025, driven by the December 1, 2025 termination and deconsolidation of Chinese Variable Interest Entities (Shanghai Xiaoyun and Kunshan Yishijue, which resulted in a $5,310 deconsolidation loss).
HDIN Institutional Verdict
AMC Robotics Corporation's operational pivot addresses historical unit-level hardware losses, but institutional asset managers must balance gross margin expansion against working capital concentration and governance risk:
1. Cash Trapped in Related-Party Balances: While headline gross margin reached 83.48%, operating cash flow remained negative at $(1.48M) in 6M 2026. Cash conversion is delayed by Kami Vision Inc., which accounted for 81.07% of interim revenue and 84.40% of trade receivables ($2,743,892 out of $3,251,050 total related-party AR). DSO of 228.0 days indicates that AMC’s operational liquidity is tied directly to Kami's collection performance.
2. R&D Disconnect on Robotics Valuation: The corporate identity centers around next-generation robotics and vision AI. However, 6M 2026 internal R&D expenditure of $25,999 (1.23% of sales) is insufficient to design and commercialize physical robotics architectures, drones, or AR optical hardware. Current operational revenue reflects a software reseller agency model, while robotics initiatives remain early-stage concepts supported by an external $1.0 million SAFE asset.
3. Corporate Governance and Internal Control Risk: CEO Sean Da retains 83.2% voting control, allowing the company to operate under Nasdaq controlled company exemptions. Financial statement integrity is challenged by four un-remediated material weaknesses in internal control over financial reporting identified by UHY LLP: a lack of internal U.S. GAAP accounting staff, absence of segregation of duties, deficient inventory tracking controls, and the lack of a formal review and approval process for related-party transactions (exemplified by a prior-period revision increasing FY2025 accrued liabilities and accumulated deficit by $109,022).
4. Financing Dilution Overhang: The variable-rate SEPA convertible note mechanism (converting at 92.0% of the lowest 5-day VWAP) presents potential dilution risk for public shareholders. Any operational disruption—such as the non-renewal of the "YI" brand agreement expiring October 22, 2026, or supply friction during the Vietnam manufacturing transfer—could trigger a downward conversion spiral under the variable SEPA mechanics.
Presentation Download & Video Access
* Presentation Download: Click the PDF download link under 'Related Topics' to access the full institutional presentation of this report.
* Video Link: Click this link to watch the HDIN analyst briefing on YouTube.
About HDIN Research
HDIN Research is a premier global market intelligence and strategic advisory firm specializing in institutional-grade financial analysis, supply chain audits, and macroeconomic forecasting. Our dedicated sector analysts deliver actionable, data-driven insights tailored for private equity, hedge funds, and corporate strategy teams. Visit us at http://www.hdinresearch.com.
2026 AI Transparency Footer
This intelligence report was authored by HDIN Research analysts following a rigorous audit of official corporate filings. AI was utilized for massive-scale data synthesis and structural drafting, ensuring 100% inclusion of reported data points. All strategic insights, financial modeling, and final verdicts were verified by our editorial board to ensure professional accuracy and compliance with 2026 Google Search E-E-A-T standards.