Crossfor Co., Ltd.: Strategic Restructuring and Factory Liquidation Near Bangkok as 496 bps Gross Margin Contraction Signals Bullion-Driven Earnings Dilution
1. Crossfor Co., Ltd. [TYO: 7810] expanded FY2026 top-line revenue by 47.3% YoY to 5,536.17M JPY, but gross margin contracted 496 bps to 26.63% due to low-margin bullion sales and agency distribution.
2. Operating cash flow remained negative at -58.95M JPY alongside complete liquidation of the Bangkok press facility, which triggered a 19.39M JPY extraordinary withdrawal loss.
3. Institutional risk centers on balance sheet encumbrance (1,104.87M JPY mortgaged assets against 2,443.19M JPY debt) and a potential 41.02% equity dilution overhang from convertible bonds and warrants.
Figure Crossfor FY2026 Executive Financial Diagnostic & Strategic Moat Audit
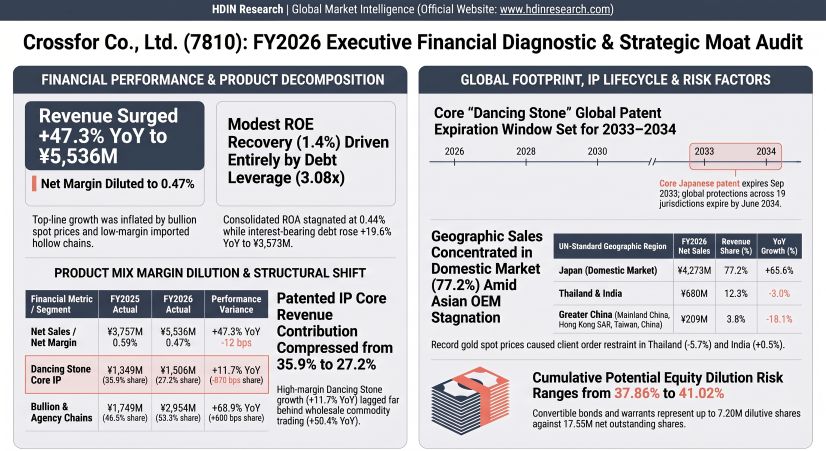 Segmental Realities, Earnings Decomposition, and Margin Compression
A forensic audit of Crossfor Co., Ltd. [TYO: 7810] for FY2026 (the 39th fiscal period ended July 31, 2026) establishes that top-line expansion diverged sharply from underlying cash generation and margin resilience. Consolidated net sales expanded 47.3% YoY (+1,778.91M JPY) from 3,757.26M JPY in FY2025 to 5,536.17M JPY in FY2026. However, gross profit margin deteriorated from 31.58% to 26.63% (-496 bps YoY), following an initial drop from 34.76% in FY2024.
The expansion was heavily weighted toward lower-margin, commodity-linked wholesale categories rather than core patented licensing. The "Other" category—comprising precious metal bullion sales, domestic live commerce supply, and market evaluation gains from precious metal re-refining—expanded 50.4% YoY (+744.75M JPY) to 2,221.74M JPY, accounting for 41.9% of the absolute top-line increase. Agency distribution of imported hollow chains sourced from YT Gold (Indonesia) climbed 169.0% YoY (+460.07M JPY) to 732.25M JPY. Automated Tennis Chain sales rose 63.2% YoY (+416.53M JPY) to 1,076.02M JPY.
Conversely, high-margin proprietary Dancing Stone lines (finished products, parts, and own-brand items) posted a modest 11.7% aggregate expansion to 1,506.17M JPY, diluting their revenue contribution from 35.9% in FY2025 to 27.2% in FY2026. Export component sales of Dancing Stone parts declined 11.1% YoY (from 621.95M JPY to 552.66M JPY) as bullion spot spikes prompted order deferrals across India and Thailand, compounded by North American tariff costs. Proprietary consumer brand sales (Cross for NewYork) dropped 3.2% YoY to 87.66M JPY.
Table Consolidated Financial Performance, Cash Flow, Working Capital, and Balance Sheet Metrics (FY2024–FY2026)
|
Segmental Revenue & Operational Metric |
FY2024 (37th Fiscal Year) |
FY2025 (38th Fiscal Year) |
FY2026 (39th Fiscal Year) |
YoY Variance (FY2026) |
|---|---|---|---|---|
|
Consolidated Net Sales |
JPY 3,413.98M |
JPY 3,757.26M |
JPY 5,536.17M |
+47.3% |
|
Gross Profit |
JPY 1,186.73M |
JPY 1,186.73M |
JPY 1,474.11M |
+24.2% |
|
Gross Profit Margin |
34.76% |
31.58% |
26.63% |
-496 bps |
|
Operating Income |
JPY 55.45M |
JPY 55.45M |
JPY 94.91M |
+71.2% |
|
Operating Income Margin |
1.62% |
1.48% |
1.71% |
+23 bps |
|
Ordinary Income / (Loss) |
JPY (6.43M) |
JPY 23.89M |
JPY 61.61M |
+157.9% |
|
Net Income Attributable to Parent Company |
JPY 28.39M |
JPY 22.09M |
JPY 26.25M |
+18.8% |
|
Net Profit Margin |
0.83% |
0.59% |
0.47% |
-12 bps |
|
Return on Equity (ROE) |
1.6% |
1.2% |
1.4% |
+0.2 pts |
|
Return on Assets (ROA) |
0.54% |
0.44% |
0.44% |
0.0 pts |
|
Asset Turnover |
0.65x |
0.74x |
0.93x |
+0.19x |
|
Financial Leverage (Equity Multiplier) |
2.91x |
2.80x |
3.08x |
+0.28x |
|
Operating Cash Flow (OCF) |
JPY 483.12M |
JPY (125.81M) |
JPY (58.95M) |
+JPY 66.86M |
|
Free Cash Flow (OCF + ICF) |
JPY 410.54M |
JPY (146.84M) |
JPY (201.13M) |
-JPY 54.29M |
|
Cash Scissor Gap (Net Income vs. OCF) |
+JPY 454.73M |
JPY (147.91M) |
JPY (85.20M) |
+JPY 62.70M |
|
Trade Receivables |
JPY 665.40M |
JPY 723.40M |
JPY 782.79M |
+8.2% |
|
Days Sales Outstanding (DSO) |
71.1 days |
70.3 days |
51.6 days |
-18.7 days |
|
Total Inventory Balance |
JPY 2,121.01M |
JPY 2,121.01M |
JPY 2,369.05M |
+11.7% |
|
Days Inventory Outstanding (DIO) |
347.5 days |
301.2 days |
212.9 days |
-88.3 days |
|
Trade Payables |
JPY 149.84M |
JPY 149.84M |
JPY 170.04M |
+13.5% |
|
Days Payables Outstanding (DPO) |
24.6 days |
21.3 days |
15.3 days |
-6.0 days |
|
Cash Conversion Cycle (CCC) |
394.0 days |
350.2 days |
249.2 days |
-101.0 days |
|
Total Assets |
JPY 5,218.14M |
JPY 5,057.99M |
JPY 5,947.71M |
+17.6% |
|
Total Net Assets |
JPY 1,790.61M |
JPY 1,806.86M |
JPY 1,929.36M |
+6.8% |
|
Equity Ratio |
34.3% |
35.7% |
32.4% |
-3.3 pts |
|
Current Ratio |
205.2% |
205.2% |
233.0% |
+27.8 pts |
|
Quick Ratio |
88.6% |
77.4% |
99.5% |
+22.1 pts |
|
Total Interest-Bearing Debt |
JPY 2,891.75M |
JPY 2,986.75M |
JPY 3,572.86M |
+19.6% |
|
Debt-to-Equity (D/E) Ratio |
1.61x |
1.65x |
1.85x |
+0.20x |
A DuPont analysis indicates that the minor improvement in reported ROE from 1.2% in FY2025 to 1.4% in FY2026 was driven entirely by balance sheet leverage (the Equity Multiplier increased from 2.80x to 3.08x) and nominal asset turnover acceleration (from 0.74x to 0.93x), while the net profit margin eroded to 0.47%.
Operating cash flow remained negative at -58.95M JPY, reflecting a multi-year cash drain following -125.81M JPY in FY2025. Operating cash outflow was driven by raw material procurement and inventory accumulation, requiring a cash allocation of -249.94M JPY. Total inventory reached 2,369.05M JPY (comprising 1,097.00M JPY in finished products, 499.68M JPY in work-in-process, and 772.37M JPY in raw materials). Cost of Goods Sold absorbed 50.90M JPY in inventory valuation write-downs (棚卸資産評価損), compared to 42.48M JPY in FY2025.
Independent auditor Ohwa Audit Corporation designated inventory valuation as a Key Audit Matter (KAM). Auditors similarly designated Deferred Tax Asset (DTA) recoverability as a KAM, reflecting a 100% valuation allowance of 471.65M JPY applied against consolidated gross deferred tax assets (477.08M JPY at parent level), which offset 299.08M JPY in tax loss carryforwards and 88.35M JPY in cumulative asset impairments, leaving net DTAs at 1.81M JPY.
SG&A costs advanced 21.9% YoY to 1,379.20M JPY. Personnel and officer expenses totaled 490.68M JPY, inflated by a parent wage base-up (+36.3% YoY to an average annual salary of 6.96M JPY across 60 parent employees). Commissions paid rose 28.1% YoY to 204.12M JPY, representing 215.1% of operating income. Interest expenses rose 42.7% YoY to 53.64M JPY on 3,572.86M JPY in interest-bearing debt (60.1% of assets). Short-term obligations due within one year total 1.49B JPY (984.47M JPY short-term borrowings, 460.55M JPY current portion of long-term debt, 34.00M JPY current bonds, and 8.98M JPY lease liabilities). The Board declared an annual dividend of 0.63 JPY per share (11.05M JPY total), absorbing 102.3% of parent company annual net profit (10.57M JPY) and 42.1% of consolidated net profit.
Infrastructure Layout, Supply Chain Dislocation, and Regional Moats
Crossfor operates a centralized manufacturing and technology hub in Kofu, Yamanashi Prefecture, supplemented by showroom and wholesale operations in Tokyo and localized overseas distribution offices.
* Kofu Headquarters & Production Facility (Yamanashi Prefecture): Owned land measuring 3,743.13 m² (book value 312.66M JPY) and buildings/structures (book value 736.91M JPY), alongside rental real estate (land: 18.44M JPY, buildings: 25.22M JPY). The site houses 58 employees (+10 temporary staff), primary R&D laboratories, quality inspection units, and automated Tennis Chain manufacturing lines (machinery book value: 32.06M JPY; leased equipment: 62.43M JPY).
* Tokyo Branch (Taito-ku, Ueno): Leased commercial showroom and wholesale hub managing live commerce accounts and domestic jewelry retailers, manned by 2 staff (annual rental expenditure: 6.19M JPY).
* Global Subsidiary Network: Comprises Crossfor H.K. Ltd. (Hong Kong SAR, 100% equity, 6 staff); Crossfor China (Shenzhen, China, 100% equity, fixtures 15k JPY, 3 staff); Crossfor (Thailand) Co., Ltd. (Bangkok, Thailand, 49.0% equity controlled, buildings 47k JPY, fixtures 610k JPY, 3 staff); CROSSFOR INDIA PRIVATE LIMITED (Mumbai, India, 99.9% equity, machinery 14.31M JPY, 0 staff); and domestic unit D.Tech (Tokyo, 100% equity, 0 staff). Consolidated fixed assets total 1.44B JPY.
* Restructuring and Thai Press Facility Liquidation: Crossfor executed a structural exit from its hanger parts press manufacturing operations in Thailand during FY2026. The exit triggered a 19.39M JPY Extraordinary Business Withdrawal Loss, accounting for 95.9% of total special losses (20.22M JPY, which also included a 0.83M JPY fixed asset disposal loss). The charge covered forfeited rental factory deposits, machinery storage fees, and liquidation clearance costs. Machinery disposals generated 3.28M JPY in book value reductions and a 308k JPY disposal gain. Crossfor transitioned Thailand operations entirely to a fabless model.
Parent manufacturing costs totaled 3,882.11M JPY (+57.2% YoY). Raw material inputs (gold, platinum, silver, diamonds, and cubic zirconia) surged 59.0% YoY to 2,963.42M JPY, representing 76.3% of total manufacturing costs. Subcontracting processing fees rose 70.8% YoY to 887.76M JPY (22.9% share), while direct labor dropped 12.6% to 43.02M JPY (1.1% share), and depreciation/other expenses fell to -12.09M JPY (-0.3% share).
The international commercial moat is bound to patent expiration timelines across 20 jurisdictions covering the two-point ring suspension Dancing Stone mechanism:
* Japan: Reg. No. 5424435, expires September 13, 2033.
* United States: US Patent 9167872, expires March 31, 2034.
* Europe: EP 2848153, expires March 18, 2034.
* South Korea: KR 10-1549448, expires March 21, 2034.
* Taiwan, China: Patent I562744, expires March 25, 2034.
* Hong Kong SAR: HK 1208315, expires March 27, 2034.
* Thailand: TH 57687, expires March 12, 2034.
* India: IN 362406, expires March 21, 2034.
* Peripheral & Next-Gen IP: Single Dancing Stone, EXL-LOCK (registered in JP, US, CN, KR; pending in EU, IN), automated Tennis Chain manufacturing tooling, and optical Crossfor Cut.
With key patents entering their final 7 to 8 years of statutory protection, Crossfor has deployed an anti-counterfeit conversion framework via its Shenzhen, Hong Kong, and Mumbai subsidiaries, converting unauthorized copyists into licensed component purchasers. Crossfor recorded zero off-balance sheet guarantees, zero pending litigation reserves, and marked Asset Retirement Obligations (ARO) as not applicable, handling lease restorations via direct deposits.
HDIN Institutional Verdict
Management presents FY2026 as a recovery marked by 47.3% top-line growth and a 71.2% operating profit rebound. HDIN Research's forensic audit reveals three structural vulnerabilities that challenge this narrative:
1. Synthetic Gross Margin Support via Commodity Re-Refining: Gross profit expansion (+24.2% YoY to 1.47B JPY) was bolstered by non-operating precious metal re-refining evaluation gains and passed-through bullion price inflation. In-house core patent licensing (Dancing Stone) contracted to 27.2% of total sales, down from 35.9% in FY2025. Given that raw materials constitute 76.3% of manufacturing outlays, a stabilization or downward correction in precious metal spot prices will eliminate this accounting tailwind and exacerbate gross margin compression.
2. Balance Sheet Illiquidity and Credit Saturation: Asset encumbrance remains elevated. Crossfor has mortgaged 1,104.87M JPY of its Kofu Headquarters real estate to secure 2,443.19M JPY in bank borrowings across 3 transaction banks. Concurrently, the company executed 750.00M JPY of its 850.00M JPY syndicated bank overdraft line, leaving an operational cash cushion of 100.00M JPY (11.8% available capacity). Trade receivable exposure is heavily concentrated, with the top 10 domestic live commerce and wholesale B2B accounts representing 45.4% (355.39M JPY) of total receivables (782.79M JPY), offset by an allowance for doubtful accounts of 3.38M JPY.
3. Structural Dilution Overhang and Governance Friction: The capital injection executed on January 5, 2026 with GP Listed Company Investment LP introduced 700.00M JPY in 1st Unsecured Convertible Bonds (due January 2031; 0.3% coupon) and 2,142,800 warrants (6th Series). After 500,000 warrants were exercised in FY2026 (raising 70.3M JPY) and 200,000 post-period, remaining instruments represent 6,442,800 shares—equivalent to a 37.86% potential equity expansion relative to 17.55M net outstanding shares (excluding 798,081 treasury shares). Under annual downward price reset clauses floored at 126 JPY on July 5 (2026, 2027, 2028), maximum potential dilution reaches 7,198,356 shares, or a 41.02% equity overhang.
Founder Chairman Hidetaka Dobashi retains 46.25% voting control (43.37% through personal asset firm S.H Holdings Co., Ltd. and 2.88% directly), extending to 48.77% across the immediate family block, while institutional financial institutions hold 0.00% (500 shares) and retail investors hold 55.99% across 15,288 accounts. Individual executive compensation determinations remain fully delegated to President Akihiko Naito without an independent compensation committee, while the board maintains a 0.0% female representation ratio across 7 directors (despite full 100% attendance across 16 Board and 13 Audit Committee meetings).
Absent positive operating cash flow (-58.95M JPY) and with R&D spending constrained at 32.35M JPY (0.58% of sales), Crossfor’s capacity to engineer a second-generation technological replacement prior to the 2033–2034 Dancing Stone patent cliff remains constrained by debt service and overhead commitments.
Presentation Download & Video Access:
- Presentation Download: Click the PDF download link under 'Related Topics' to access the full institutional presentation of this report.
- Video Link: Click this link to watch the HDIN analyst briefing on YouTube.
About HDIN Research:
HDIN Research is a global market intelligence and strategic advisory firm specializing in institutional-grade financial analysis, supply chain audits, and macroeconomic forecasting. Our dedicated sector analysts deliver actionable, data-driven insights tailored for private equity, hedge funds, and corporate strategy teams. Visit us at http://www.hdinresearch.com.
2026 AI Transparency Footer:
"This intelligence report was authored by HDIN Research analysts following a rigorous audit of official corporate filings. AI was utilized for massive-scale data synthesis and structural drafting, ensuring 100% inclusion of reported data points. All strategic insights, financial modeling, and final verdicts were verified by our editorial board to ensure professional accuracy and compliance with 2026 Google Search E-E-A-T standards."