Ridge-i Inc.: Full Custom AI Consolidation and Forward Deployed Engineering Pivot in Tokyo as 18.28% Operating Margin Signals Scaled Asset Monetization
1. Ridge-i Inc. [TYO: 5572] restructured into pure-play Custom AI by divesting digital marketing for ¥921.58M, reaching an 18.28% operating margin and ¥3.47B net cash.
2. Deployment of 80 acquired Soken Joho engineers across Tokyo and Kyoto targets enterprise execution bottlenecks as domestic generative AI expands toward ¥1.78T by 2030.
3. Client concentration—36.88% across SBI Holdings, Unicharm, and Ebara Environmental Plant—presents near-term account dependency, cushioned by SBI's 22.56% equity stake and multi-year MLOps contracts.
Figure Ridge-i 5-Year Comprehensive Corporate Diagnostic (FY2022-FY2026)
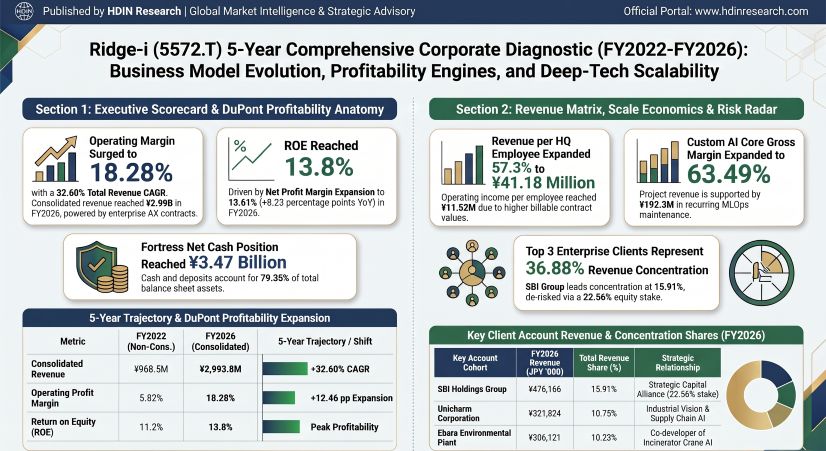 Segmental Realities, DuPont Diagnostic and Margin Trajectory
Ridge-i Inc. completed a structural realignment across FY2022–FY2026, transitioning from an exploratory artificial intelligence prototyping laboratory into an enterprise-scale transformation provider. In July 2026, the company executed the divestment of its non-core digital marketing subsidiary, Star Music Entertainment Inc., to strategic partner SBI Holdings Inc. for a cash consideration of ¥921,580 thousand. This divestment deconsolidated social media marketing (¥811,237 thousand in FY2026 sales) and music production and distribution (¥370,858 thousand in FY2026 sales), concentrating operational resources exclusively into the core Custom AI Solutions segment.
Table Consolidated Financial Performance, AI Segment Revenue, Cash Flow, and Balance Sheet Metrics (FY2022–FY2026)
|
Consolidated Financial & Operational Metric (JPY '000) |
FY2022 (Non-Consolidated) |
FY2023 (Non-Consolidated) |
FY2024 (Non-Consolidated*) |
FY2025 (Consolidated) |
FY2026 (Consolidated) |
Multi-Year Delta / Metric |
|---|---|---|---|---|---|---|
|
Total Revenue |
968,521 |
790,384 |
1,071,954 |
2,593,322 |
2,993,819 |
5-Year CAGR: 32.60%; YoY: +15.44% |
|
— Custom AI Solutions Segment Revenue |
968,521 |
790,384 |
1,071,954 |
1,280,324 |
1,811,723 |
5-Year CAGR: 16.95%; YoY: +41.51% |
|
—— AI Consulting & Development (Flow) |
N/A |
N/A |
N/A |
N/A |
1,452,805 |
80.19% of Custom AI Sales |
|
—— AI Maintenance & Operations (Stock) |
N/A |
N/A |
N/A |
N/A |
192,342 |
10.62% of Custom AI Sales |
|
—— Satellite Data AI Analytics (Specialized) |
N/A |
N/A |
N/A |
N/A |
166,576 |
9.19% of Custom AI Sales |
|
— Digital Marketing Segment (Divested) |
0 |
0 |
0 |
1,312,998 |
1,182,095 |
Derecognized in July 2026 |
|
—— Social Media Marketing |
0 |
0 |
0 |
848,741 |
811,237 |
Divested through the sale of Star Music |
|
—— Music Production & Distribution |
0 |
0 |
0 |
464,257 |
370,858 |
Divested through the sale of Star Music |
|
Contract Work Revenue |
N/A |
N/A |
N/A |
1,775,616 |
1,949,356 |
65.11% of Total Revenue |
|
Joint Development Contracts |
N/A |
N/A |
N/A |
189,400 |
194,000 |
6.48% of Total Revenue |
|
Copyright & Licensing Royalties |
N/A |
N/A |
N/A |
259,833 |
205,470 |
6.86% of Total Revenue |
|
Other / Maintenance & Platform Retainers |
N/A |
N/A |
N/A |
368,472 |
644,992 |
21.54% of Total Revenue |
|
Consolidated Gross Profit |
N/A |
N/A |
N/A |
1,325,959 |
1,646,933 |
YoY Growth: +24.21% |
|
Consolidated Gross Margin |
N/A |
N/A |
N/A |
51.13% |
55.01% |
YoY Expansion: +388 bps |
|
Custom AI Segment Gross Margin |
N/A |
N/A |
N/A |
57.68% |
63.49% |
YoY Expansion: +581 bps |
|
Operating Profit (EBIT) |
56,403 |
70,346 |
152,738 |
283,137 |
547,164 |
5-Year CAGR: 76.48%; YoY: +93.25% |
|
Operating Profit Margin |
5.82% |
8.90% |
14.25% |
10.92% |
18.28% |
YoY Expansion: +736 bps |
|
Custom AI Segment Operating Profit |
N/A |
N/A |
N/A |
N/A |
506,740 |
Custom AI Operating Margin: 27.97% |
|
EBITDA |
56,403 |
70,346 |
152,738 |
367,851 |
609,741 |
YoY Growth: +65.76%; Margin: 20.37% |
|
Net Income Attributable to Parent |
150,061 |
44,564 |
121,697 |
139,627 |
407,549 |
5-Year CAGR: 28.37%; YoY: +191.88% |
|
Return on Equity (ROE) |
11.2% |
2.6% |
5.9% |
6.5% |
13.8% |
Peak Level in FY2026 |
|
— Net Profit Margin (NPM) |
15.49% |
5.64% |
11.35% |
5.38% |
13.61% |
YoY Expansion: +823 bps |
|
— Asset Turnover (ATO) |
0.620x |
0.383x |
0.352x |
0.911x |
0.668x |
Balance Sheet Cash Expansion |
|
— Equity Multiplier (EM) |
1.104x |
1.037x |
1.247x |
1.299x |
1.212x |
Low-Leverage Financial Structure |
|
Operating Cash Flow (CFO) |
178,192 |
-145,756 |
348,619 |
51,323 |
562,008 |
YoY Rebound: +995.04% |
|
Free Cash Flow (FCF) |
173,614 |
-184,019 |
-374,400 |
-7,131 |
547,999 |
Reversal from Negative Trajectory |
|
CFO / Parent Net Income Ratio |
1.19x |
-3.27x |
2.86x |
0.37x |
1.38x |
1.32x Based on Total Net Income |
|
Cash & Term Deposits |
1,383,154 |
1,720,780 |
1,370,799 |
1,827,826 |
3,558,513 |
79.35% of Total Assets |
|
Consolidated Equity Ratio |
90.5% |
96.5% |
69.7% |
77.0% |
82.5% |
89.4% on a Non-Consolidated Basis |
|
Total Debt (Corporate Bonds) |
0 |
0 |
0 |
0 |
90,000 |
Inherited via Soken Joho; D/E: 2.43% |
|
Net Cash Position* |
-1,383,154 |
-1,720,780 |
-1,370,799 |
-1,827,826 |
-3,468,513 |
Reported as ¥3,468,513 Thousand Net Cash |
|
Unbilled Contract Assets |
N/A |
N/A |
44,243 |
97,680 |
268,235 |
YoY Growth: +174.61% |
|
Capitalized Intangible Software Assets |
N/A |
N/A |
N/A |
15,497 |
945 |
¥585 Thousand on a Non-Consolidated Basis |
|
Software-in-Progress |
0 |
0 |
0 |
0 |
0 |
No Capitalization of Software in Progress |
|
Internal R&D Expenses (SG&A) |
N/A |
N/A |
N/A |
29,444 |
32,462 |
1.08% of Revenue; 100% Expensed |
A 3-factor DuPont decomposition establishes that the ROE expansion to 13.8% in FY2026 was powered by the net profit margin surge to 13.61%, rather than financial leverage or asset velocity. Asset turnover receded from 0.911x to 0.668x as liquidity reserves accumulated to ¥3,558,513 thousand, while the equity multiplier moderated to 1.212x following the equity issuance to SBI Holdings.
The unit economics of the core Custom AI Solutions segment displayed structural operating leverage. Total manufacturing costs for Custom AI stood at ¥655,038 thousand in FY2026 (COGS of ¥661,383 thousand, down to a 36.51% cost ratio):
* Subcontractor Outsourcing Fees: ¥341,183 thousand (52.09% of manufacturing costs; 18.83% of segment revenue), scaling +31.98% YoY from ¥258,504 thousand in FY2025 as variable engineering labor absorbed peak delivery requirements.
* Direct Labor Costs: ¥206,277 thousand (31.49% of manufacturing costs; 11.39% of segment revenue), expanding +20.82% YoY from ¥170,729 thousand. Direct labor as a proportion of sales contracted by 194 bps from 13.33%, demonstrating higher realized billable rates.
* Facility Leases and Operating Rent: ¥93,113 thousand (14.21% of manufacturing costs; rent held flat at ¥41,130 thousand or 2.27% of sales; total facilities and depreciation fell from ¥65,091 thousand to ¥55,594 thousand).
* Equipment Depreciation: ¥14,465 thousand (2.21% of manufacturing costs; 0.80% of sales), down from ¥24,942 thousand following full amortization cycles on earlier analytical hardware.
Corporate overhead contained costs relative to top-line expansion. Consolidated selling, general, and administrative (SG&A) expenses rose +5.46% YoY to ¥1,099,769 thousand in FY2026 from ¥1,042,821 thousand, lowering the SG&A-to-revenue ratio by 348 bps to 36.73% (and from 45.04% to 35.12% on a non-consolidated basis). Officer compensation totaled ¥160,000 thousand (versus ¥155,950 thousand in FY2025), administrative salaries grew +4.16% to ¥171,420 thousand, and expert recruitment/advisory fees settled at ¥57,430 thousand. Research and development was 100% expensed within SG&A at ¥32,462 thousand (+10.25% YoY from ¥29,444 thousand), yielding an R&D conversion efficiency multiple of ¥55.81 in Custom AI sales and ¥15.61 in segment operating profit per ¥1.00 of expensed R&D.
Table Enterprise AI Competitor Benchmarking Matrix — Ridge-i and Selected Japanese AI Companies
|
Enterprise AI Competitor Benchmarking Matrix |
Ridge-i Inc. (5572.T) |
PKSHA Technology (3993.T) |
Appier Group (4180.T) |
ExaWizards (4259.T) |
Laboro.AI (5586.T) |
|---|---|---|---|---|---|
|
Exchange Listing Tier |
TSE Growth Market |
TSE Prime Market |
TSE Prime Market |
TSE Growth Market |
TSE Growth Market |
|
Technical Architecture |
Multimodal deep learning, SAR satellite analytics, and industrial vision |
Conversational AI, voice NLP, and credit-scoring algorithms |
Predictive marketing technology (MarTech) and enterprise data graphs |
Enterprise digital transformation (DX) and AI transformation (AX), including multimodal healthcare AI |
Custom deep learning prototyping and development |
|
Primary Revenue Engine |
Custom AI solutions, recurring MLOps revenue, and forward-deployed engineering (FDE) services |
Software licenses and subscriptions |
Enterprise SaaS and monthly recurring revenue |
Consulting retainers and joint-venture intellectual property |
Custom deep learning development and project retainers |
|
FY2026 Revenue Base |
JPY 2,993.8M consolidated (JPY 1,811.7M from Custom AI Solutions) |
Approx. JPY 18,000M–20,000M |
Approx. JPY 30,000M–35,000M |
Approx. JPY 9,000M–10,000M |
Approx. JPY 1,500M–2,000M |
|
Operating Profit Margin |
18.28% consolidated (27.97% for Custom AI Solutions) |
Approx. 15%–18% (adjusted) |
Approx. 10%–14% |
Approx. 5%–10% |
Approx. 15%–20% |
|
Core Technical Moat |
Embedded industrial control, SAR-based GRASP EARTH platform, and SBI FLOW |
Natural language processing patents and established enterprise client base |
Multi-region Asia-Pacific consumer marketing data |
Broad cross-sector DX capabilities and corporate joint ventures |
Academic AI talent and algorithmic prototyping expertise |
|
Engineering Headcount |
44 AI specialists and 80 FDE integrators |
Approx. 600+ engineers and product managers |
Approx. 700+ global employees |
Approx. 500+ engineers and consultants |
Approx. 50–70 AI engineers and data scientists |
Infrastructure Footprint, Supply Chain Architecture and Talent Deployment
Ridge-i executes a dual-tier physical and operational footprint anchored in the Tokyo metropolitan area and supported by regional delivery hubs.
* Corporate Headquarters & Research Core: Located at Otemachi Building, 1-6-1 Otemachi, Chiyoda-ku, Tokyo, Japan. The facility houses executive leadership, multimodal AI algorithmic development, and enterprise data science operations under an annual operating lease commitment of ¥55,860 thousand.
* Systems Integration & Forward Deployed Engineering Hub: Situated in Minato-ku, Tokyo, with technical branch offices in Kyoto, operated by 100% subsidiary SK Collaboration Co., Ltd. and Soken Joho Co., Ltd. under an annual lease commitment of ¥16,830 thousand. Combined group annual lease obligations total ¥72,690 thousand.
* Compute Infrastructure: Ridge-i deployed dedicated data analysis servers at its Tokyo headquarters, funding ¥43,208 thousand of a planned ¥70,000 thousand capex allocation utilizing proceeds from its April 2023 TSE Growth initial public offering. Dedicated internal clusters manage proprietary algorithm training, while client-facing cloud runtime workloads (AWS, Microsoft Azure, Google Cloud) are passed directly through to enterprise clients.
* Geographical Compliance: 100% of external revenue and 100% of tangible fixed assets are domestic to Japan. International roadmaps for the GRASP EARTH platform adhere to United Nations cartographic standards, designating regional expansion sectors as "Taiwan, China".
The group's human capital architecture bifurcates between algorithmic research at headquarters and enterprise delivery at subsidiaries. Parent AI research headcount reached 44 regular personnel at FY2026 year-end (supplemented by 3 temporary staff, down from 8 in FY2022 and 5 in FY2025). Parent workforce metrics report an average age of 33.8 years, an average tenure of 2.5 years, and an average annual salary of ¥8,813,000 (+7.60% YoY from ¥8,191,000 in FY2025). Consolidated headcount expanded from 74 to 124 employees following the acquisition of Soken Joho (adding 80 employees: 10 Project Managers, 60 Systems Engineers, and 10 operational staff) and the divestment of Star Music Entertainment (removing 35 digital marketing personnel).
Parent regular employee productivity reached ¥41,176 thousand in revenue per employee (+25.43% YoY from ¥32,829 thousand in FY2025 and +57.30% from ¥26,176 thousand in FY2022) and ¥11,517 thousand in operating profit per employee (+177.7% YoY from ¥4,147 thousand in FY2025 and +655.5% from ¥1,524 thousand in FY2022). On a consolidated basis, revenue per employee stood at ¥24,144 thousand, an accounting artifact caused by consolidating Soken Joho's 80 staff on the balance sheet at year-end while excluding its income statement from FY2026 revenues.
Acquisition mechanics for SK Collaboration / Soken Joho Co., Ltd. (completed May 2026 for ¥200,000 thousand cash consideration) were audited under the purchase price allocation (PPA) framework:
* Assets and Liabilities Acquired: Total assets of ¥468,353 thousand (current assets of ¥344,100 thousand; fixed assets of ¥124,253 thousand) offset by total liabilities of ¥410,038 thousand (current liabilities of ¥227,053 thousand; fixed liabilities of ¥182,986 thousand), establishing net assets acquired of ¥58,315 thousand.
* Goodwill Recognized: ¥141,685 thousand, amortized linearly over 10 years at ¥14,168 thousand annually (zero allocation to discrete intangibles such as customer lists or proprietary software).
* Defined Benefit Obligations: Assumed Soken Joho's simplified retirement allowance plan, recognizing ¥60,460 thousand in retirement benefit liabilities (退職給付に係る負債).
* Star Music Divestment Offsets: The July 2026 sale of Star Music Entertainment for ¥921,580 thousand eliminated net assets of ¥835,200 thousand and unamortized goodwill of ¥266,493 thousand, generating an extraordinary gain on sale of subsidiary stock of ¥88,408 thousand and eliminating ¥33,311 thousand in annual goodwill amortization. Net goodwill on the consolidated balance sheet concluded at ¥141,411 thousand.
Strategic commercial relationships drive the operating model across targeted corporate ecosystems:
* SBI Holdings Group: Holds 974,000 shares (22.56% voting stake) via a ¥1.058B placement (390,000 new shares at ¥2,716 on September 30, 2025) and direct transfers. Generated ¥476,166 thousand in FY2026 revenue (15.91% of consolidated sales; ¥208,666 thousand from SBI Holdings, ¥267,500 thousand from SBI Securities). Backlog includes a ¥400M+ enterprise generative AI deployment contract signed in March 2026.
* Unicharm Corporation: Generated ¥321,824 thousand in FY2026 sales (10.75% of revenue, up +62.40% YoY from ¥198,170 thousand / 7.64% in FY2025) for manufacturing computer vision and quality verification systems.
* Ebara Environmental Plant Co., Ltd.: Holds 83,333 shares (1.93% stake) and generated ¥306,121 thousand in FY2026 sales (10.23% of revenue versus ¥293,851 thousand / 11.33% in FY2025), securing ongoing MLOps maintenance for automated municipal waste incineration crane control systems.
* Specialized Industrial Partners: Valqua, Ltd. (capital alliance holding 416,666 shares / 9.65% equity) for industrial seal defect inspection; KUMONOS Corporation for 3D point-cloud infrastructure crack detection; Safie Inc. for edge-camera video analytics; NHK Art for automated broadcast archive colorization; and Space Shift for Synthetic Aperture Radar (SAR) maritime oil slick detection via the xData Alliance (Tellus).
* Public Defense and Space Sector: Direct participation in the JAXA Space Strategy Fund and admission to the Japan Defense Equipment Industry Association in June 2024. The proprietary GRASP EARTH platform holds three Cabinet Office Space Development Utilization Awards: the 4th Award (2020, METI Minister Award), 5th Award (2022, Environment Minister Award), and 6th Award (2024, MLIT Minister Award). Satellite data AI analytics revenue normalized to ¥166,576 thousand in FY2026 as development transitioned to operational maintenance.
Forensic Audit, Governance Safeguards and Institutional Verdict
The audit of Ridge-i’s financial statements, conducted by independent auditor Deloitte Touche Tohmatsu LLC, highlighted revenue recognition under ASBJ Statement No. 29 as the singular Key Audit Matter (KAM). Custom AI projects recognized over time using the input method (cost-to-cost basis) represented ¥1,086,324 thousand in FY2026, comprising 36.29% of consolidated net sales and 59.96% of non-consolidated net sales. Input-based accounting depends on project manager estimates of total development man-hours and subcontractor requirements:
The expansion in contract assets from ¥97,680 thousand in FY2025 to ¥268,235 thousand in FY2026 (+174.61%) reflects active, unbilled enterprise stages for SBI Group and Unicharm. Accounts receivable fell from ¥307,522 thousand to ¥216,211 thousand, while upfront contract liabilities dropped from ¥122,175 thousand to ¥5,535 thousand. Trade receivables concentration stood at 59.0% among the top corporate client accounts. Default risk is mitigated by counterparty creditworthiness and contractual settlement cycles averaging 30 days.
Inherited interest-bearing liabilities consist of ¥90,000 thousand in corporate bonds assumed via the Soken Joho transaction:
* 2nd Unsecured Corporate Bond: ¥20,000 thousand carrying a 0.58% coupon, maturing October 23, 2026 (classified under current liabilities due within one year).
* 3rd Unsecured Corporate Bond: ¥70,000 thousand carrying a 1.03% coupon, maturing August 24, 2029 (¥20,000 thousand current portion; ¥50,000 thousand non-current liability).
The ¥90,000 thousand debt profile is backed 39.5x by total cash reserves of ¥3,558,513 thousand. Off-balance sheet commitments consist of standard operating facility leases of ¥72,690 thousand annually. Zero debt guarantees, zero derivative financial instruments, and zero asset-backed collateral pledges exist across group entities. The legal audit confirms zero pending litigation, disputes, or environmental liabilities over the past five fiscal years. Corporate actions maintain Directors & Officers (D&O) liability insurance coverage up to ¥100,000 thousand (scheduled for renewal in April 2027), international ISMS ISO/IEC 27001 certification (active since April 2020), and compliance with the Act on the Protection of Personal Information (APPI). Numerical gender pay gap disclosures are statutorily omitted under workforce sizing provisions of the Women's Advancement Promotion Act.
Corporate governance operates under an Audit & Supervisory Committee structure. The Board of Directors includes 9 members, of which 6 are Outside Directors (66.7%) and 5 are registered TSE Independent Directors (55.6%). The Audit & Supervisory Committee comprises 3 independent Outside Directors: Chairman Hompei Matsumoto (former Managing Executive Officer at SMBC Nikko Securities), Takeo Tochimoto (certified public accountant, formerly with the Bank of Japan and Azsa Audit Corporation), and Yuki Saito (attorney, formerly with Preferred Networks and Mercari). The committee held 15 audit sessions in FY2026 with 100% member attendance. SBI Group CTO Noriyoshi Kimura occupies a non-independent Outside Director seat.
Executive compensation paid across 9 directors in FY2026 totaled ¥113,570 thousand:
* Executive Directors (4 individuals): ¥96,800 thousand (¥83,100 thousand fixed base pay and ¥13,700 thousand performance-linked bonuses tied to sales and operating profit metrics).
* Outside Directors (5 individuals): ¥16,770 thousand in pure fixed cash (¥2,850 thousand for non-audit members and ¥13,920 thousand for audit committee members).
* Remuneration Policy Amendments: The general meeting of shareholders on October 27, 2026, voted on board compensation proposals: increasing non-audit director aggregate compensation caps from ¥100,000 thousand to ¥200,000 thousand annually, while authorizing a Restricted Stock Unit (RSU) plan providing up to ¥35,000 thousand / 15,000 shares for Executive Directors and ¥5,000 thousand / 2,000 shares for Audit Committee members.
Management equity incentives are governed by multi-tier stock option pools and hurdle metrics:
* 5th Stock Option Issue: 24 employees and 3 executives holding options at a ¥600 exercise price under a 5-year vesting schedule (20% annually through June 2026).
* 7th Stock Option Issue: 20,700 shares outstanding at a ¥1,571 exercise price. Hurdle condition (30% vesting if sales exceed ¥1,300,000 thousand; 100% vesting if sales exceed ¥1,700,000 thousand) was fully unlocked in FY2026.
* 8th Stock Option Issue: Allocated September 2026 covering 75,000 shares to 3 directors at a ¥2,893 strike price. Performance conditions require non-consolidated sales to surpass ¥2,550,000 thousand in FY2027 (40% exercisable) and ¥2,850,000 thousand in FY2028 or FY2029 (100% exercisable).
* Executive FY2027 Annual Bonus Formula: Standard Monthly Remuneration multiplied by a 0.0 to 1.0 performance index, requiring +10% YoY growth in both consolidated net sales (target: ≥¥3,293,000 thousand) and consolidated operating profit (target: ≥¥601,900 thousand).
The issued equity capital of 4,317,440 shares displays strategic concentration, with the top 10 shareholders controlling 70.33% of voting rights:
* Founder & President Naofumi Yanagihara: 25.55% combined equity (Yanagihara Holdings Co., Ltd. holds 648,300 shares / 15.01%; personal direct ownership of 455,400 shares / 10.54%). Executive Director Tsutomu Nakai holds 17,000 shares (0.39%).
* Corporate Strategic Blocks: SBI Holdings Inc. holds 974,000 shares (22.56%); Valqua, Ltd. holds 416,666 shares (9.65%); Ebara Environmental Plant Co., Ltd. holds 83,333 shares (1.93%).
* Retail, High-Net-Worth & Institutional Free Float: Individual investor Daisuke Gomi holds 205,000 shares (4.74%). Total active free float stands at 29.67% (domestic retail 41.7%, foreign institutions 3.2%, securities brokers 3.4%).
* Capital Allocation Execution: On September 17, 2026, the Board authorized a share repurchase program to acquire up to 160,000 shares (maximum ¥450,000 thousand) through November 30, 2026. As of September 30, 2026, 23,700 shares were repurchased for ¥73,140 thousand. Zero strategic cross-shareholdings are maintained.
From an institutional research perspective, Ridge-i's transition to an 18.28% operating margin validates the profitability of custom multimodal engineering over generic SaaS APIs. By capitalizing zero internal software development and fully charging ¥32,462 thousand in R&D to current earnings, reported operating earnings reflect actual cash generation, supported by a cash flow conversion ratio of 1.38x parent net income.
However, revenue execution carries two structural constraints. First, customer concentration remains elevated: the top 3 clients generated 36.88% of consolidated sales and 60.94% of core Custom AI revenues in FY2026. While SBI Holdings' 22.56% equity position and board seat align corporate incentives, growth remains sensitive to corporate capex cycles across SBI, Unicharm, and Ebara. Second, meeting the 8th stock option hurdle of ¥2,850,000 thousand non-consolidated revenue by FY2029 (a +16.3% CAGR) depends on re-skilling Soken Joho's 60 systems engineers into Forward Deployed Engineers capable of deploying custom generative AI models on-site. The inclusion of Soken Joho's 80 personnel provides the operational capacity required to surpass the FY2027 bonus hurdle of ¥3,293,000 thousand in consolidated sales, supported by ¥3,468,513 thousand in net cash.
Presentation Download & Video Access:
- Presentation Download: Click the PDF download link under 'Related Topics' to access the full institutional presentation of this report.
- Video Link: Click this link to watch the HDIN analyst briefing on YouTube.
About HDIN Research:
HDIN Research is a premier global market intelligence and strategic advisory firm specializing in institutional-grade financial analysis, supply chain audits, and macroeconomic forecasting. Our dedicated sector analysts deliver actionable, data-driven insights tailored for private equity, hedge funds, and corporate strategy teams. Visit us at http://www.hdinresearch.com.
2026 AI Transparency Footer:
"This intelligence report was authored by HDIN Research analysts following a rigorous audit of official corporate filings. AI was utilized for massive-scale data synthesis and structural drafting, ensuring 100% inclusion of reported data points. All strategic insights, financial modeling, and final verdicts were verified by our editorial board to ensure professional accuracy and compliance with 2026 Google Search E-E-A-T standards."