Anthropic, PBC: Cloud Marketplace Reliance Nears 48% in San Francisco as $16.29B Run-Rate Collides With $232.1B Capital Commitments
Date : 2026-10-27
Reading : 802
HDIN Executive Takeaways
1. Anthropic, PBC generated $16.286 billion in revenue for the six months ended June 30, 2026 (+1,300% YoY), crossing into GAAP operating profitability in Q2 2026 (+$974 million) as compute expense dropped to 48% of sales.
2. The company faces $232.125 billion in total mandatory cash commitments, including a $125.200 billion Broadcom Inc. lease and $77.500 billion in hyperscaler purchase agreements, cushioned by $131.651 billion in liquid assets.
3. Governance decouples capital from control via the Long-Term Benefit Trust's board majority appointment and Founder LLC's 50.1% voting floor, leaving public Class A investors economically exposed without strategic or safety override authority.
Figure Anthropic SEC Form S-1 Analysis Dashboard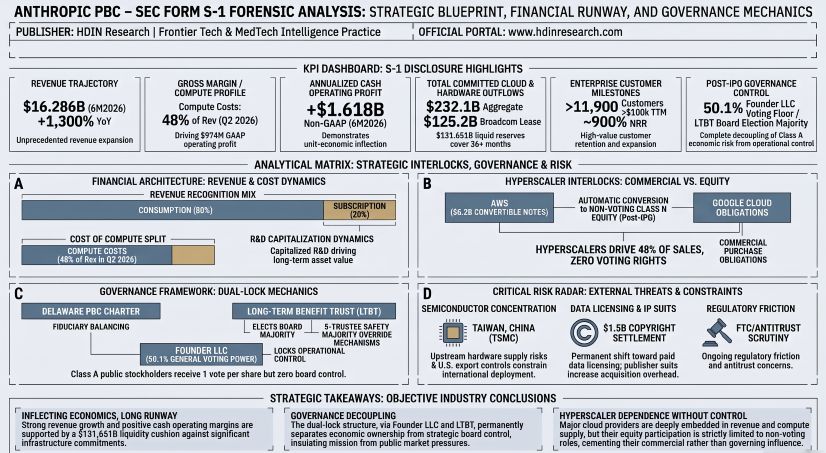
Segmental Realities, Revenue Scaling, and Unit Economic Inflection
Anthropic, PBC filed its Form S-1 Registration Statement disclosing a revenue trajectory that scaled from $41 million in FY2023 to $386 million in FY2024 (+841% YoY), $4.585 billion in FY2025 (+1,088% YoY), and $16.286 billion for the six months ended June 30, 2026 (+1,300% YoY compared to $1.163 billion in 6M2025). On a sequential basis, revenue reached $376 million in Q1 2025, $787 million in Q2 2025, $1.382 billion in Q3 2025, $2.040 billion in Q4 2025, $4.731 billion in Q1 2026, and $11.555 billion in Q2 2026 (+1,368% YoY).
Monetization is partitioned across two operational streams:
* Pay-For-Intelligence / Consumption-Based Revenue: Metered per API input/output query across the Claude Opus, Claude Sonnet, and Claude Haiku model families. Features prompt caching rates, batch processing discounts, and dedicated capacity reservations. Generated $41 million (100% of revenue) in FY2023, $288 million (75%) in FY2024, $3.800 billion (83%) in FY2025, and $13.100 billion (80%) in 6M2026.
* Subscription-Based Roster Plans: Ratably recognized per-seat billing across Claude Pro and Claude Max ($20+ per month) alongside enterprise offerings (Claude Enterprise, Claude Code, and Claude Cowork). Contributed negligible revenue in FY2023, $98 million (25%) in FY2024, $789 million (17%) in FY2025, and $3.200 billion (20%) in 6M2026.
Table Consolidated Statements of Operations (in millions of USD)
Table Operational Margins and Unit Cost Trajectory
Compute efficiency delivered operational leverage: compute and infrastructure expenses fell from 1,056% of sales in FY2023 to 48% in Q2 2026, driven by architectural improvements in Claude Opus 5.5 that reduced cost per task by ~40%. Non-GAAP Adjusted Operating Income swung from $(522) million in FY2023 (~-$43.5M/month cash burn), $(2.788) billion in FY2024 (~-$232.3M/month), $(4.854) billion in FY2025 (~-$404.5M/month), and $(1.849) billion in 6M2025 (~-$308.2M/month) to positive +$1.618 billion in 6M2026 (~+$269.7M/month cash generation pre-capex, or ~+$3.2 billion annualized).
GAAP net losses of $(41.965) billion in FY2025 and $(80.748) billion in 6M2026 stem from mark-to-market revaluations on convertible notes and derivative liabilities ($(72.388) billion in 6M2026) due to enterprise valuation marks. Sales, Marketing & Partnerships expanded to $3.168 billion in 6M2026, driven by $2.700 billion in fees deducted by Cloud Service Provider (CSP) marketplaces.
Balance sheet liquid reserves as of June 30, 2026, stood at $131.651 billion ($112.400 billion in cash and cash equivalents, $19.251 billion in short-term investments). Working capital reached $130.760 billion, total assets totaled $147.358 billion, total liabilities stood at $117.467 billion, and redeemable convertible preferred stock was $157.510 billion against $141.100 billion in cumulative capital raised, generating an accumulated deficit of $(132.902) billion and a stockholders' deficit of $(127.619) billion.
Table Enterprise Customer Cohort Trajectory
Market penetration includes >50% of the Fortune 500 and >30% of the Global 2000. Customer concentration remains dispersed: no single end-customer represented $\ge$10% of revenue for the nine months ended September 30, 2026. Top 5 customers accounted for ~25% of total revenue in 9M2026, down from ~64% for the quarter ended March 31, 2026. Government contracts represented approximately 1% of total revenue.
Infrastructure Commitments, Channel Interlocks, and Geographic Moats
Anthropic, PBC is headquartered at 548 Market Street, PMB 90375, San Francisco, California 94104, with international subsidiaries in London (United Kingdom), Dublin (Ireland), Canada, and the Asia-Pacific region.
Table Contractual Cash Obligations Schedule (in millions of USD as of June 30, 2026)
Mandatory contractual cash outflows equal $40.425 billion over the next 12 months, ~$81.400 billion over 24 months, and $122.415 billion over 36 months. Liquid reserves of $131.651 billion cover 100% of 36-month obligations without external capital infusions. Note purchase agreements contain up to $42.000 billion in total agreement financing capacity.
To mitigate Cloud Service Provider (CSP) capacity bottlenecks, Anthropic executed a transition toward "Anthropic Direct" hybrid infrastructure:
* Dedicated Silicon Lease: In March 2026, the company entered into a 5-year, $125.200 billion lease agreement with Broadcom Inc. [NASDAQ: AVGO] for specialized AI accelerators, backed by a $125.0 million restricted cash deposit placed in April 2026.
* Power Commitments: Direct agreements with utility providers feature initial terms up to 20 years, covering grid interconnections, natural gas pipelines, and standby generators with uncapped fuel cost pass-throughs.
* Compute Heterogeneity: Inference and training operate across Amazon Web Services Trainium/Inferentia, Google LLC [NASDAQ: GOOGL] TPUs, NVIDIA Corporation [NASDAQ: NVDA] GPUs, and Advanced Micro Devices, Inc. [NASDAQ: AMD] GPUs.
* Fabrication Risk: Advanced semiconductor fabrication is concentrated with Taiwan Semiconductor Manufacturing Company Limited [NYSE: TSM] in Taiwan, China.
Channel distribution dynamics demonstrate increasing reliance on third parties. Revenue transacted through CSP marketplaces (Amazon Web Services Bedrock, Google Cloud Vertex AI, and Microsoft Corporation [NASDAQ: MSFT] Azure) accounted for 11% of sales in FY2023, 32% in FY2024, 47% in FY2025, and 48% ($7.817 billion equivalent) in 6M2026. Receivables concentration with CSP intermediaries reached 58% of net accounts receivable as of June 30, 2026 (compared to 60% as of December 31, 2025, and 42% as of December 31, 2024).
Table Strategic Interlock & Partner Profile
Both Amazon.com, Inc. and Google LLC operate under commercial equality covenants: model availability parity ensures standard models deploy simultaneously across direct and hyperscaler APIs, while early checkpoints (e.g., Mythos under Project Glasswing) are subject to security gating rather than investor exclusivity.
System integrator partnerships include Accenture plc [NYSE: ACN], Deloitte, KPMG, PricewaterhouseCoopers, and Ode with Anthropic. Market sizing framework targets a $40+ trillion global cognitive labor economy, citing International Data Corporation (IDC) projections of $22.5 trillion in cumulative AI economic impact by 2031, with 1+ billion knowledge workers by 2028 and a $2+ trillion pharmaceutical R&D TAM.
Governance Architecture, Capital Structure, and Legal Contingencies
Anthropic, PBC is incorporated under Delaware General Corporation Law (DGCL) as a Public Benefit Corporation (PBC), formalizing its purpose as "the responsible development and maintenance of advanced AI for the long-term benefit of humanity." The Board operates under a tripartite fiduciary mandate balancing stockholder pecuniary interests, affected stakeholder groups, and its safety benefit purpose. Delaware law shields directors from personal liability when subordinating profit maximization to public benefit goals. Under DGCL Section 367, derivative lawsuits require a threshold ownership of 2% of outstanding shares or $2 million in market value.
Table Pre-Offering vs. Pro-Forma Capitalization
The Long-Term Benefit Trust (LTBT), established in 2023, is governed by five financially disinterested trustees who receive capped annual compensation and are barred from holding company equity. Altering Class T rights requires an 80% Board supermajority plus explicit LTBT concurrence. Parallel to this, Founder LLC holds a 50.1% voting floor on general stockholder matters via Class F stock. Dario Amodei, Daniela Amodei, and co-founders (Tom Brown, Jack Clark, Jared Kaplan, Sam McCandlish, Chris Olah) pledged 80% of personal equity to philanthropic causes, with Class F voting rights remaining with Founder LLC regardless of personal Class A transfers. Anthropic contributed 846,840,960 shares of Class N common stock (5% of fully diluted equity at June 30, 2026) to the Anthropic Public Benefit Fund, LLC, with up to an additional 2% issuable upon share price milestones.
Stock-Based Compensation (SBC) Overhang
* Immediate IPO Quarter Catch-Up: Registration statement effectiveness satisfies the performance-based condition on unvested Restricted Stock Units (RSUs), triggering an immediate single-trigger catch-up SBC expense of $2.900 billion in the IPO quarter.
* Unrecognized RSU Expense: $23.700 billion in unrecognized RSU expense as of June 30, 2026, to be recognized under the accelerated attribution method over a weighted-average period of 2.1 years.
* Other Outstanding Equity Awards: $3.100 billion in unrecognized expense recognized over 1.3 years.
* Tax Settlement: Net settlement strategy funded via net IPO cash proceeds to satisfy tax withholding obligations.
Table Forensic Litigation & Regulatory Audit
HDIN Institutional Verdict
Anthropic, PBC demonstrates hyper-growth execution, converting research benchmarks into $16.286 billion in 6M2026 revenue and inflecting to positive GAAP operating profits (+$974 million in Q2 2026). However, an institutional audit reveals three core structural vulnerabilities:
First, commercial channel dependency creates partner fee drag. With 48% of consolidated revenue transacted through Cloud Service Providers and 58% of receivables concentrated across those intermediaries, Anthropic surrendered $2.700 billion in channel partner fees during 6M2026 alone. Simultaneously, its primary distributors—Amazon.com, Inc. and Alphabet Inc.—are investing in direct competitive architectures (Amazon Nova, Google Gemini), exposing Anthropic to co-opetition risk.
Second, the pivot to "Anthropic Direct" hybrid infrastructure introduces long-term capital commitments. The 5-year, $125.200 billion Broadcom Inc. accelerator lease, alongside $77.500 billion in hyperscaler purchase obligations and $20.000 billion in datacenter power commitments (totalling $232.125 billion across 2026–2045), imposes rigid cash outflows of ~$81.400 billion over the next 24 months. While current liquid reserves ($131.651 billion) cover the 36-month obligation stack ($122.415 billion), operating margins remain exposed to price compression if open-weight alternatives from Meta Platforms, Inc. [NASDAQ: META] commoditize standard enterprise workloads.
Third, the Public Benefit Corporation governance structure and multi-class capitalization isolate Class A public investors. Founder LLC's 50.1% voting floor and the Long-Term Benefit Trust's unilateral board appointment powers prevent public shareholders from influencing strategic capital allocation, board composition, or model deployment pauses. When coupled with the $26.800 billion total post-IPO stock-based compensation overhang and single-source hardware dependencies on Taiwan Semiconductor Manufacturing Company Limited in Taiwan, China, Anthropic's equity profile carries a structural governance discount.
Presentation Download & Video Access:
- Presentation Download: Click the PDF download link under 'Related Topics' to access the full institutional presentation of this report.
- Video Link: Click this link to watch the HDIN analyst briefing on YouTube.
About HDIN Research:
HDIN Research is a premier global market intelligence and strategic advisory firm specializing in institutional-grade financial analysis, supply chain audits, and macroeconomic forecasting. Our dedicated sector analysts deliver actionable, data-driven insights tailored for private equity, hedge funds, and corporate strategy teams. Visit us at http://www.hdinresearch.com.
2026 AI Transparency Footer:
"This intelligence report was authored by HDIN Research analysts following a rigorous audit of official corporate filings. AI was utilized for massive-scale data synthesis and structural drafting, ensuring 100% inclusion of reported data points. All strategic insights, financial modeling, and final verdicts were verified by our editorial board to ensure professional accuracy and compliance with 2026 Google Search E-E-A-T standards."
1. Anthropic, PBC generated $16.286 billion in revenue for the six months ended June 30, 2026 (+1,300% YoY), crossing into GAAP operating profitability in Q2 2026 (+$974 million) as compute expense dropped to 48% of sales.
2. The company faces $232.125 billion in total mandatory cash commitments, including a $125.200 billion Broadcom Inc. lease and $77.500 billion in hyperscaler purchase agreements, cushioned by $131.651 billion in liquid assets.
3. Governance decouples capital from control via the Long-Term Benefit Trust's board majority appointment and Founder LLC's 50.1% voting floor, leaving public Class A investors economically exposed without strategic or safety override authority.
Figure Anthropic SEC Form S-1 Analysis Dashboard
Segmental Realities, Revenue Scaling, and Unit Economic Inflection
Anthropic, PBC filed its Form S-1 Registration Statement disclosing a revenue trajectory that scaled from $41 million in FY2023 to $386 million in FY2024 (+841% YoY), $4.585 billion in FY2025 (+1,088% YoY), and $16.286 billion for the six months ended June 30, 2026 (+1,300% YoY compared to $1.163 billion in 6M2025). On a sequential basis, revenue reached $376 million in Q1 2025, $787 million in Q2 2025, $1.382 billion in Q3 2025, $2.040 billion in Q4 2025, $4.731 billion in Q1 2026, and $11.555 billion in Q2 2026 (+1,368% YoY).
Monetization is partitioned across two operational streams:
* Pay-For-Intelligence / Consumption-Based Revenue: Metered per API input/output query across the Claude Opus, Claude Sonnet, and Claude Haiku model families. Features prompt caching rates, batch processing discounts, and dedicated capacity reservations. Generated $41 million (100% of revenue) in FY2023, $288 million (75%) in FY2024, $3.800 billion (83%) in FY2025, and $13.100 billion (80%) in 6M2026.
* Subscription-Based Roster Plans: Ratably recognized per-seat billing across Claude Pro and Claude Max ($20+ per month) alongside enterprise offerings (Claude Enterprise, Claude Code, and Claude Cowork). Contributed negligible revenue in FY2023, $98 million (25%) in FY2024, $789 million (17%) in FY2025, and $3.200 billion (20%) in 6M2026.
Table Consolidated Statements of Operations (in millions of USD)
| Financial Line Item | FY2023 | FY2024 | FY2025 | 6M Ended June 30, 2025 | 6M Ended June 30, 2026 | Q2 2026 (Single Quarter) |
| Revenue | $41 | $386 | $4,585 | $1,163 | $16,286 | $11,555 |
| Compute & Infrastructure | $433 | $2,522 | $7,326 | $2,334 | $8,945 | $5,558 |
| Personnel | $95 | $454 | $1,839 | $538 | $3,152 | $1,857 |
| Bartz Settlement Charge | $— | $— | $1,500 | $— | $— | $— |
| Sales, Marketing & Partnerships | $2 | $43 | $568 | $120 | $3,168 | $2,135 |
| General & Administrative | $62 | $347 | $1,412 | $306 | $1,714 | $1,031 |
| Total Operating Expenses | $592 | $3,366 | $12,645 | $3,298 | $16,979 | $10,581 |
| Operating Loss / Income | $(551) | $(2,980) | $(8,060) | $(2,135) | $(693) | +$974 |
| Interest Income | $69 | $106 | $431 | $115 | $1,111 | N/A |
| Fair Value Change (SAFEs/Convertibles) | $(1,045) | $(5,434) | $(34,308) | $(10,942) | $(72,388) | N/A |
| Other Income / (Expense), Net | $(2) | $0 | $(8) | $0 | $(8,757) | N/A |
| Loss Before Income Taxes | $(1,529) | $(8,308) | $(41,945) | $(12,962) | $(80,727) | N/A |
| Provision for Income Taxes | $2 | $1 | $20 | $7 | $21 | N/A |
| Net Loss | $(1,531) | $(8,309) | $(41,965) | $(12,969) | $(80,748) | N/A |
Table Operational Margins and Unit Cost Trajectory
| Metric / Ratio (% of Revenue) | FY2023 | FY2024 | FY2025 | 6M 2025 | 6M 2026 | Q2 2026 (Single Quarter) |
| Compute & Infrastructure Expense | 1,056% | 653% | 160% | 201% | 55% | 48% |
| Personnel Expense | 232% | 118% | 40% | 46% | 19% | 16% |
| Sales, Marketing & Partnerships | 5% | 11% | 12% | 10% | 19% | 18% |
| General & Administrative | 151% | 90% | 31% | 26% | 11% | 9% |
| GAAP Operating Margin | (1,344)% | (772)% | (176)% | (184)% | (4)% | +8.4% |
| Non-GAAP Adj. Operating Margin | (1,273)% | (722)% | (106)% | (159)% | +10% | N/A |
Compute efficiency delivered operational leverage: compute and infrastructure expenses fell from 1,056% of sales in FY2023 to 48% in Q2 2026, driven by architectural improvements in Claude Opus 5.5 that reduced cost per task by ~40%. Non-GAAP Adjusted Operating Income swung from $(522) million in FY2023 (~-$43.5M/month cash burn), $(2.788) billion in FY2024 (~-$232.3M/month), $(4.854) billion in FY2025 (~-$404.5M/month), and $(1.849) billion in 6M2025 (~-$308.2M/month) to positive +$1.618 billion in 6M2026 (~+$269.7M/month cash generation pre-capex, or ~+$3.2 billion annualized).
GAAP net losses of $(41.965) billion in FY2025 and $(80.748) billion in 6M2026 stem from mark-to-market revaluations on convertible notes and derivative liabilities ($(72.388) billion in 6M2026) due to enterprise valuation marks. Sales, Marketing & Partnerships expanded to $3.168 billion in 6M2026, driven by $2.700 billion in fees deducted by Cloud Service Provider (CSP) marketplaces.
Balance sheet liquid reserves as of June 30, 2026, stood at $131.651 billion ($112.400 billion in cash and cash equivalents, $19.251 billion in short-term investments). Working capital reached $130.760 billion, total assets totaled $147.358 billion, total liabilities stood at $117.467 billion, and redeemable convertible preferred stock was $157.510 billion against $141.100 billion in cumulative capital raised, generating an accumulated deficit of $(132.902) billion and a stockholders' deficit of $(127.619) billion.
Table Enterprise Customer Cohort Trajectory
| Metric Floor | Dec 31, 2023 | Dec 31, 2024 | Dec 31, 2025 | Sep 30, 2026 |
| Customers Billed >$100,000 TTM | ~20 | ~200 | ~1,500 | >11,900 |
| Customers Billed >$1,000,000 TTM | — | — | — | >1,900 |
| Customers Billed >$10,000,000 TTM | — | — | — | ~250 |
| Dollar-Based Net Revenue Retention (NRR) | — | — | — | ~900% |
| TTM Revenue from >$100k Cohort | $37 million | — | — | $3.500 billion |
| Multi-Product Adoption (>1 App + API) | — | — | ~30% | >50% |
| TTM Revenue per Employee | — | — | $1.4 million | >$6.6 million |
Market penetration includes >50% of the Fortune 500 and >30% of the Global 2000. Customer concentration remains dispersed: no single end-customer represented $\ge$10% of revenue for the nine months ended September 30, 2026. Top 5 customers accounted for ~25% of total revenue in 9M2026, down from ~64% for the quarter ended March 31, 2026. Government contracts represented approximately 1% of total revenue.
Infrastructure Commitments, Channel Interlocks, and Geographic Moats
Anthropic, PBC is headquartered at 548 Market Street, PMB 90375, San Francisco, California 94104, with international subsidiaries in London (United Kingdom), Dublin (Ireland), Canada, and the Asia-Pacific region.
Table Contractual Cash Obligations Schedule (in millions of USD as of June 30, 2026)
| Obligation Category | Year 1 (Next 12 Mos) | Years 2–3 (2027–2028) | Years 4–5 (2029–2030) | Thereafter (2031–2045) | Total Commitment |
| Broadcom 2026 Lease (Hardware/Datacenters) | $25,040 | $50,080 | $50,080 | $0 | $125,200 |
| Hyperscaler Cloud Compute (AWS & GCP) | $12,500 | $28,000 | $22,000 | $15,000 | $77,500 |
| Amazon.com, Inc. Convertible Notes (Debt) | $0 | $0 | $6,200 | $0 | $6,200 |
| Datacenter Power, Grid & Fuel Commitments | $1,200 | $3,500 | $4,800 | $10,500 | $20,000 |
| Bartz Copyright Class Action Settlement | $1,500 | $0 | $0 | $0 | $1,500 |
| Corporate Office & Facility Operating Leases | $185 | $410 | $450 | $680 | $1,725 |
| Total Mandatory Cash Outflows | $40,425 | $81,990 | $83,530 | $26,180 | $232,125 |
Mandatory contractual cash outflows equal $40.425 billion over the next 12 months, ~$81.400 billion over 24 months, and $122.415 billion over 36 months. Liquid reserves of $131.651 billion cover 100% of 36-month obligations without external capital infusions. Note purchase agreements contain up to $42.000 billion in total agreement financing capacity.
To mitigate Cloud Service Provider (CSP) capacity bottlenecks, Anthropic executed a transition toward "Anthropic Direct" hybrid infrastructure:
* Dedicated Silicon Lease: In March 2026, the company entered into a 5-year, $125.200 billion lease agreement with Broadcom Inc. [NASDAQ: AVGO] for specialized AI accelerators, backed by a $125.0 million restricted cash deposit placed in April 2026.
* Power Commitments: Direct agreements with utility providers feature initial terms up to 20 years, covering grid interconnections, natural gas pipelines, and standby generators with uncapped fuel cost pass-throughs.
* Compute Heterogeneity: Inference and training operate across Amazon Web Services Trainium/Inferentia, Google LLC [NASDAQ: GOOGL] TPUs, NVIDIA Corporation [NASDAQ: NVDA] GPUs, and Advanced Micro Devices, Inc. [NASDAQ: AMD] GPUs.
* Fabrication Risk: Advanced semiconductor fabrication is concentrated with Taiwan Semiconductor Manufacturing Company Limited [NYSE: TSM] in Taiwan, China.
Channel distribution dynamics demonstrate increasing reliance on third parties. Revenue transacted through CSP marketplaces (Amazon Web Services Bedrock, Google Cloud Vertex AI, and Microsoft Corporation [NASDAQ: MSFT] Azure) accounted for 11% of sales in FY2023, 32% in FY2024, 47% in FY2025, and 48% ($7.817 billion equivalent) in 6M2026. Receivables concentration with CSP intermediaries reached 58% of net accounts receivable as of June 30, 2026 (compared to 60% as of December 31, 2025, and 42% as of December 31, 2024).
Table Strategic Interlock & Partner Profile
| Strategic Partner | Capital Invested / Indebtedness | Commercial Commitments | Governance Representation | Direct Competitive Vector |
| Amazon.com, Inc. [NASDAQ: AMZN] | $6.200B in 2023/2024 Convertible Notes; up to $42.000B facility capacity | Primary cloud partner for safety research; Claude optimized for AWS Trainium; AWS Bedrock distribution | Zero Board seats; Zero voting rights; Notes convert to non-voting Class N Common Stock | First-party foundation models (Amazon Nova family) |
| Google LLC / Alphabet Inc. [NASDAQ: GOOGL] | Multi-billion Series B/C/D preferred equity; convertible instruments | Multi-year GCP hosting; TPU cluster reservations; Google Cloud Vertex AI distribution | Zero Board seats; Zero voting rights; Equity converts to non-voting Class N Common Stock | First-party foundation models (Google Gemini family) |
| Broadcom Inc. [NASDAQ: AVGO] | $125.200B 5-Year Infrastructure Lease; $125.0M restricted cash deposit | Delivery of dedicated custom accelerators, custom networking, and datacenter hardware | Zero equity governance rights; commercial supplier lease | Commercial hardware counterparty |
Both Amazon.com, Inc. and Google LLC operate under commercial equality covenants: model availability parity ensures standard models deploy simultaneously across direct and hyperscaler APIs, while early checkpoints (e.g., Mythos under Project Glasswing) are subject to security gating rather than investor exclusivity.
System integrator partnerships include Accenture plc [NYSE: ACN], Deloitte, KPMG, PricewaterhouseCoopers, and Ode with Anthropic. Market sizing framework targets a $40+ trillion global cognitive labor economy, citing International Data Corporation (IDC) projections of $22.5 trillion in cumulative AI economic impact by 2031, with 1+ billion knowledge workers by 2028 and a $2+ trillion pharmaceutical R&D TAM.
Governance Architecture, Capital Structure, and Legal Contingencies
Anthropic, PBC is incorporated under Delaware General Corporation Law (DGCL) as a Public Benefit Corporation (PBC), formalizing its purpose as "the responsible development and maintenance of advanced AI for the long-term benefit of humanity." The Board operates under a tripartite fiduciary mandate balancing stockholder pecuniary interests, affected stakeholder groups, and its safety benefit purpose. Delaware law shields directors from personal liability when subordinating profit maximization to public benefit goals. Under DGCL Section 367, derivative lawsuits require a threshold ownership of 2% of outstanding shares or $2 million in market value.
Table Pre-Offering vs. Pro-Forma Capitalization
| Share Class / Security | Pre-IPO Share Count | Pro-Forma Shares | Economic Rights | Voting Power Floor | Primary Holders & Governance Authority |
| Class A Common Stock | 10,906,111,730 (Auth.) | Offering Dependent | ~15% – 25% | ~49.9% (Shared) | Public investors; converting Series A, C-1, D-1, D-2, E-1, F-1, G-1, H-1. 1 Vote per share. |
| Class N Common Stock | 7,128,888,270 (Auth.) | Multi-Billion Shares | ~70% – 80% | 0.0% (Non-Voting) | Amazon, Google, noteholders, Anthropic Public Benefit Fund. Converts 1:1 to Class A upon third-party transfer. |
| Class T Common Stock | 1 Share | 1 Share | 0.0% | Board Majority | Long-Term Benefit Trust (LTBT). Elects and removes majority of Board. No general voting rights. |
| Class F Common Stock | 1 Share | 1 Share | 0.0% | 50.1% Voting Lock | Founder LLC (Dario Amodei, Daniela Amodei, and 5 co-founders). 50.1% floor on general stockholder votes. |
| Class E Common Stock | 0 Shares | 0 Shares | 0.0% | 0.0% | Reserved for co-founders; 0 shares issued or outstanding. |
| Preferred Series (A to H-4) | 1,040,440,652 Shares | 0 Shares | 0.0% | 0.0% | Converts 1:1 into Class A or Class N. Liquidation preferences permanently terminate. |
| Fully Diluted Share Count | ~17.0+ Billion | ~17.0+ Billion | 100.0% | 100.0% | LTBT controls Board majority; Founder LLC holds 50.1% voting lock. |
The Long-Term Benefit Trust (LTBT), established in 2023, is governed by five financially disinterested trustees who receive capped annual compensation and are barred from holding company equity. Altering Class T rights requires an 80% Board supermajority plus explicit LTBT concurrence. Parallel to this, Founder LLC holds a 50.1% voting floor on general stockholder matters via Class F stock. Dario Amodei, Daniela Amodei, and co-founders (Tom Brown, Jack Clark, Jared Kaplan, Sam McCandlish, Chris Olah) pledged 80% of personal equity to philanthropic causes, with Class F voting rights remaining with Founder LLC regardless of personal Class A transfers. Anthropic contributed 846,840,960 shares of Class N common stock (5% of fully diluted equity at June 30, 2026) to the Anthropic Public Benefit Fund, LLC, with up to an additional 2% issuable upon share price milestones.
Stock-Based Compensation (SBC) Overhang
* Immediate IPO Quarter Catch-Up: Registration statement effectiveness satisfies the performance-based condition on unvested Restricted Stock Units (RSUs), triggering an immediate single-trigger catch-up SBC expense of $2.900 billion in the IPO quarter.
* Unrecognized RSU Expense: $23.700 billion in unrecognized RSU expense as of June 30, 2026, to be recognized under the accelerated attribution method over a weighted-average period of 2.1 years.
* Other Outstanding Equity Awards: $3.100 billion in unrecognized expense recognized over 1.3 years.
* Tax Settlement: Net settlement strategy funded via net IPO cash proceeds to satisfy tax withholding obligations.
Table Forensic Litigation & Regulatory Audit
| Matter / Regulatory Action | Forum / Counterparty | Factual Allegations / Disclosures | Operational & Financial Status |
| Bartz et al. v. Anthropic PBC | U.S. District Court | Class action alleging unauthorized pre-training ingestion of copyrighted text | Settled for $1.500 billion cash reserve; final district court approval granted July 2026 |
| Music Publisher Litigation | Concord, BMG, Sony, Round Hill | Copyright infringement and removal of Copyright Management Information (CMI) from song lyrics | Active federal district court proceedings; statutory damage exposure up to $150k per work |
| Reddit, Inc. v. Anthropic PBC | California State Court | Unauthorized web scraping and terms-of-service violations | Active; removed to federal court July 2025, remanded back to state court March 30, 2026 |
| Antitrust Class Action | N.D. California | Section 1 Sherman Act claims alleging voluntary safety coordination constitutes competitor collusion | Active putative class action filed September 2026 |
| FASCSA Supply-Chain Action | Anthropic v. Dept of War | Challenge to Department of War designation as "supply-chain risk to national security" | Preliminary injunction granted on APA/First Amendment grounds; active appeal before D.C. Circuit |
| FTC Civil Investigative Demand | Federal Trade Commission | Regulatory investigation into consumer protection and autonomous AI agent risks | Non-public civil investigative demand issued October 2026 |
| U.S. Export Controls | U.S. Dept of Commerce | Bureau of Industry and Security worldwide export restrictions | Model export bans imposed on Fable 5 and Mythos 5 in June 2026 |
| State-Sponsored Intrusion | Chinese threat actor | Automated cyber intrusion exploiting Claude Code tool use across ~30 global targets | Detected September 2025; addressed via Project Glasswing gated preview architecture |
HDIN Institutional Verdict
Anthropic, PBC demonstrates hyper-growth execution, converting research benchmarks into $16.286 billion in 6M2026 revenue and inflecting to positive GAAP operating profits (+$974 million in Q2 2026). However, an institutional audit reveals three core structural vulnerabilities:
First, commercial channel dependency creates partner fee drag. With 48% of consolidated revenue transacted through Cloud Service Providers and 58% of receivables concentrated across those intermediaries, Anthropic surrendered $2.700 billion in channel partner fees during 6M2026 alone. Simultaneously, its primary distributors—Amazon.com, Inc. and Alphabet Inc.—are investing in direct competitive architectures (Amazon Nova, Google Gemini), exposing Anthropic to co-opetition risk.
Second, the pivot to "Anthropic Direct" hybrid infrastructure introduces long-term capital commitments. The 5-year, $125.200 billion Broadcom Inc. accelerator lease, alongside $77.500 billion in hyperscaler purchase obligations and $20.000 billion in datacenter power commitments (totalling $232.125 billion across 2026–2045), imposes rigid cash outflows of ~$81.400 billion over the next 24 months. While current liquid reserves ($131.651 billion) cover the 36-month obligation stack ($122.415 billion), operating margins remain exposed to price compression if open-weight alternatives from Meta Platforms, Inc. [NASDAQ: META] commoditize standard enterprise workloads.
Third, the Public Benefit Corporation governance structure and multi-class capitalization isolate Class A public investors. Founder LLC's 50.1% voting floor and the Long-Term Benefit Trust's unilateral board appointment powers prevent public shareholders from influencing strategic capital allocation, board composition, or model deployment pauses. When coupled with the $26.800 billion total post-IPO stock-based compensation overhang and single-source hardware dependencies on Taiwan Semiconductor Manufacturing Company Limited in Taiwan, China, Anthropic's equity profile carries a structural governance discount.
Presentation Download & Video Access:
- Presentation Download: Click the PDF download link under 'Related Topics' to access the full institutional presentation of this report.
- Video Link: Click this link to watch the HDIN analyst briefing on YouTube.
About HDIN Research:
HDIN Research is a premier global market intelligence and strategic advisory firm specializing in institutional-grade financial analysis, supply chain audits, and macroeconomic forecasting. Our dedicated sector analysts deliver actionable, data-driven insights tailored for private equity, hedge funds, and corporate strategy teams. Visit us at http://www.hdinresearch.com.
2026 AI Transparency Footer:
"This intelligence report was authored by HDIN Research analysts following a rigorous audit of official corporate filings. AI was utilized for massive-scale data synthesis and structural drafting, ensuring 100% inclusion of reported data points. All strategic insights, financial modeling, and final verdicts were verified by our editorial board to ensure professional accuracy and compliance with 2026 Google Search E-E-A-T standards."